- Home Screen Navigation
- Invalid Traffic Overview
- What Is Invalid Traffic?
- What are the MRC Guidelines?
- Types of General Invalid Traffic
- Types of Sophisticated Invalid Traffic
- Viewability Diagnostics Metrics
Home Screen Navigation
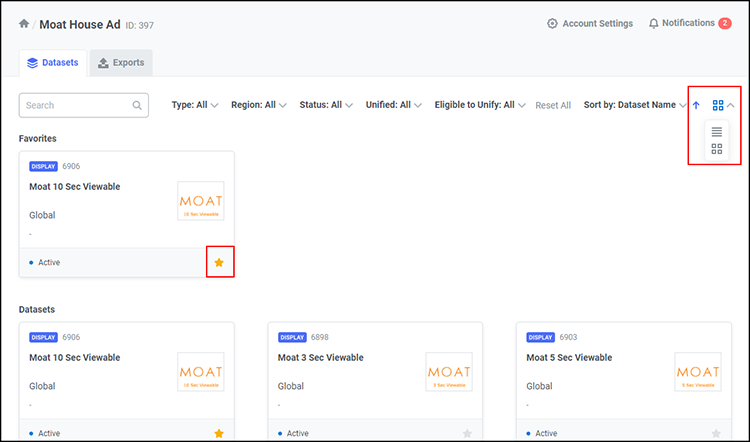
From your Analytics home screen, there are two tabs you can access.
Datasets Tab
This tab will show all datasets in your account. To narrow the results, you can search by dataset name, filter by dataset type or region, or set up favorite datasets by clicking on the star icon. You can view your datasets as a list or as a set of tiles by clicking on the icon dropdown on the right.
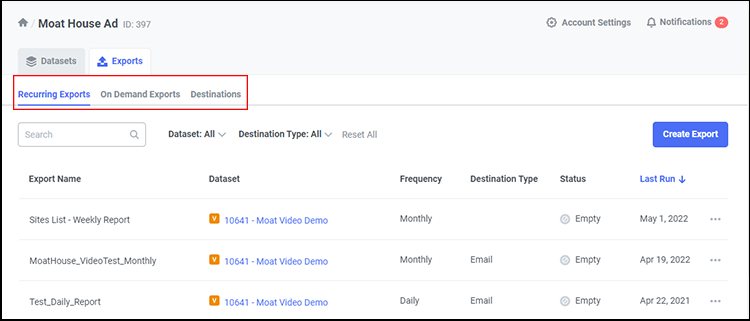
Exports Tab
This tab will show any Recurring or On-Demand (one-time) Exports you have created, as well as export Destinations. Here you can view detailed information and download additional exports. The Destinations tab lists all export destinations that have been set up to receive these exports, as well as the specific export names.
Creating Alerts and Exports in the Dashboard
Alerts
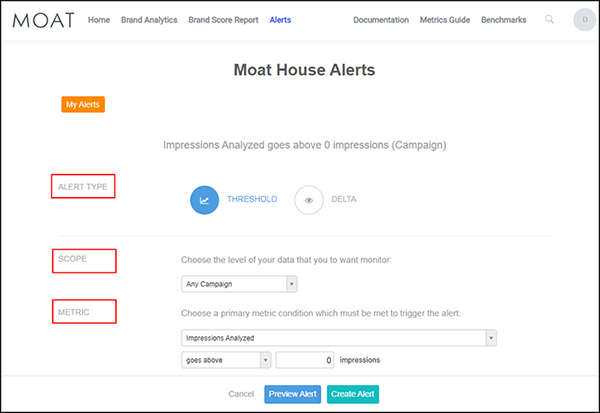
Moat Analytics offers you the ability to set up alerts in your dashboard. Alerts can be set to notify you of changes in your Moat data. Moat offers several recommended alerts, as well as the ability to create custom alerts.
Simply select the alert type, scope, and metrics you would like included in the alert.
Exports
Moat offers you two time-based options for exporting data: On-Demand and Recurring Exports.
You can export data in .csv format via reports or via FTP or SFTP. You can export directly to Amazon's S3 data-storage service. Typically, clients use FTP when they want to write a script to intake large files directly into their systems programmatically; want their organizations to be able to access these files (rather than just the select few in an email); and/or to host files on their own servers.
For FTP, you should have your own credentials to set up the destination of FTP exports. Otherwise, we can set up an FTP manually. Further details on setup are available, for clients with logons, in the Moat Onboarding Guide.
Exports: File-Naming Convention
For exports, the best practice for file naming is to add macros that will auto populate so the recipients can know the date range for the reporting.
For reference, these are the macros we can use:- {start_date:%Y%m%d}
- {end_date:%Y_%m_%d}
The suggestions in the bullet points are customizable. You insert the date as desired. Here is an example of the naming convention:
Moat_ClientName_Export{start_date:%m_%d_%Y} - {end_ date:%m_%d_%Y}Export FAQs
Question 1: Can the dashboard provide reporting broken out by weeks, months, or quarters?Yes, both the On-Demand Exports and Recurring Exports can be grouped by the following intervals: day, week, month, or quarter. This feature can be found by selecting the Date checkbox and toggling on the desired grouping option from the drop-down menu.
Question 2: When are recurring monthly and weekly exports delivered?Users can set a starting date for all recurring exports.
Question 3: Can recurring exports be edited?Recurring exports can be edited by going into the export tab in the UI, scrolling down to Saved Exports, and clicking the Edit button beside it. The edit function allows the user to add/delete Dimensions and metrics or change the frequency and name of the export. Make sure to click the Save button.
Invalid Traffic Overview
What Is Invalid Traffic?
Per the MRC, Invalid Traffic, or IVT, is generally defined as traffic that does not meet certain ad-serving quality standards or completeness criteria, or otherwise does not represent legitimate ad traffic that should be included in measurement counts. This includes all impressions that are classified under General Invalid Traffic (GIVT) and Sophisticated Invalid Traffic (SIVT).
It is important to note the difference between the two types: General Invalid Traffic tends to be list-based and easier to detect, whereas Sophisticated Invalid Traffic can point to fraudsters intentionally manipulating end points to avoid detection. General Invalid Traffic can be identified through means of filtration or standardized parameter checks. Sophisticated Invalid Traffic is more difficult to detect and requires advanced deterministic analytics and human intervention to identify and analyze the end point. Moat is continually improving our proprietary methods to detect both General and Sophisticated Invalid Traffic.
What are the MRC Guidelines?
The MRC requires that all measurement organizations employ elements from both detection and filtration techniques, while minimizing the potential for their being used to signal the detection methodologies to perpetrators of IVT.
Front-end detection techniques should be employed with caution because they're particularly prone to telegraphing detection techniques, in most cases, to the traffic source because of an element of blocking that becomes apparent. As such, they tend to become less effective over time without additional research and development into new detection methodologies.
Types of General Invalid Traffic
Moat reports on a number of GIVT metrics:
| Type | Definition | Example |
| Spider Rate | The percentage of total unfiltered impressions that were determined to originate from known spiders according to the IAB/ABC International Spiders and Bots List. | Spiders represent nonhuman activity on the web. Although some are considered to be "good," "bad" spiders can masquerade as legitimate users. |
| Data Center Traffic Rate | The percentage of total unfiltered impressions that were determined to originate from a data center. | The end user IP address is identified as a known data center or cloud-computing provider. |
| Excessive Activity Rate | The percentage of impressions that were determined to be delivered to users with invalid levels of activity. | User activity detected by Moat's tag is more frequent than possible by a human. |
Types of Sophisticated Invalid Traffic
Moat reports on a number of SIVT metrics:
| Type | Definition | Example |
| Invalid Proxy Rate | The percentage of total unfiltered impressions that were determined to use a proxy, excluding corporate proxies. | Invalid proxies may be used to route traffic originating from data centers, bots, or other sources in order to make its origins appear to be an ordinary home or business. |
| Automated Browser Rate | The percentage of total unfiltered impressions that were determined to originate from an automated browser. | Moat's JavaScript was able to analyze the end user's browser and determine that it could not have been driven by a human end point. |
Incong- ruous Browser Rate |
The percentage of total unfiltered impressions that were determined to originate from a browser with an incongruous feature set. | Features within the browser that indicate that it was not an authentic version of Internet Explorer, Chrome, Firefox, Safari, Opera, or whatever known browser the end point claims to be via its user agent. |
| Hidden Ad Rate | The percentage of total unfiltered impressions where the ad was hidden from the user's view for the entire duration of an impression. | Ads hidden in a 1x1 frame, invisible ads, stuffed ads, or ads stacked on top of one another. |
| Invalid Source Rate | The percentage of total unfiltered impressions that were served on a domain identified by Moat as invalid, meaning the content or quality of the site has been flagged. | The domain contains contents that appear not to match the reported date of publication. |
| Session Hijacked Rate | The percentage of impressions triggered when a user's session has been forcibly redirected to another site, tab, or app store. | A malware infection causes the browser to spawn a new browser window without user input. |
Viewability Diagnostics Metrics
Turning on Viewability Diagnostic Metrics (VDM) from the Moat Analytics Dashboard allows you to gain insights into ad viewability. The viewability diagnostic chart allows you to granularly understand performance across a given:
- Site
- Placement
- Size
- Advertiser
- Browser
To see the chart in the dashboard, click on any metric in the row you want to drill into and select the Viewability Diagnostics tab. This information is easily exportable from the dashboard in either the image or PowerPoint form.

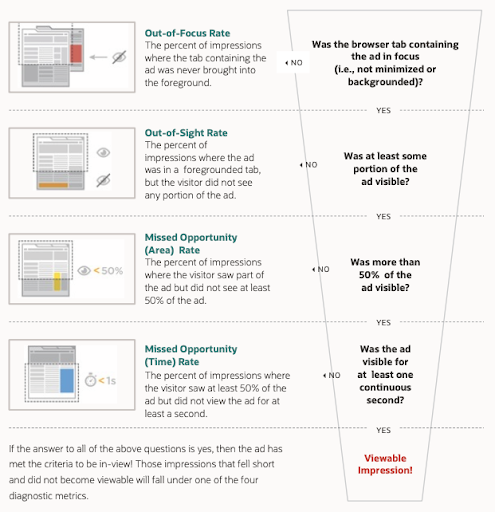
Once Viewability Diagnostic Metrics are enabled, you will see indications of what is impacting viewability.
The Viewability Diagnostics identify four core reasons for missing a viewable impression, which are illustrated in the impression funnel below:
Measuring Attention
Display Attention
Through Moat's suite of attention metrics, we offer multiple ways for marketers to determine the behavioral impact for display campaigns. Because no two campaigns are alike, understanding where you gained traction toward your intended outcome can be summarized using three steps.
Step 1: Understand your level of campaign exposure- Impressions Analyzed
- Exposure Time
- In-View Time
- Passthrough Rate
- Attention Quality
- Interaction Rate
- Interaction Time
- Touch Rate (mobile)
- In-View Time Buckets at > 5 Sec/10 Sec/15 Sec/1 Min Rate
Video Attention
Through Moat's suite of attention metrics, we offer multiple ways for marketers to determine the behavioral impact for video campaigns. Similar to display, understanding where you gained traction toward your intended outcome can be summarized using three-steps.
Step 1: Understand your level of campaign exposure- Impressions Analyzed
- Exposure Time
- Percentage of Video Played In-View
- Audible Rate
- Completion Rate
- Completion Quality
- Audible and Visible on Complete (AVOC) Rate
- Moat Video Score
- In-View Time Trend (Total Campaign)
- Audible and Visible on 1st/2nd/3rd Quartile/on Complete
Awareness Versus Direct-Response Campaigns
Both time spent and interaction metrics can provide the key to determine which signals drive your campaign's effectiveness, so you should apply the same steps across display and video metrics to assess campaign performance.
Awareness: Time spent acts as a measure of brand awareness because more time with a brand message in-view helps imprint a message on consumers. Given that video ads are an ideal medium to deliver storytelling through sight, sound and motion, awareness KPIs are commonly associated with video campaigns.
Display Metrics:- In-View Time
- Percent of Video Played In-View
- Audible Rate
- Completion Quality
- Audible and Visible on Complete (AVOC) Rate
- Moat Video Score (MVS)
Direct Response: Similarly, interaction signals whether a brand message inspires users to take action, which means your ads successfully deliver valuable engagement (i.e., a behavioral signal prior to a potential conversion on your landing page). Given that display ads are an ideal medium for a call to action that drives a behavioral outcome, direct-response KPIs are commonly associated with display campaigns.
Display Metrics:- Interaction Rate
- Interaction Time
- Touch Rate (mobile)
- Click Rate
Moat Live
Moat Live is a real-time dashboard that highlights how well ads are performing across both display and video. Moat Live is password-protected and offers both a real-time and summary viewing option.
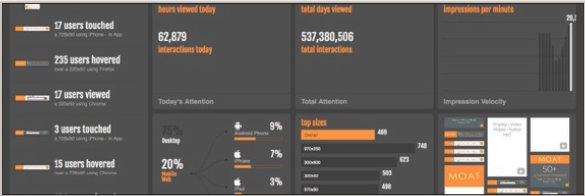
Real-Time View provides a visual overview of real-time activity as users view and interact with ad creatives. This view offers a breakdown by device segments, impression velocity, engagements, completions, top sizes or sections, and a complete creative gallery (across display).
Summary View provides a visual overview of campaign or advertiser performance to date. This view looks at total exposure time, total engagements, total completions, a summary of audience device segments, top overall sizes or sections, and a complete creative gallery (across display).
Export to PowerPoint
Users can see screenshots of the display creatives and heatmaps based on user engagement within creatives. These will show attention metrics.
Attention Metrics
- Hovers — When a user breaks the frame of the creative with his or her cursor in a desktop environment.
- Interactions — When a user hovers over the creative and remains active within the frame of the ad for at least half a second in the desktop environment.
- Clicks — When a user performs any sort of mouse-down activity on the creative on a desktop. This does not have to be a click-through to be recorded.
- Touches — When a user touches within the frame of the creative on a mobile device.
The technology Moat uses to capture screenshots and heatmaps is separate from what Moat uses to track and measure data.
Predictive Heatmaps
Predictive heatmaps appear when not enough activity is recorded for the creative in question. Moat generates these heatmaps using our image-sourcing technology, based on Moat algorithms and creative aesthetics, to determine where we would likely see user attention.
Industry-Wide Limitations on Collecting Screenshots and Heatmaps:
- Hostile iFrame rate — Can prevent capture of the creatives that ran and evaluation of how users interacted with these creatives.
- Minimum-activity thresholds — Can hinder the ability to generate heatmaps based on user activity without a statistically significant amount of user data.
- HTML5 creatives — Can obstruct the ability to collect screenshots and user data if creatives of this type are not served through DFP.
Moat Brand Score Report and Moat Video Score Report
Moat Brand Score Report
The Moat Brand Score is a measure of attention paid to display ads. The score range is 300–850. It incorporates many factors, including in-view percentage, in-view time, interaction percentage, and interaction time.

Moat Video Score (MVS) Report
The MVS helps assess the effectiveness of digital video campaigns. The MVS score range is 0–100 and is based upon research from Nielsen. It provides marketers and publishers with a way to correlate and compare video effectiveness across websites, screens, apps, and platforms.
The components of the score are:- Screen Real Estate — The size of the ad relative to the size of the screen, as a percentage.
- 50% On-Screen Time — The average length of time that at least 50 percent of the ad has been on the screen.
- Audible Time — The average length of time that the audio could be heard.
- Average Ad Length — The average length of the creative, weighted by impression volume.
Brand Safety Metrics
"Brand safety" refers to the practice of ensuring that an advertiser's messages do not appear in a context that could cause reputational harm to the advertiser's brand. In addition to measuring viewability, invalid traffic, and attention metrics, we also evaluate whether the page is brand-safe. If the page is found to be brand-safe, the impression is categorized as:
Total Safe — The Total Safe Rate is the percentage of impressions that occur in a brand-safe environment.
Total Unsafe. — The Total Unsafe Rate is the percentage of impressions that occur in a brand-unsafe environment.
For unsafe impressions, Moat also shows increments for 11 categories used by TAG and other industry bodies, which measure the percentage of impressions that occurred in an environment found to contain each of these types of content. See the list of categories in Step 2 below.
Standard brand-safety reporting is crucial to establishing transparency, which begins with a three-step approach.
Step 1: Understand your overall brand-safety performance. Was it:- Brand-safety measurable
- Safe
- Unsafe
- Adult Content
- Arms
- Crime
- Death and Injury
- Illegal Downloads
- Drugs
- Hate Speech
- Military
- Obscenity
- Terrorism
- Tobacco
- Site
- Domain
- DMA
- Browser
- Campaign
- Placement
Across all steps, use trend charts to quickly uncover whether certain date ranges show potential declines or spikes within specific brand-safety categories, which is imperative for securing baseline control of campaigns and inventory.