Example: Using the Range function to create rolling reports
The Range member selector function returns a range of members based on specified start and end members. It is commonly used with the CurrentPOV or Prompts in a Time (for example, Period) dimension to produce a "rolling" report that displays months before and after the "current month" (For example, three months before through three months after the current month).
-
The Range function can be used with the RelativeMember function to span across a single year, optionally across a Scenario dimension (for example, Jan to CurrentPOV (Period) for Actual, CurrentPOV +1 (Period) to Dec for Plan), when years and periods are in separate dimensions. You can also use the Range and RelativeMember functions with Fusion ERP or custom Essbase cube data source where periods and years are in the same dimension to span across the single time dimension.
-
You can use the Range function with the PeriodOffset function, which can produce a rolling report across the specified year and period dimensions.
For example, if the member selection functions are defined as:
Range from: PeriodOffset of CurrentPOV - 2 for periods
To: PeriodOffset of CurrentPOV + 14 for periods
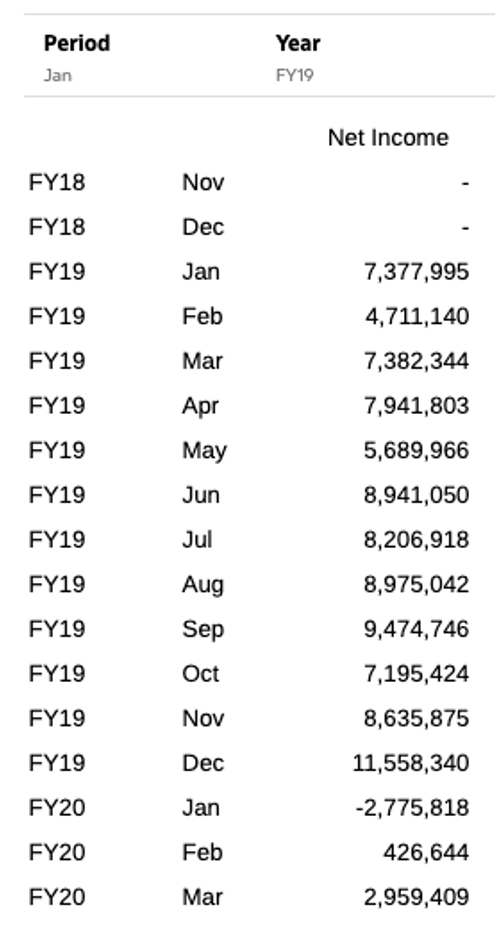
Where the CurrentPOV for Year and Periods are Jan and FY19, the results of the report are where the starting period is Nov, FY18 (Current POV – 2) and the ending period is Mar, FY20 (Current POV + 14).
Example 1: Range and RelativeMember functions
Sample Report 4 in Narrative Reporting has an example of using the Range and RelativeMember functions for a rolling report with January through December across scenarios.
It contains a grid with income statement accounts in the rows, Scenarios and Fiscal Calendar dimensions in the columns.
-
The grid columns are defined as follows:
-
January to the currently selected month in the POV (June by default) for Actual data in FY17.
-
The Current POV + 1 (July by default) to December for Plan data in FY18.
-
-
The POV can be changed to select a different month. The columns use a combination of the Current POV, Range and Relative Member selection functions.
-
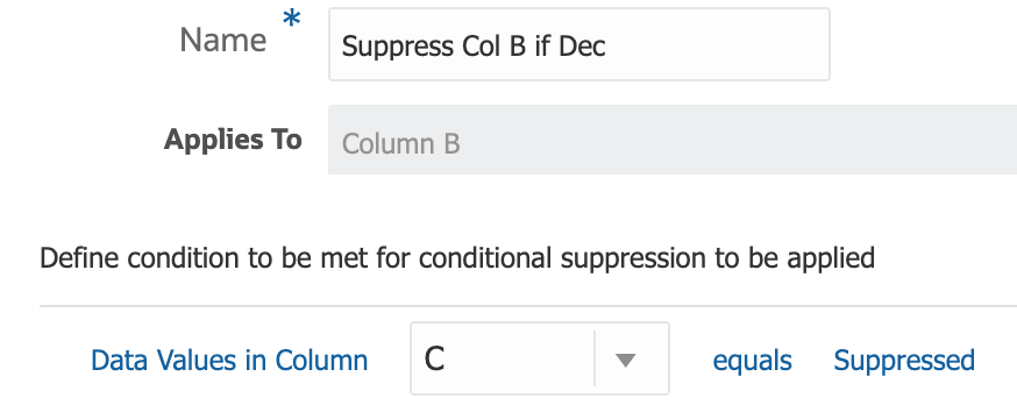
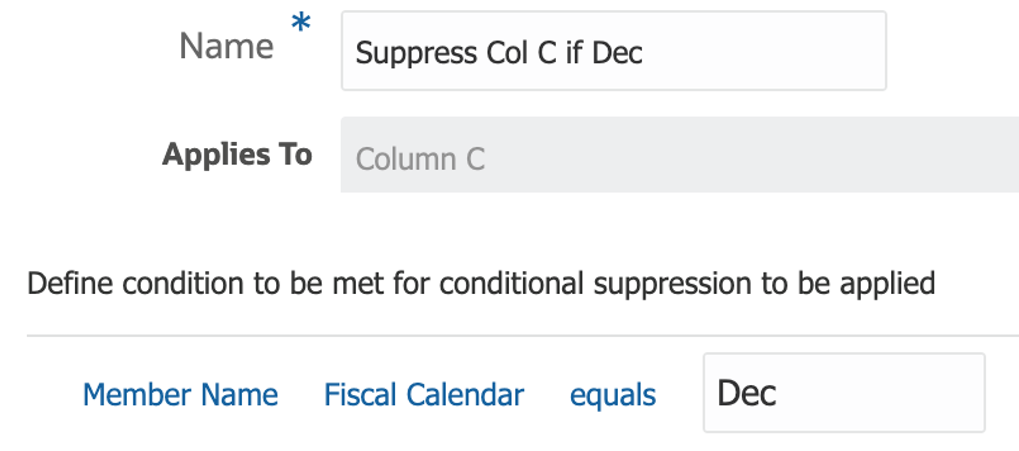
To account for displaying only Actual data when December is selected for the POV, there is a third hidden data column (C) which is used for conditional suppression definitions on columns B and C, so that Plan data is suppressed when the POV selection is December.
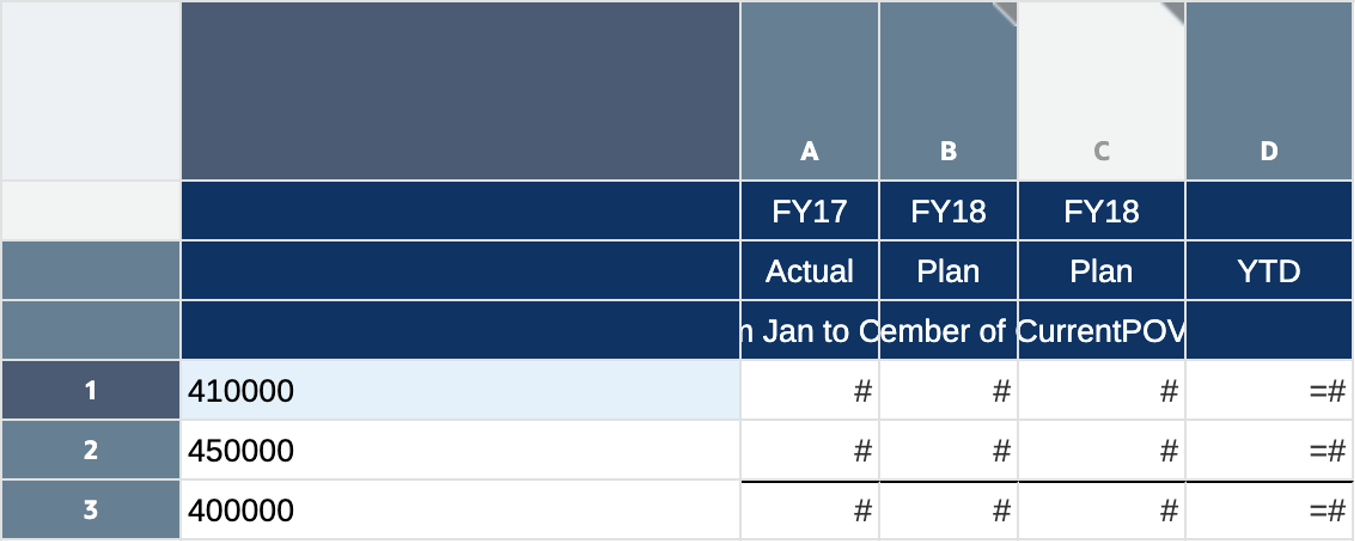
Here is the high-level report design:
-
Column A: Range from Jan to CurrentPOV
-
Column B: Range from Relative Member of CurrentPOV + 1 to Dec
-
Column C (hidden column): CurrentPOV
-
Column D (formula column): SUM([A],[B])
Here is the conditional suppression definition for columns B :
Here is the conditional suppression definition for columns C:
Here is the report preview with "June" selected for the Fiscal Calendar dimension:

Example 2: Range and PeriodOffset functions
The report used in this example utilizes the Planning Vision Plan1 cube as a data source. The example uses the Range and PeriodOffset functions for a rolling report across years and periods. The grid has the account "Net Income" in the column and the Period and Year dimensions in the rows to display the time-related members more easily.
Note:
The correct Year dimension will not be returned when either of the following conditions are present, when using the PeriodOffset function in a single row or column segment
-
Multiple members are selected in another dimension in the same segment.
-
A CurrentPOV function or any other member or member function for the Period dimension is in the same segment as the PeriodOffset function.
The POV can be changed to select a different month and year.
Here is the high-level report design:

In row 1:
-
The Year dimension member selection is "CurrentPOV".
-
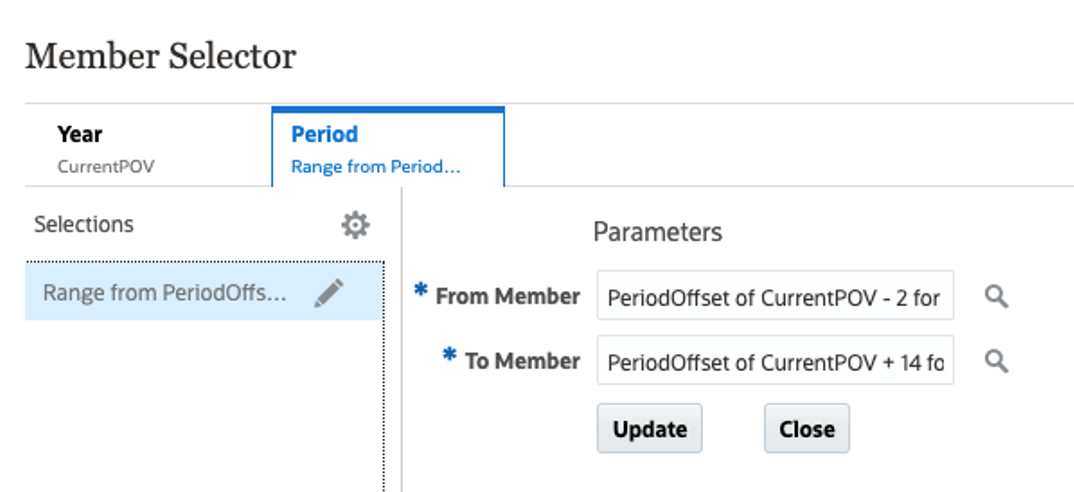
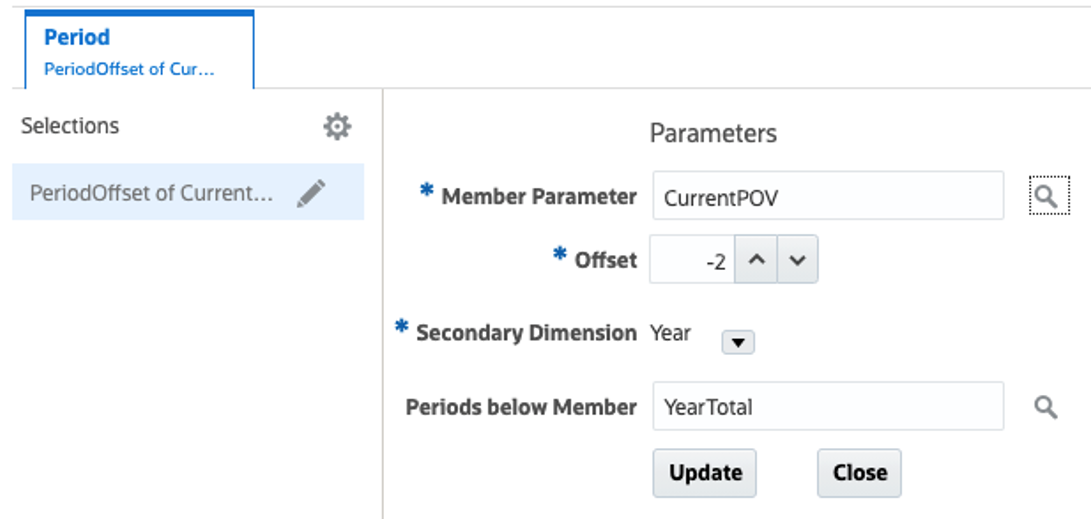
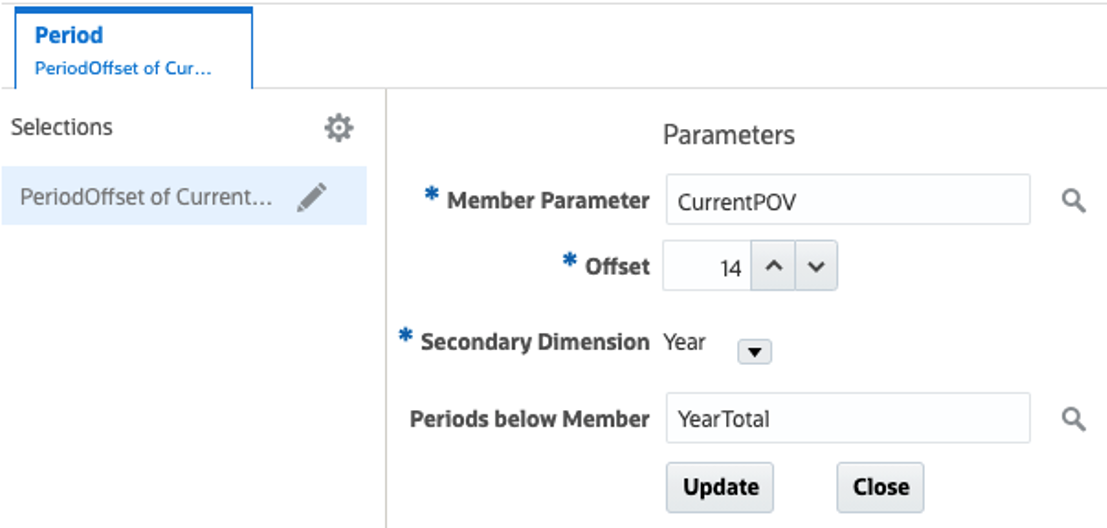
The Period dimension member selection is: Range from PeriodOffset of CurrentPOV - 2 for periods under YearTotal to PeriodOffset of CurrentPOV + 14 for periods under YearTotal.
Here are the member selector definitions:
Range function:
From member selection:
To member selection:
Here is the report preview with Jan selected for the Period dimension POV and FY19 selected for the Year dimension POV:
