Bar Chart Example
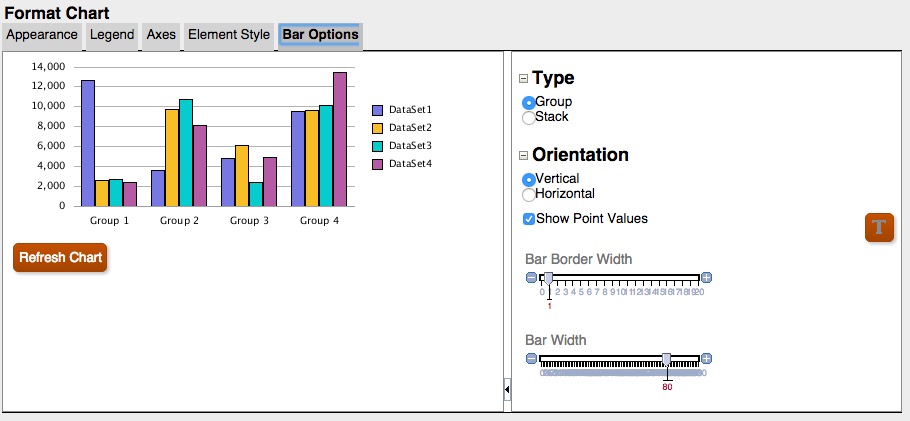
In this example, "Show Point Values" is enabled in the Bar Options tab.
Figure -11 Bar Options Tab in the Updated Charting Engine

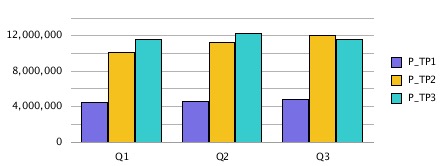
However, the point values do not appear in the bar since they are too wide to fit within the bar.
Figure -12 Point Values Do Not Display in the Bars

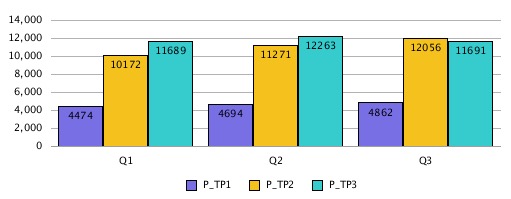
Widening the chart size on the report canvas, changing the grid width to 100, and setting the legend placement to the bottom of the chart fits the long data point values within the chart.
Figure -13 Point Values Display in the Bars

Alternately, adjusting the number scaling in the grid to thousands, placing the legend on the bottom, and changing the grid width to 90 reduces the length of the numbers and fits the data point values more tightly in the chart.
Figure -14 Point Values Display in the Bars
