Diagnosing Financial Reporting Reports Performance Issues
Poorly designed Financial Reporting reports can generate several Multi-Dimensional Expression (MDX) requests or Oracle Essbase queries leading to the consumption of significant Oracle Fusion Cloud Enterprise Performance Management resources. Excessive resource consumption results in performance degradation when concurrent users access such reports.
The presence of several segments in the report is the key reason for generating a large number of MDX requests. This section explains how to make Financial Reporting reports more efficient by reducing the number of segments.
Redesigning Reports: a Use Case
The Original Report
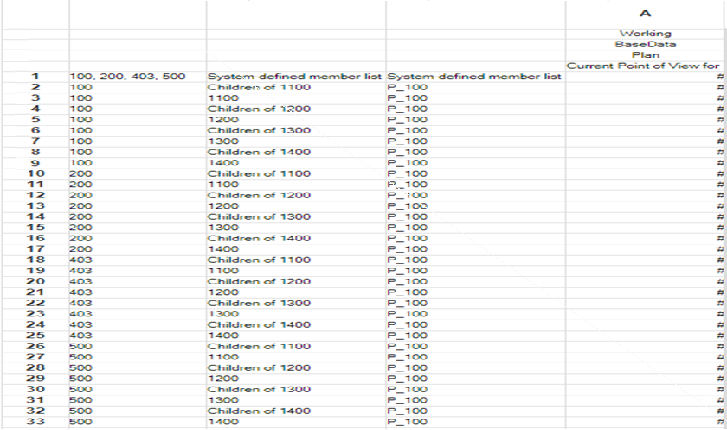
The following illustration depicts the original report design:
This report illustration shows these design elements:
- Multiple rows for each Entity member 100, 200, 403, and 500.
- Each Entity member has 8 rows each for different accounts.
The following table presents a high-level view of the original report design and the optimized design:
| Original Report Design | Optimized Design |
|---|---|
Multiple rows for each Entity member:
|
Combines
|
|
Each
|
Combines all segments for all members into one segment:
|
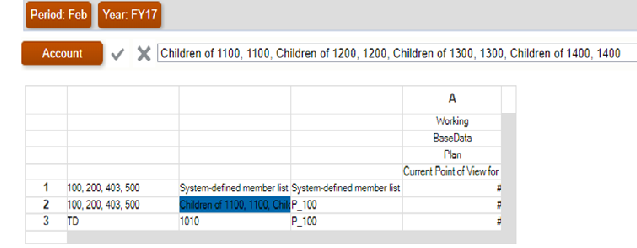
The Optimized Report
The following illustration depicts the optimized report design, which reduces the number of segments. Reducing the number of segments makes the report run faster by reducing the number of MDX requests: 
Other Important Report Design Considerations
- Design reports against ASO cubes, if possible. Design reports against BSO cubes only if ASO cubes are not available.
- Always select Missing Blocks under Suppression to ensure that missing blocks are not included in the report.
- Minimize the number of rows and columns. Best practice: use dense dimensions for columns and sparse dimensions for rows.
- Design reports to query at the required children level of members rather than at the parent level.
- If level 0 members are tagged as Dynamic Calc but do not have a formula, either remove the Dynamic Calc tagging or create formulas for them. You cannot load data into level 0 members tagged as Dynamic Calc. They cannot show values because they are tagged as Dynamic Calc but have no formula to calculate values. Such members adversely affect retrieval performance.
- If possible, avoid relational-type reports (reports with multiple row dimensions expanded using functions) with a large combination of members. Big reports may take a significant amount of time to execute (or may not execute). A report is considered big when the number of cells exceeds ten thousand. This is similar to treating Financial Reporting as a large scale data extraction tool, which it is not.
- Avoid reports with large number of cells with text functions (for example,
CellText,PlanningAnnotations, andListOfCellDocuments) that retrieve additional metadata from the data source. - Use current POV, prompts, or books instead of the Page dimension; all Page members are retrieved at one time upon executing the report.
- Consider and test the impact of Conditional Formatting and Conditional Suppression, which can affect performance depending on the size of the report. Performance is contingent on the type of criteria and frequency with which they are used within the report. Criteria that are part of metadata or data query, for example, data value, member name, and member alias or description, are rendered fast. With large reports, minimize the use of criteria that are not part of the regular metadata or data query. Examples of such criteria include generation, level, account type, and attribute value.
- Consider the dimension layout. For example, analyze what can be moved from the POV or page into the body of the report.
- Always design a symmetric (versus asymmetric) report. Essbase queries may be symmetric or asymmetric. Symmetric queries are those where members queried on rows or columns are of cross-dimensional layout. Asymmetric queries are those where the cross-dimensional layout of the members being queried changes in either the rows or the columns.
On encountering an asymmetric query, the Essbase hybrid query engine, which processes only symmetric grids, automatically breaks it into multiple symmetric grids. These symmetric grids are processed one at a time and then returned in the original asymmetric form, which makes the process less efficient.
Troubleshoot Financial Consolidation and Close Retrieval Performance
See Troubleshooting Financial Consolidation and Close Retrieval Performance for information on troubleshooting the report performance in Financial Consolidation and Close environments.
Review Recent Application Changes
Identify if recent changes to the application causes report generation to slow down. You can do this by comparing the information in the Application Size table in the current Activity Report with the information in the Activity Report from a previous date when the report was working well. Also review any recent changes to the report design and usage to verify that such changes have not impacted the report.