Mapping Overview
Working with Data in Financial Statements
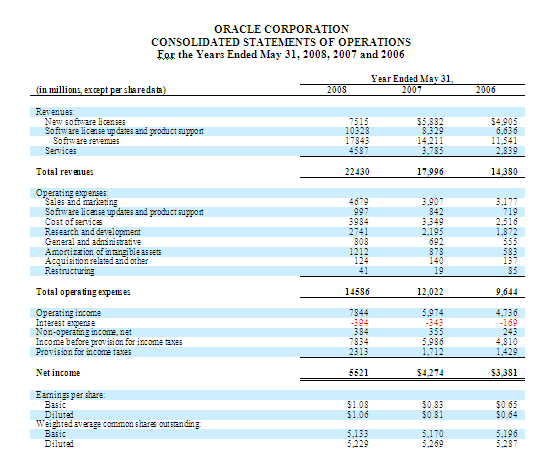
Financial statement files are opened in either Microsoft Word or Excel, from a number of locations such as the local file system or a shared drive. These statements contain both text and data.

Mapping Financial Reports to Taxonomies
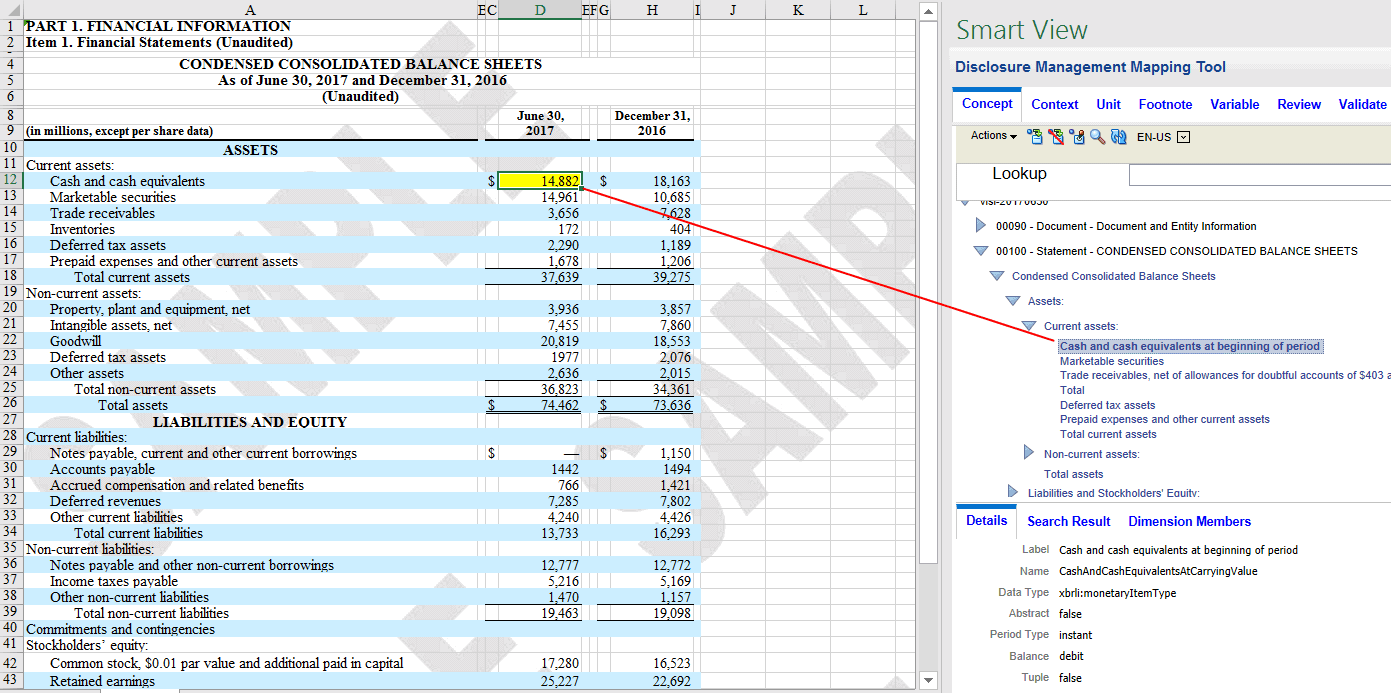
When you create XBRL-encoded financial reports, you correlate each piece of information from the financial reports to a concept in the taxonomy. This process is called "mapping".
The Disclosure Management Mapping Tool provides both a mapping button and drag and drop functionality as mechanisms for mapping XBRL concepts to document data.

Note:
If you need to tailor a taxonomy to define concepts which are not defined in a taxonomy, extend the standard taxonomy using Taxonomy Designer. See Working with Taxonomy Designer. This enables you to add new concepts, indicate calculations, rearrange values, or rename labels.
When the process is complete, you review and validate the mapped document, create the instance document, and submit it to the appropriate regulatory agency.