Introduction
This 30-minute tutorial shows you how to use built-in generative AI to analyze calculation job performance in Enterprise Profitability and Cost Management. The sections build on each other and should be completed sequentially.
Background
When model calculations don't perform as expected, there are a lot of options to investigate and troubleshoot before submitting a support request. However, it's sometimes hard to know where to start. Performance issues can come from poor dimension design, problems with one or more rule designs, system calculation settings that don't support your calculations properly, and so on. Enterprise Profitability and Cost Management's generative AI calculation analysis assistant gives you a way to quickly analyze and troubleshoot calculation performance issues yourself, before coming to Oracle or one of our partners for support.
Prerequisites
Before starting this tutorial, you must:
- Have Service Administrator access to a Cloud EPM Enterprise Service instance with the Enterprise Profitability and Cost Management business process .
- Optionally have the Enterprise Profitability and Cost Management sample application (BksML50) created in your instance.
Note:
All examples in this tutorial use the sample application for Enterprise Profitability and Cost Management. You can also choose to follow the prompts using your own application.Enabling Generative AI
In this section, you review your application settings to ensure that generative AI is enabled.
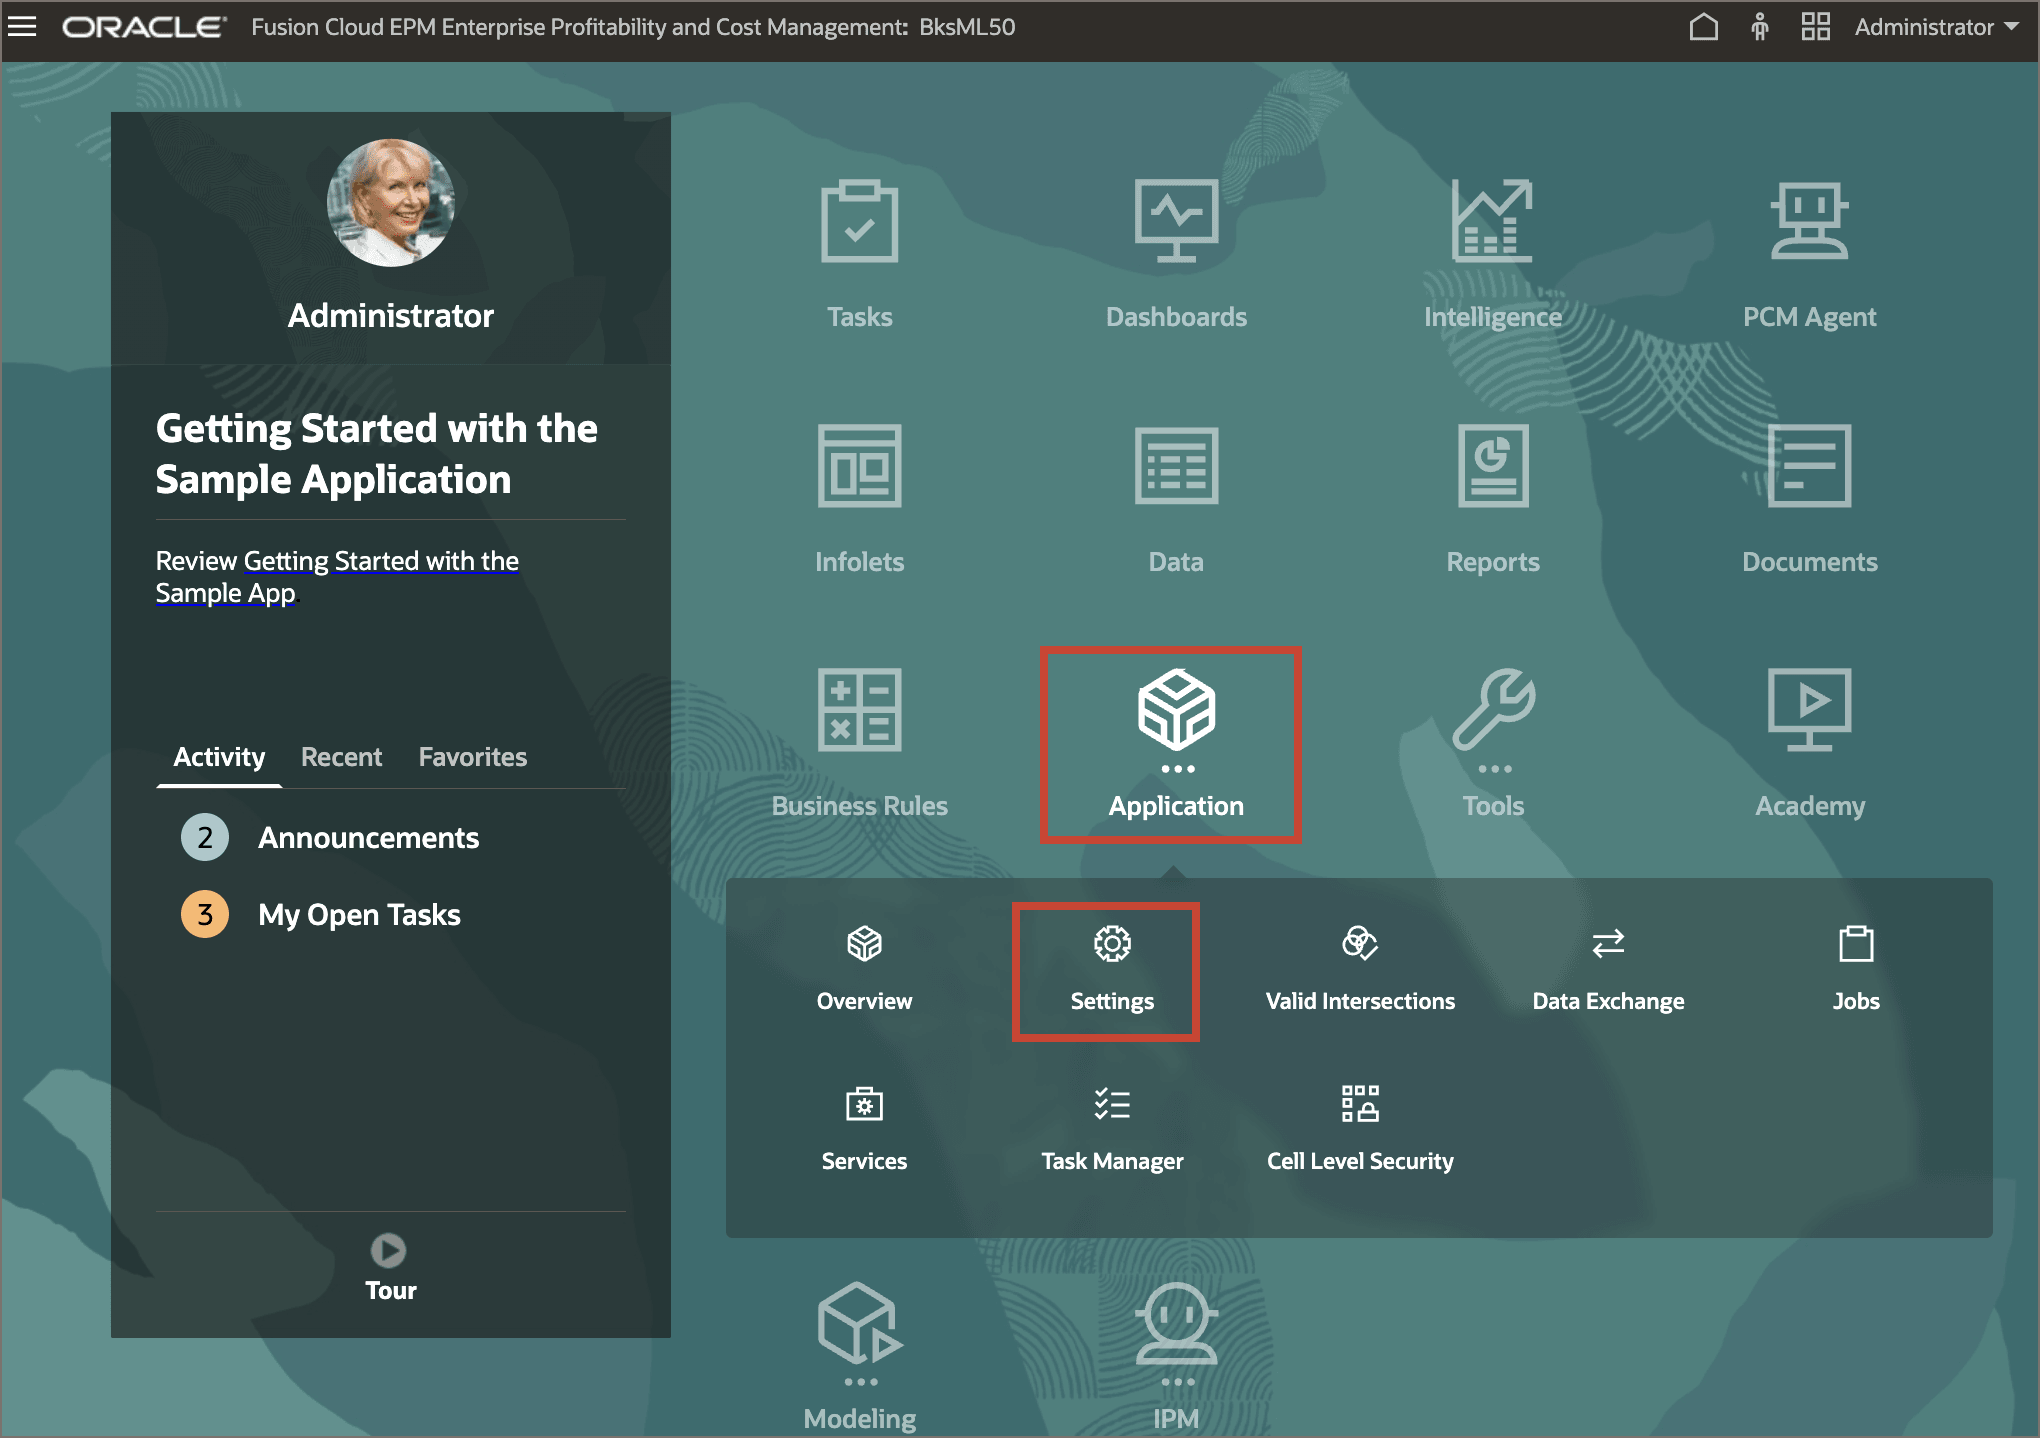
- From the Enterprise Profitability and Cost Management home page, click Application, then click Settings.
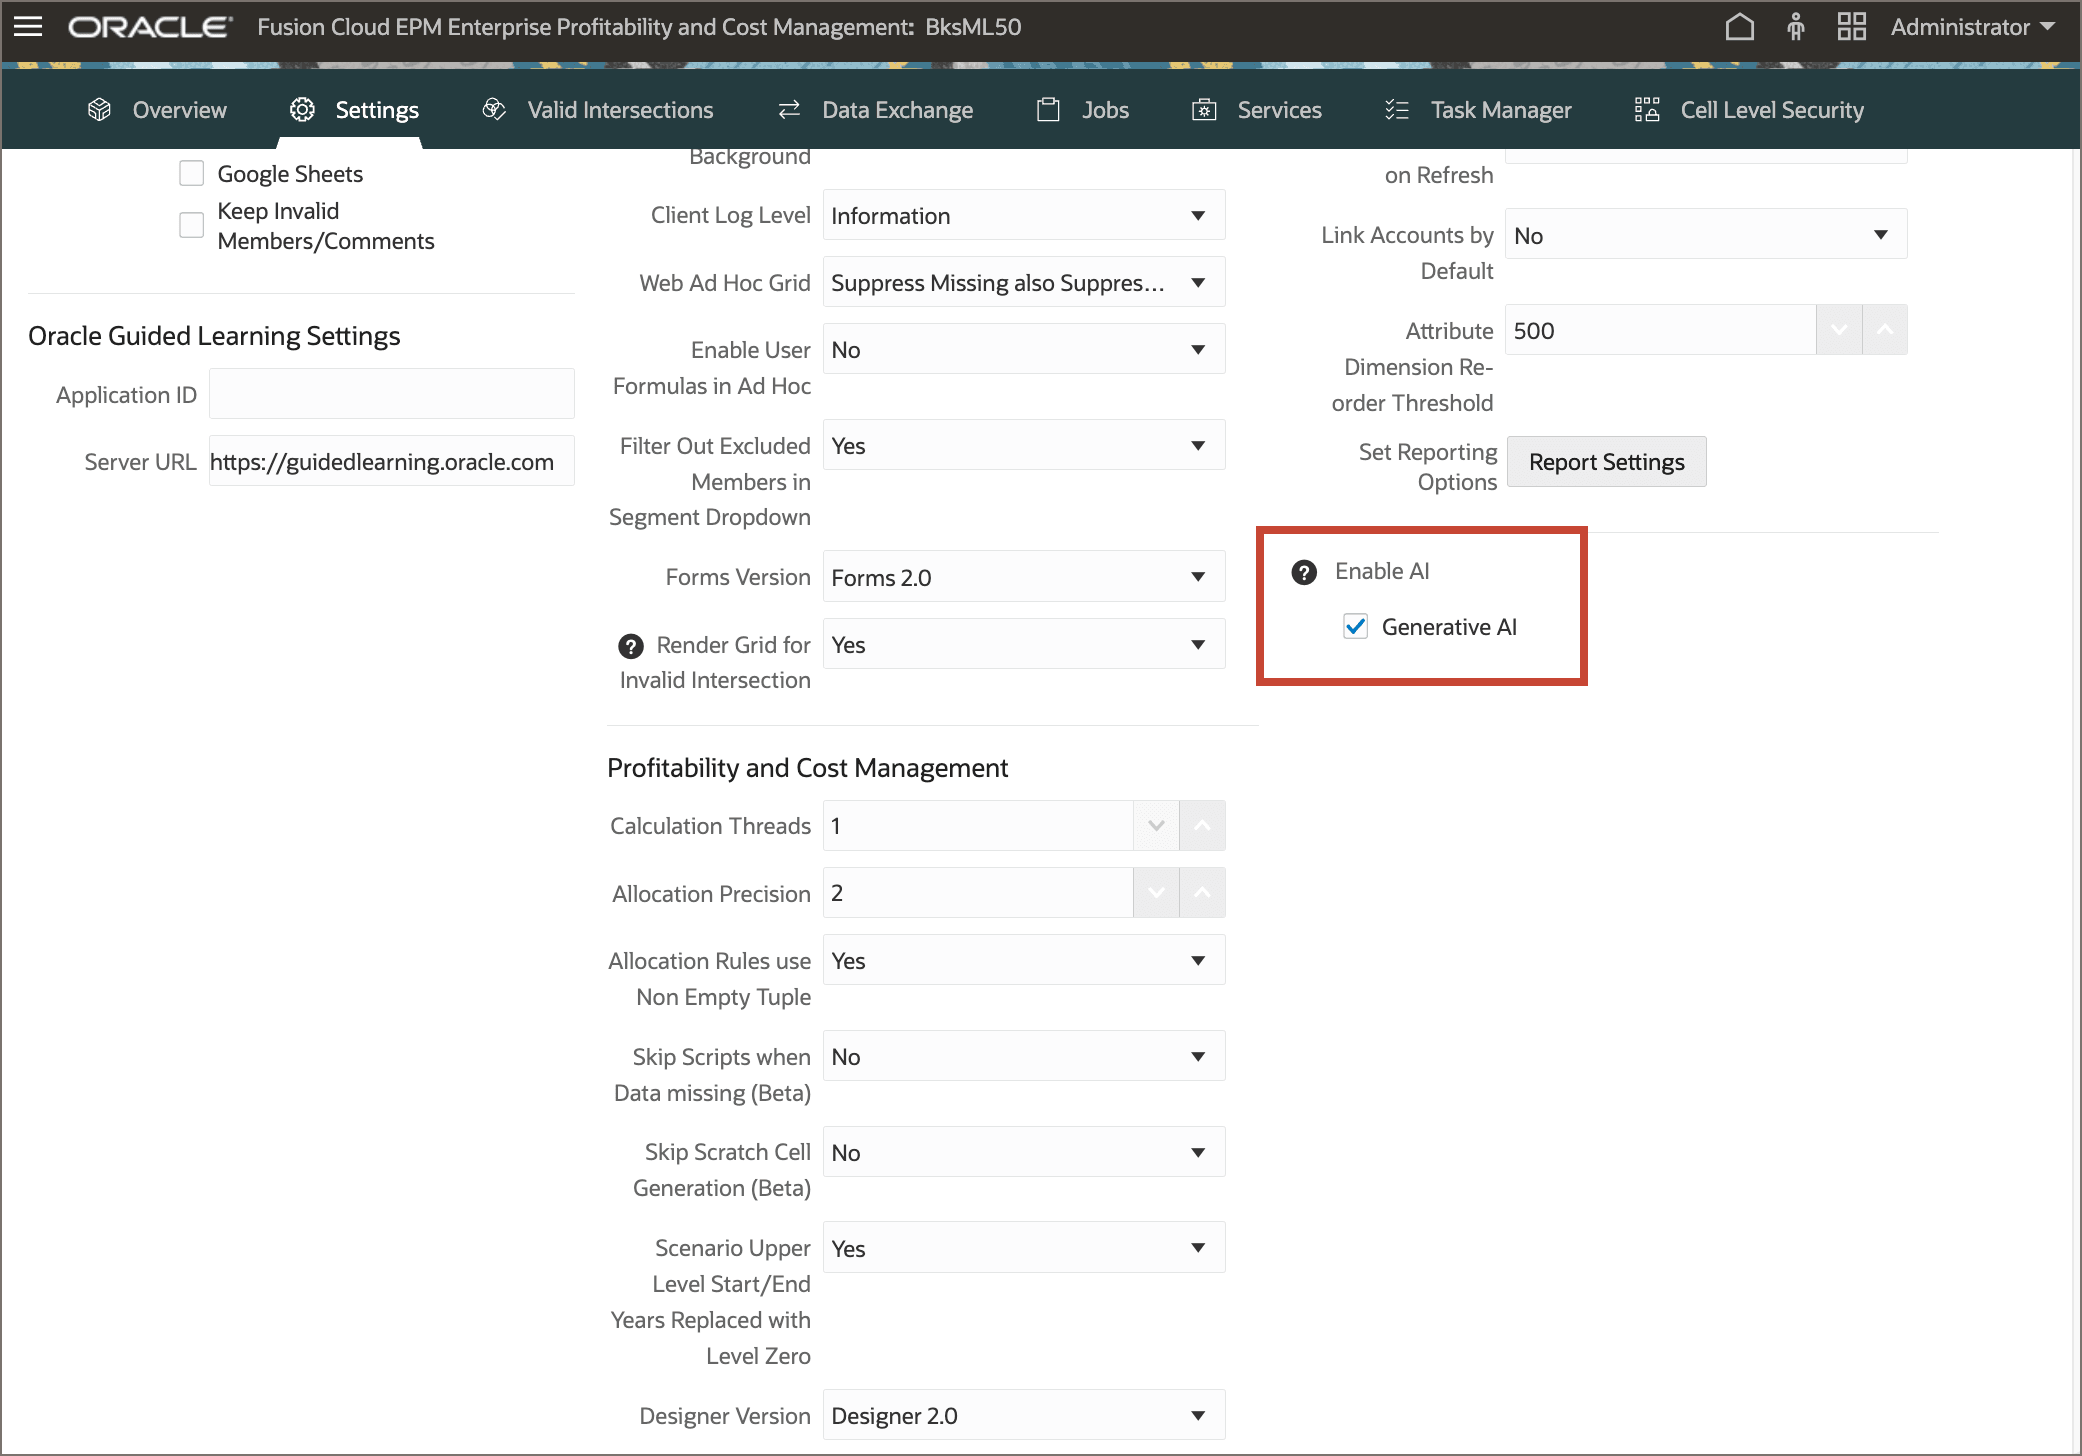
- Scroll down the list of settings to view the Enable AI section.
- Verify that Generative AI is selected.
- Scroll to the top of the Application Settings page, then click Save. At the information message, click OK.
- Return to the home page.
Exploring the Calculation Analysis Page
You access generative AI functions for analyzing calculation job performance from the Calculation Analysis page. In this section, you review the page and initiate a performance analysis on a calculation job in the sample application.
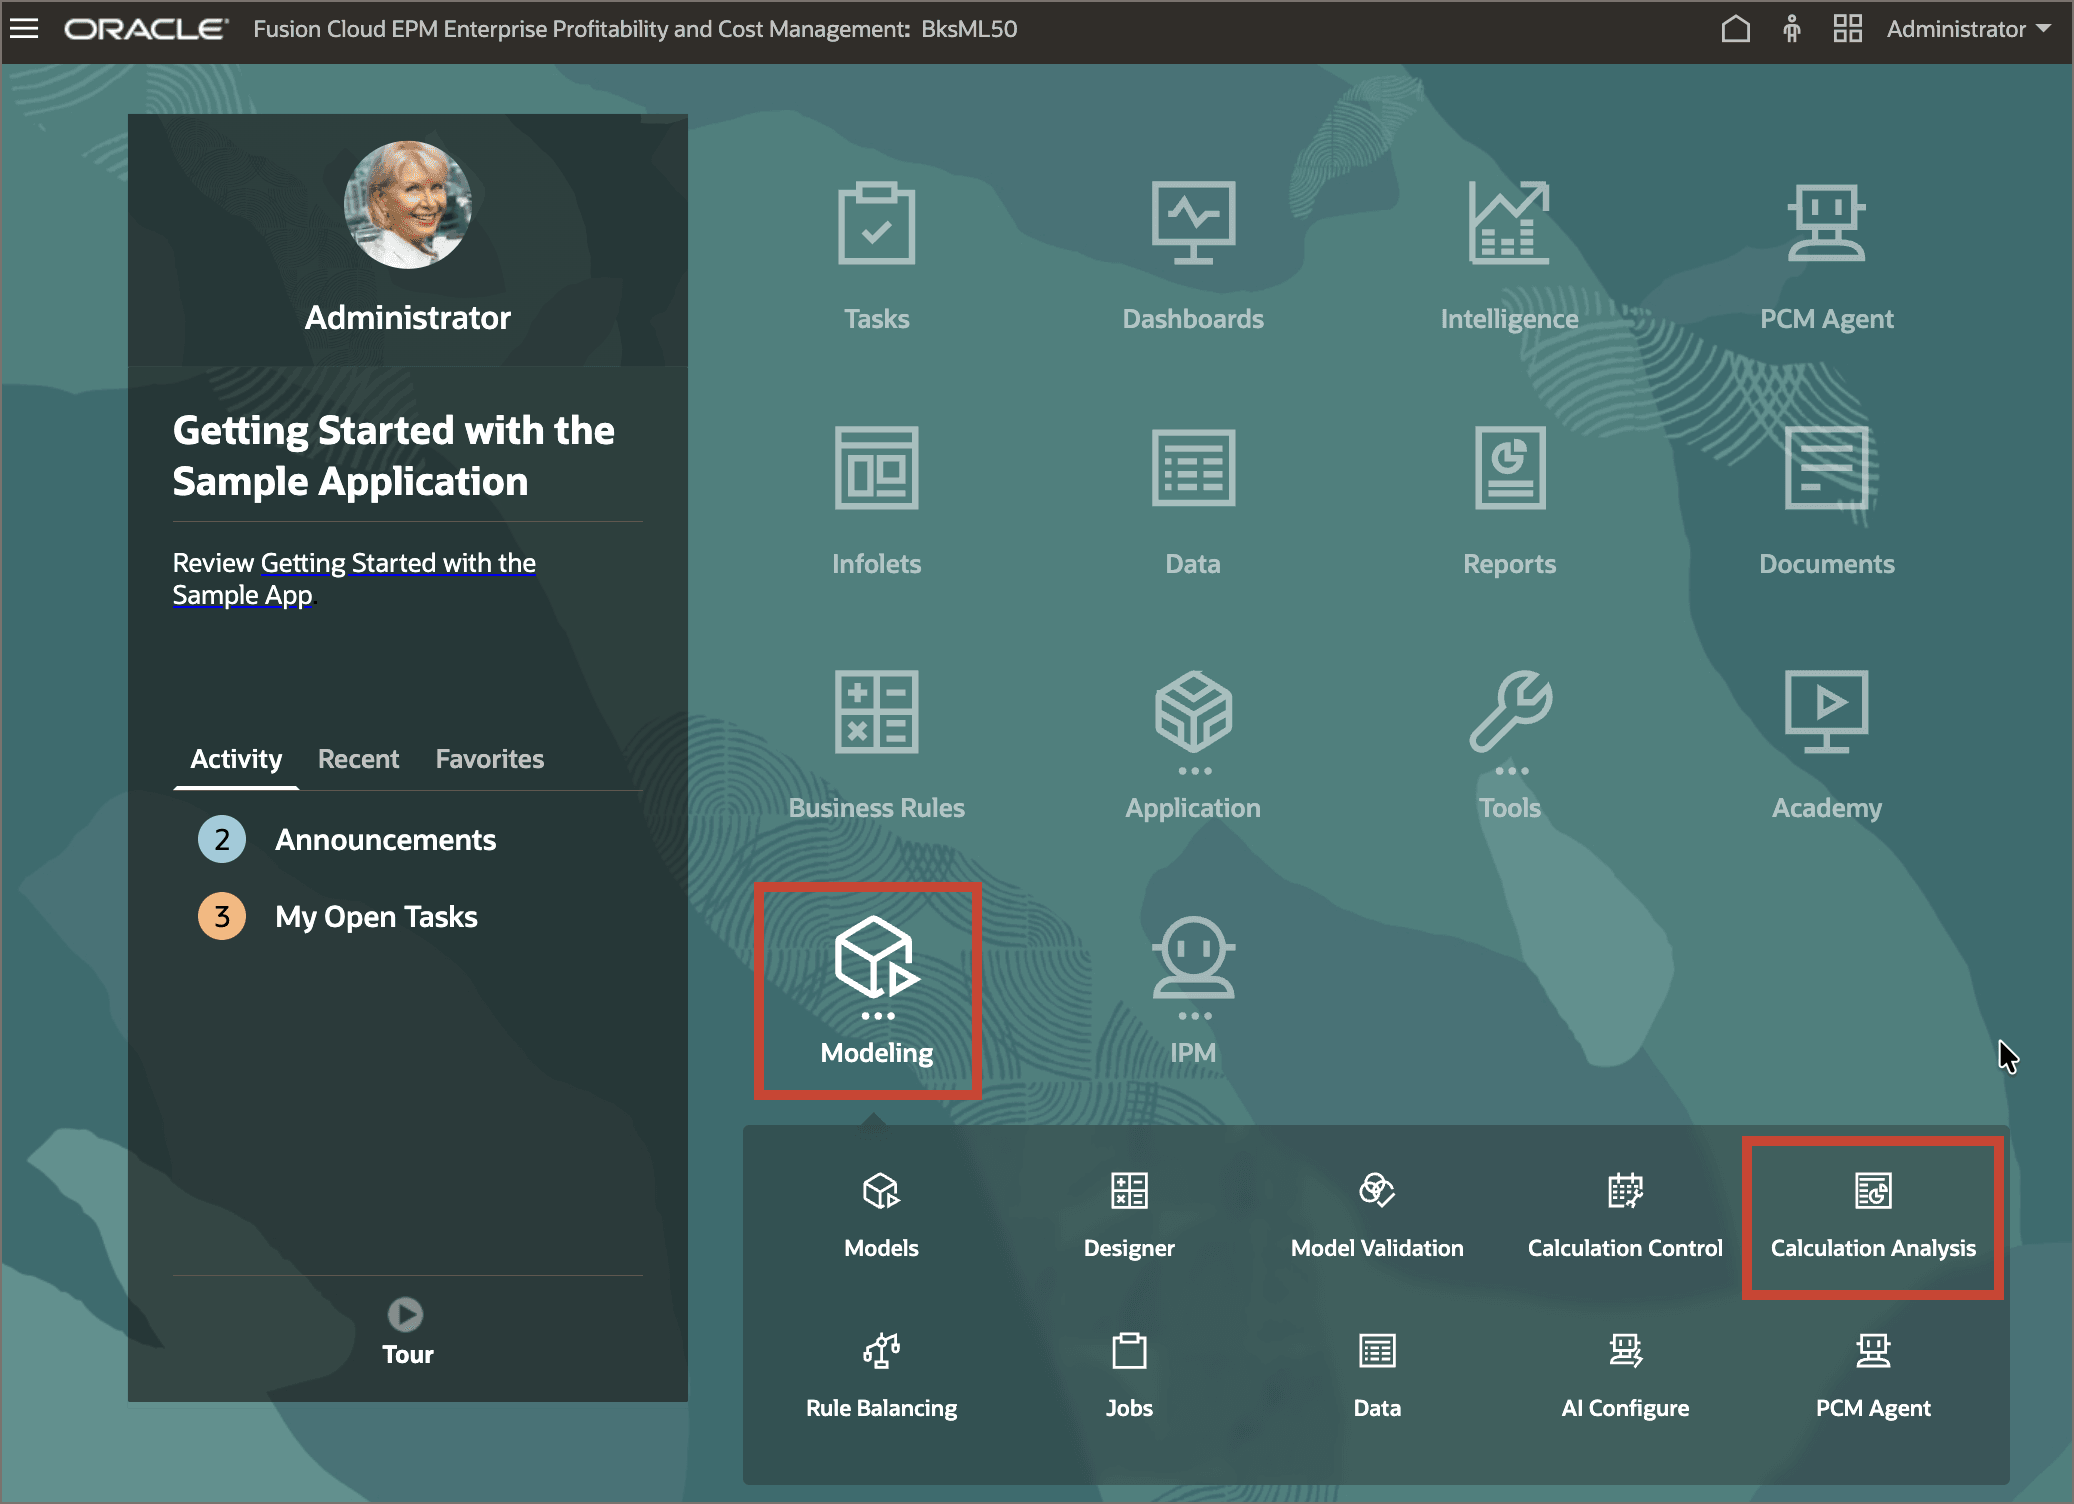
- From the home page, click Modeling, then click Calculation Analysis.
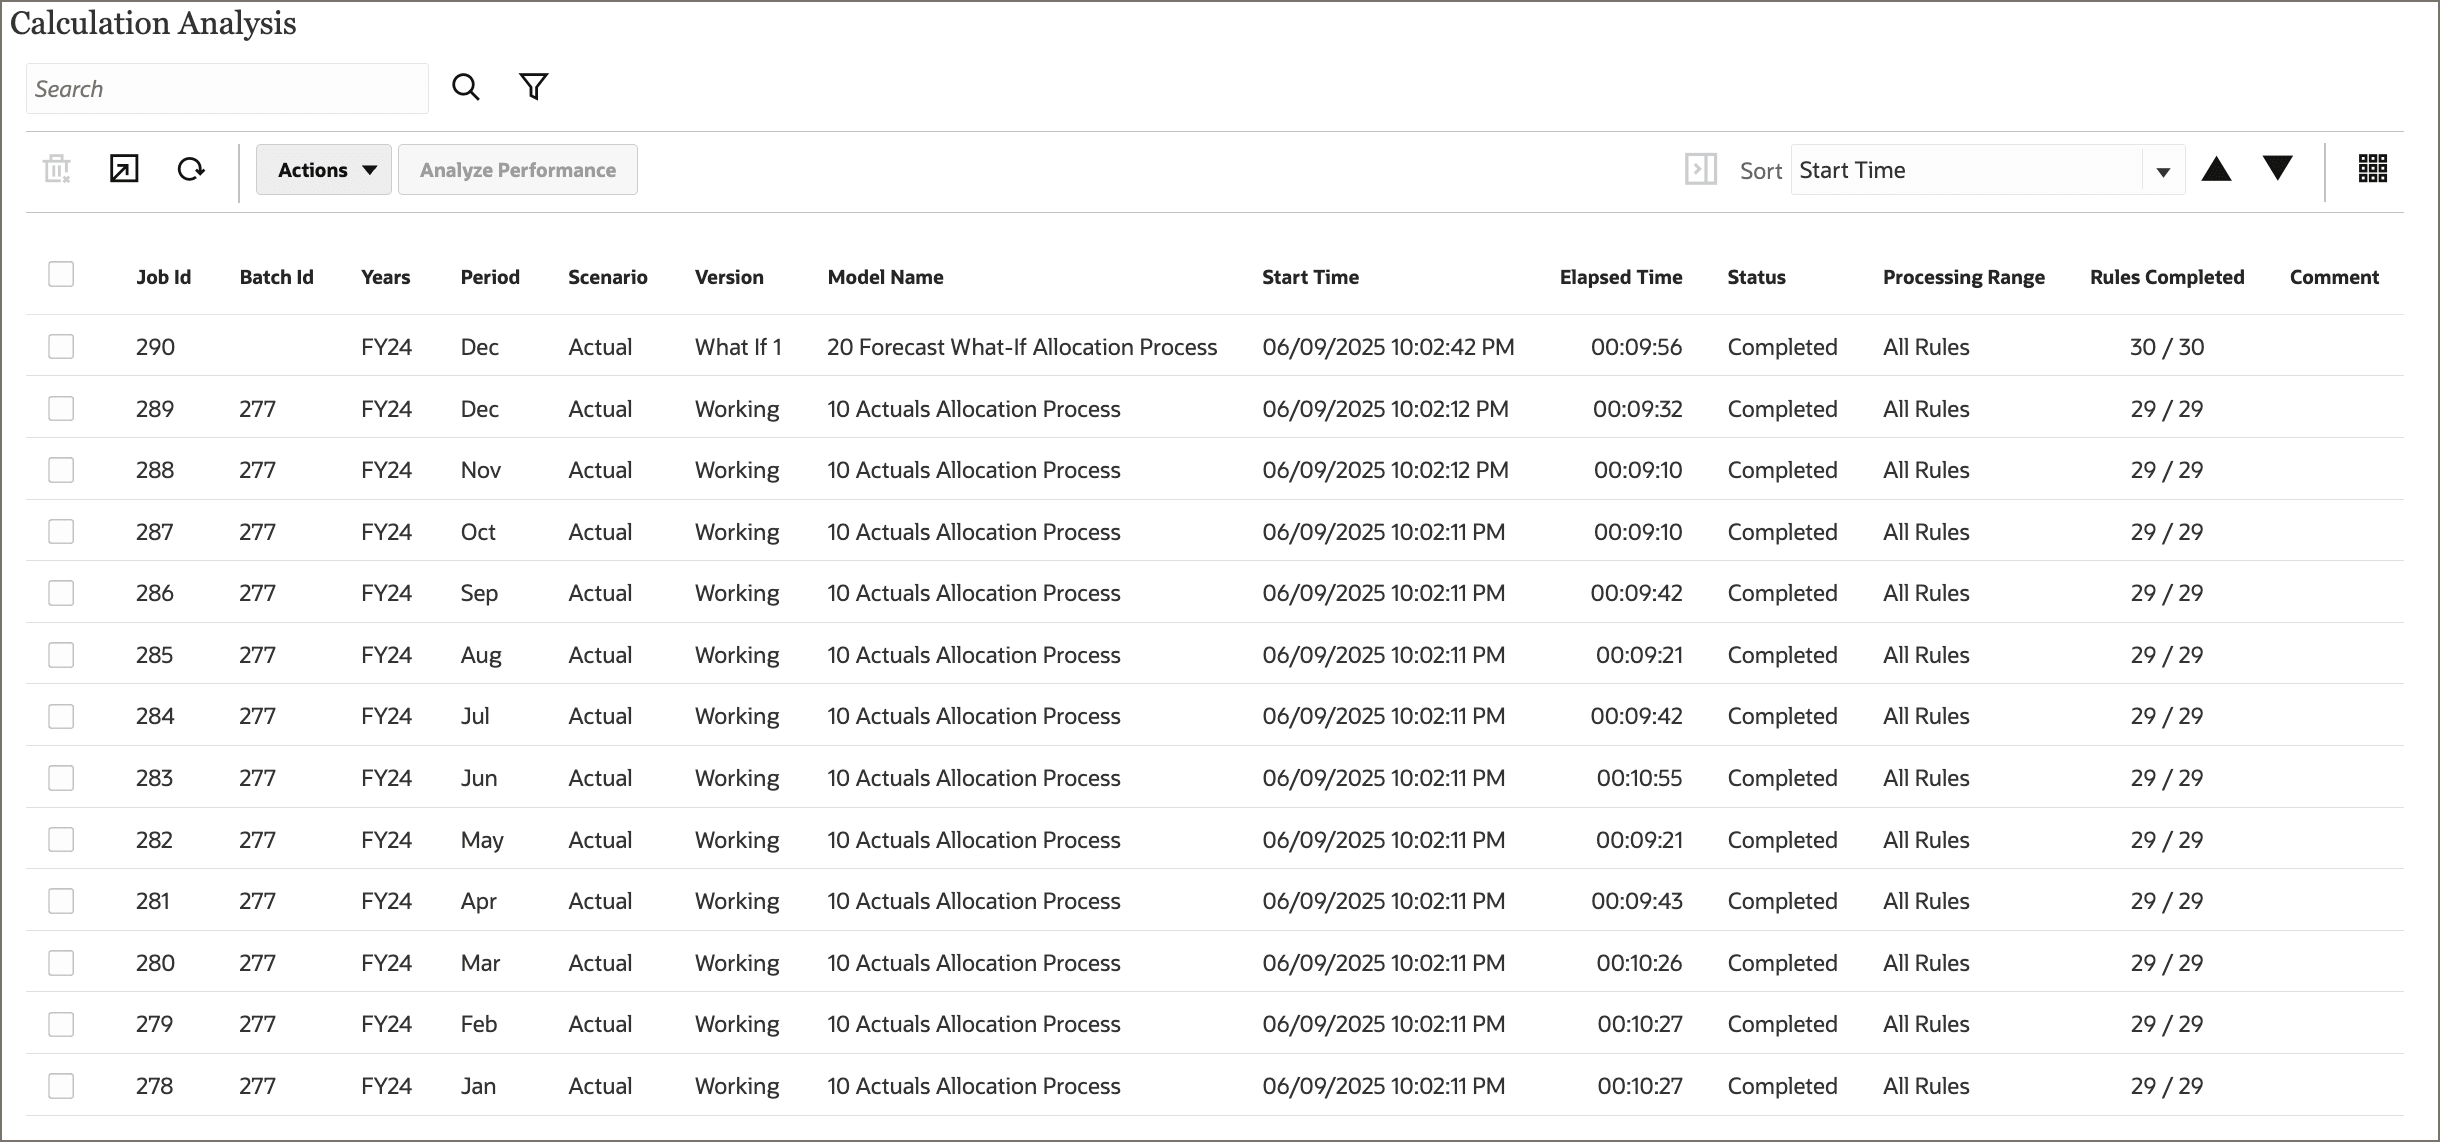
- Select job 289 (the calculation for the POV FY24::Dec::Actual::Working), then click Analyze Performance.
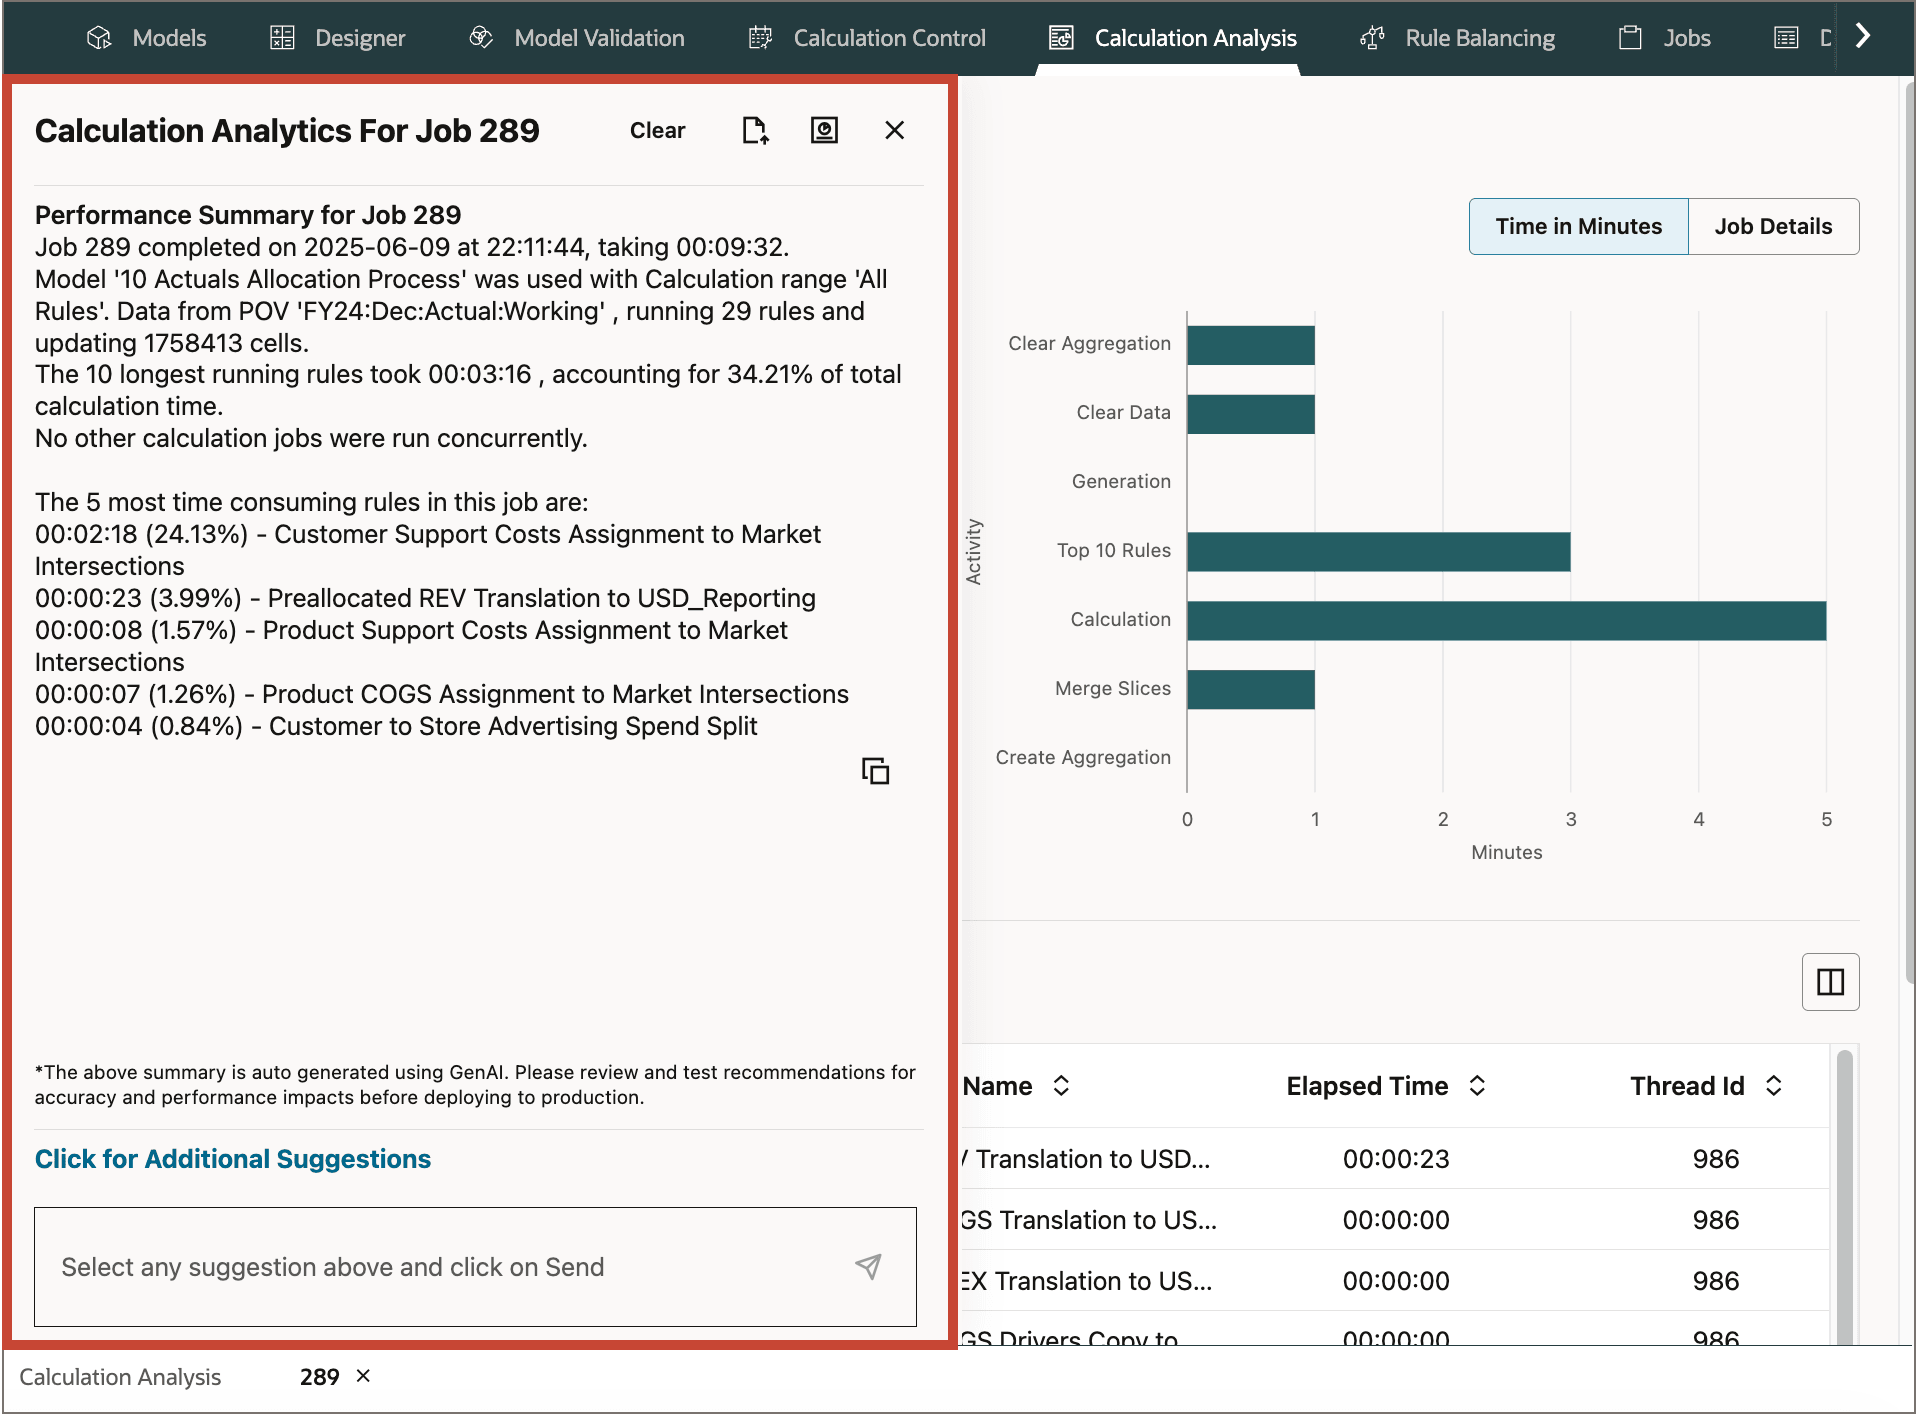
- A performance summary for the job. This includes a list of the 5 most time consuming rules in the job, as well as a paragraph summarizing the job's parameters and basic statistics.
- A calculation acitivy chart, which measures the time in minutes of each major section of the calculation job.
- A list of rules in the job with calculation statistics for each rule.
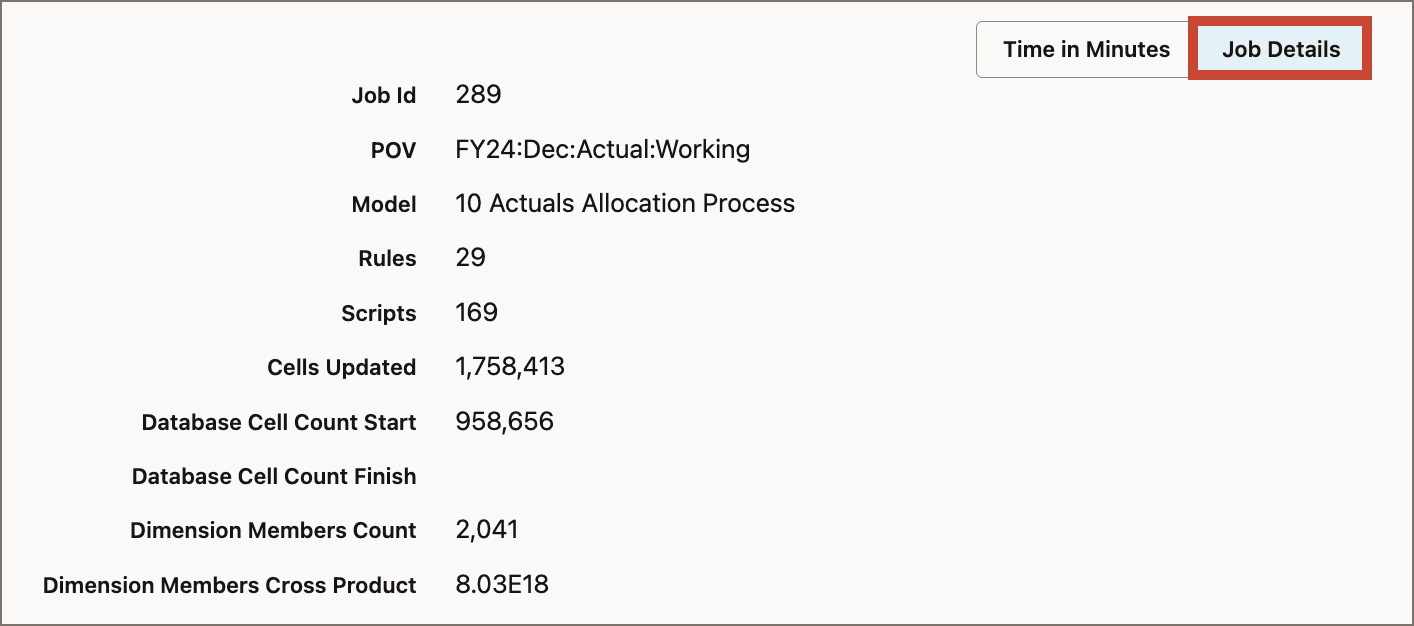
- On the Calculation Activity chart component, click Job Details to view more job details.
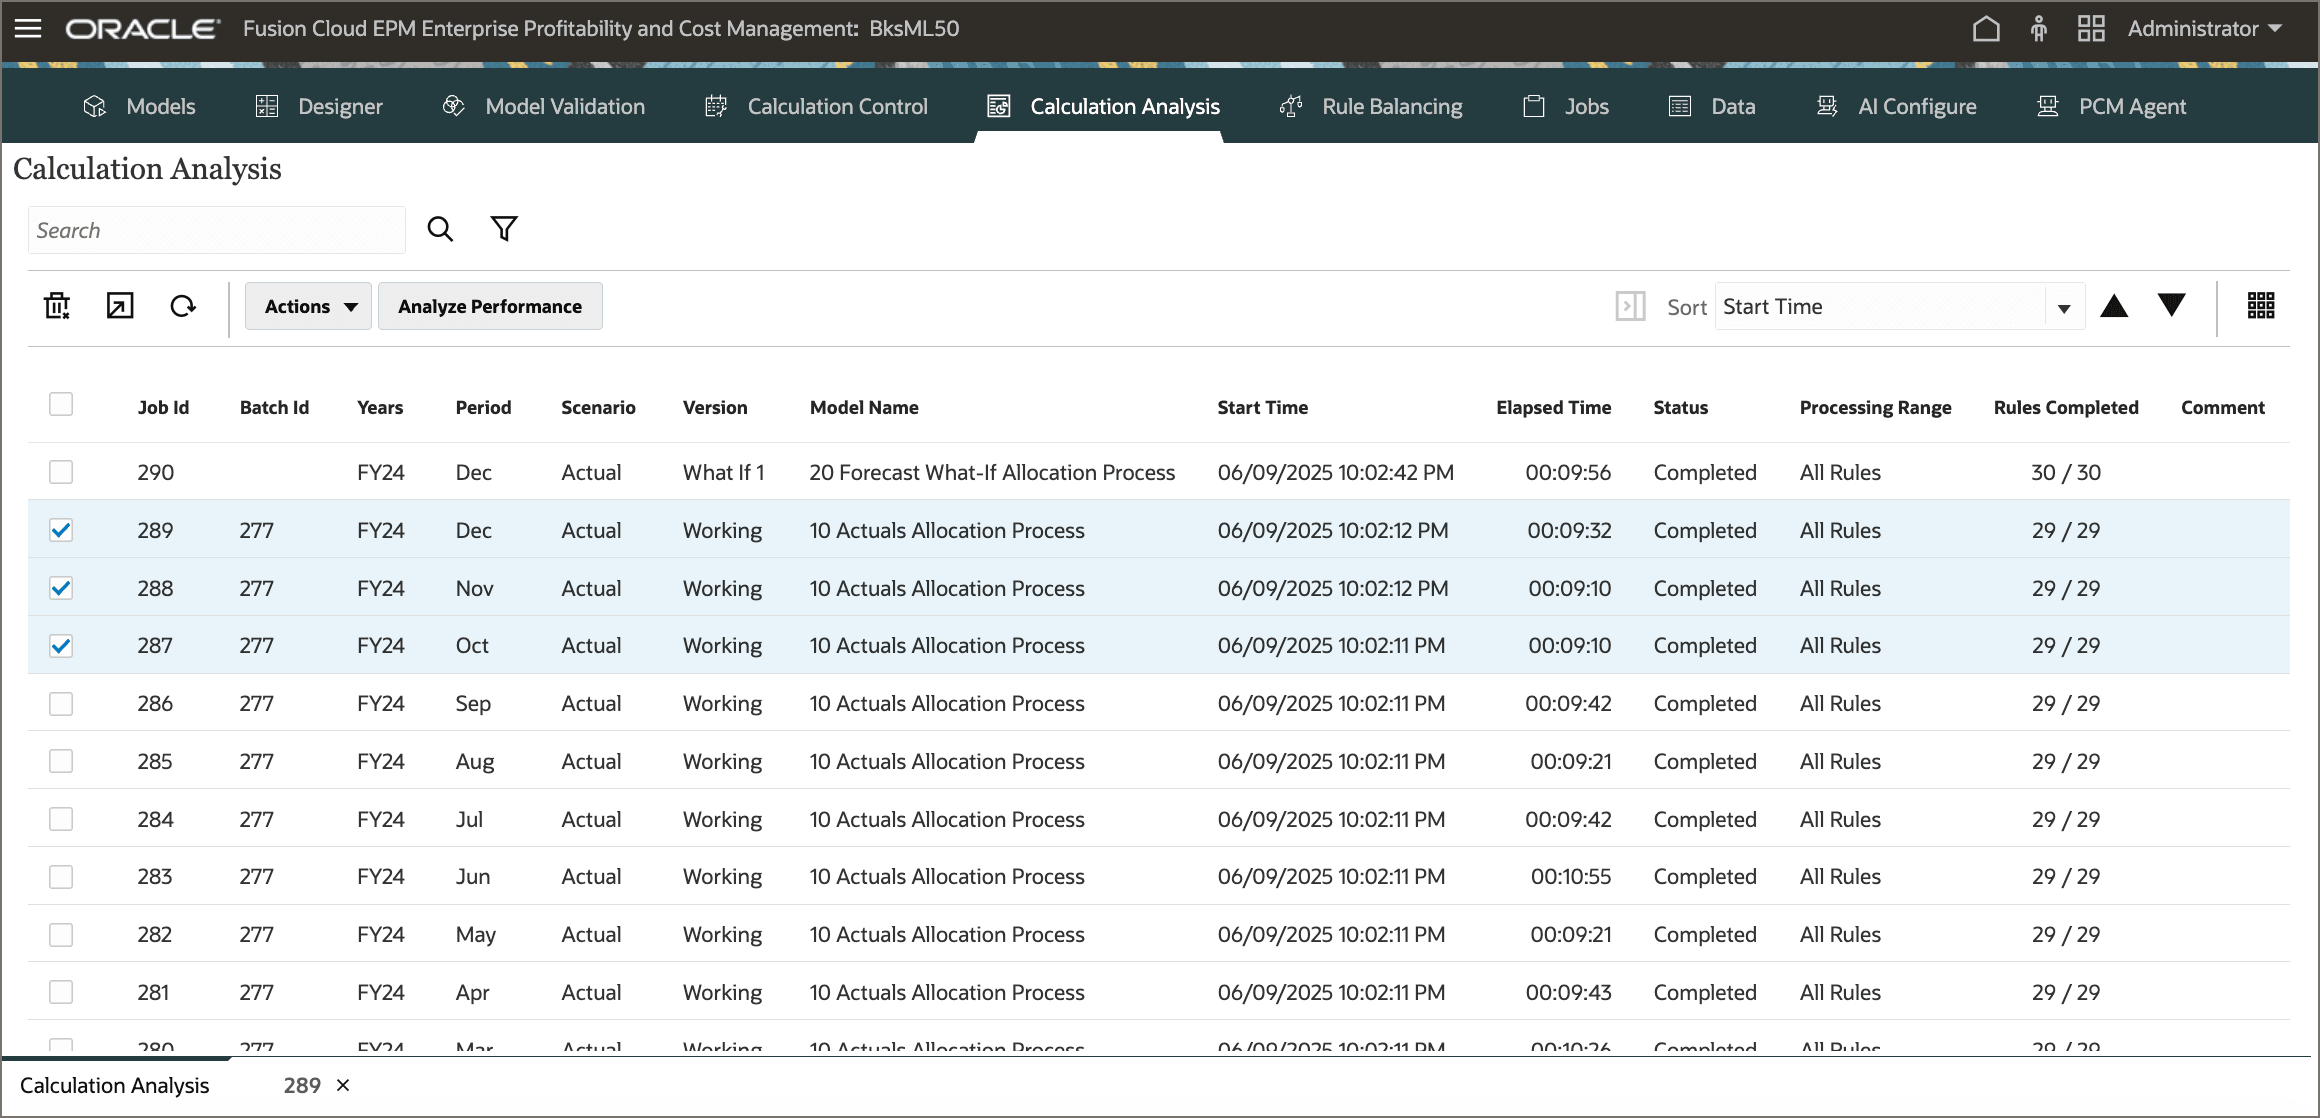
The Calculation Analysis page displays a list of historical calculation jobs. Each row lists the job ID, a batch ID if the job was part of a batch calculation, the point of view (POV) for the job, the name of the model used for the calculation, the start time and elapsed calculation time, the job status, the selected processing range, the number of rules calculated, and any comment on the job.
In this example, the list includes batch calculation 277, which calculated Actual Working data for all periods of FY24 using the 10 Actuals Allocation Process model. Each period generated a separate calculation job (jobs 278 through 289). The list also includes job 290, a single calculation job for the POV FY24::Dec::Actual::What If 1 using the model 20 Forecast What If Allocation Process.
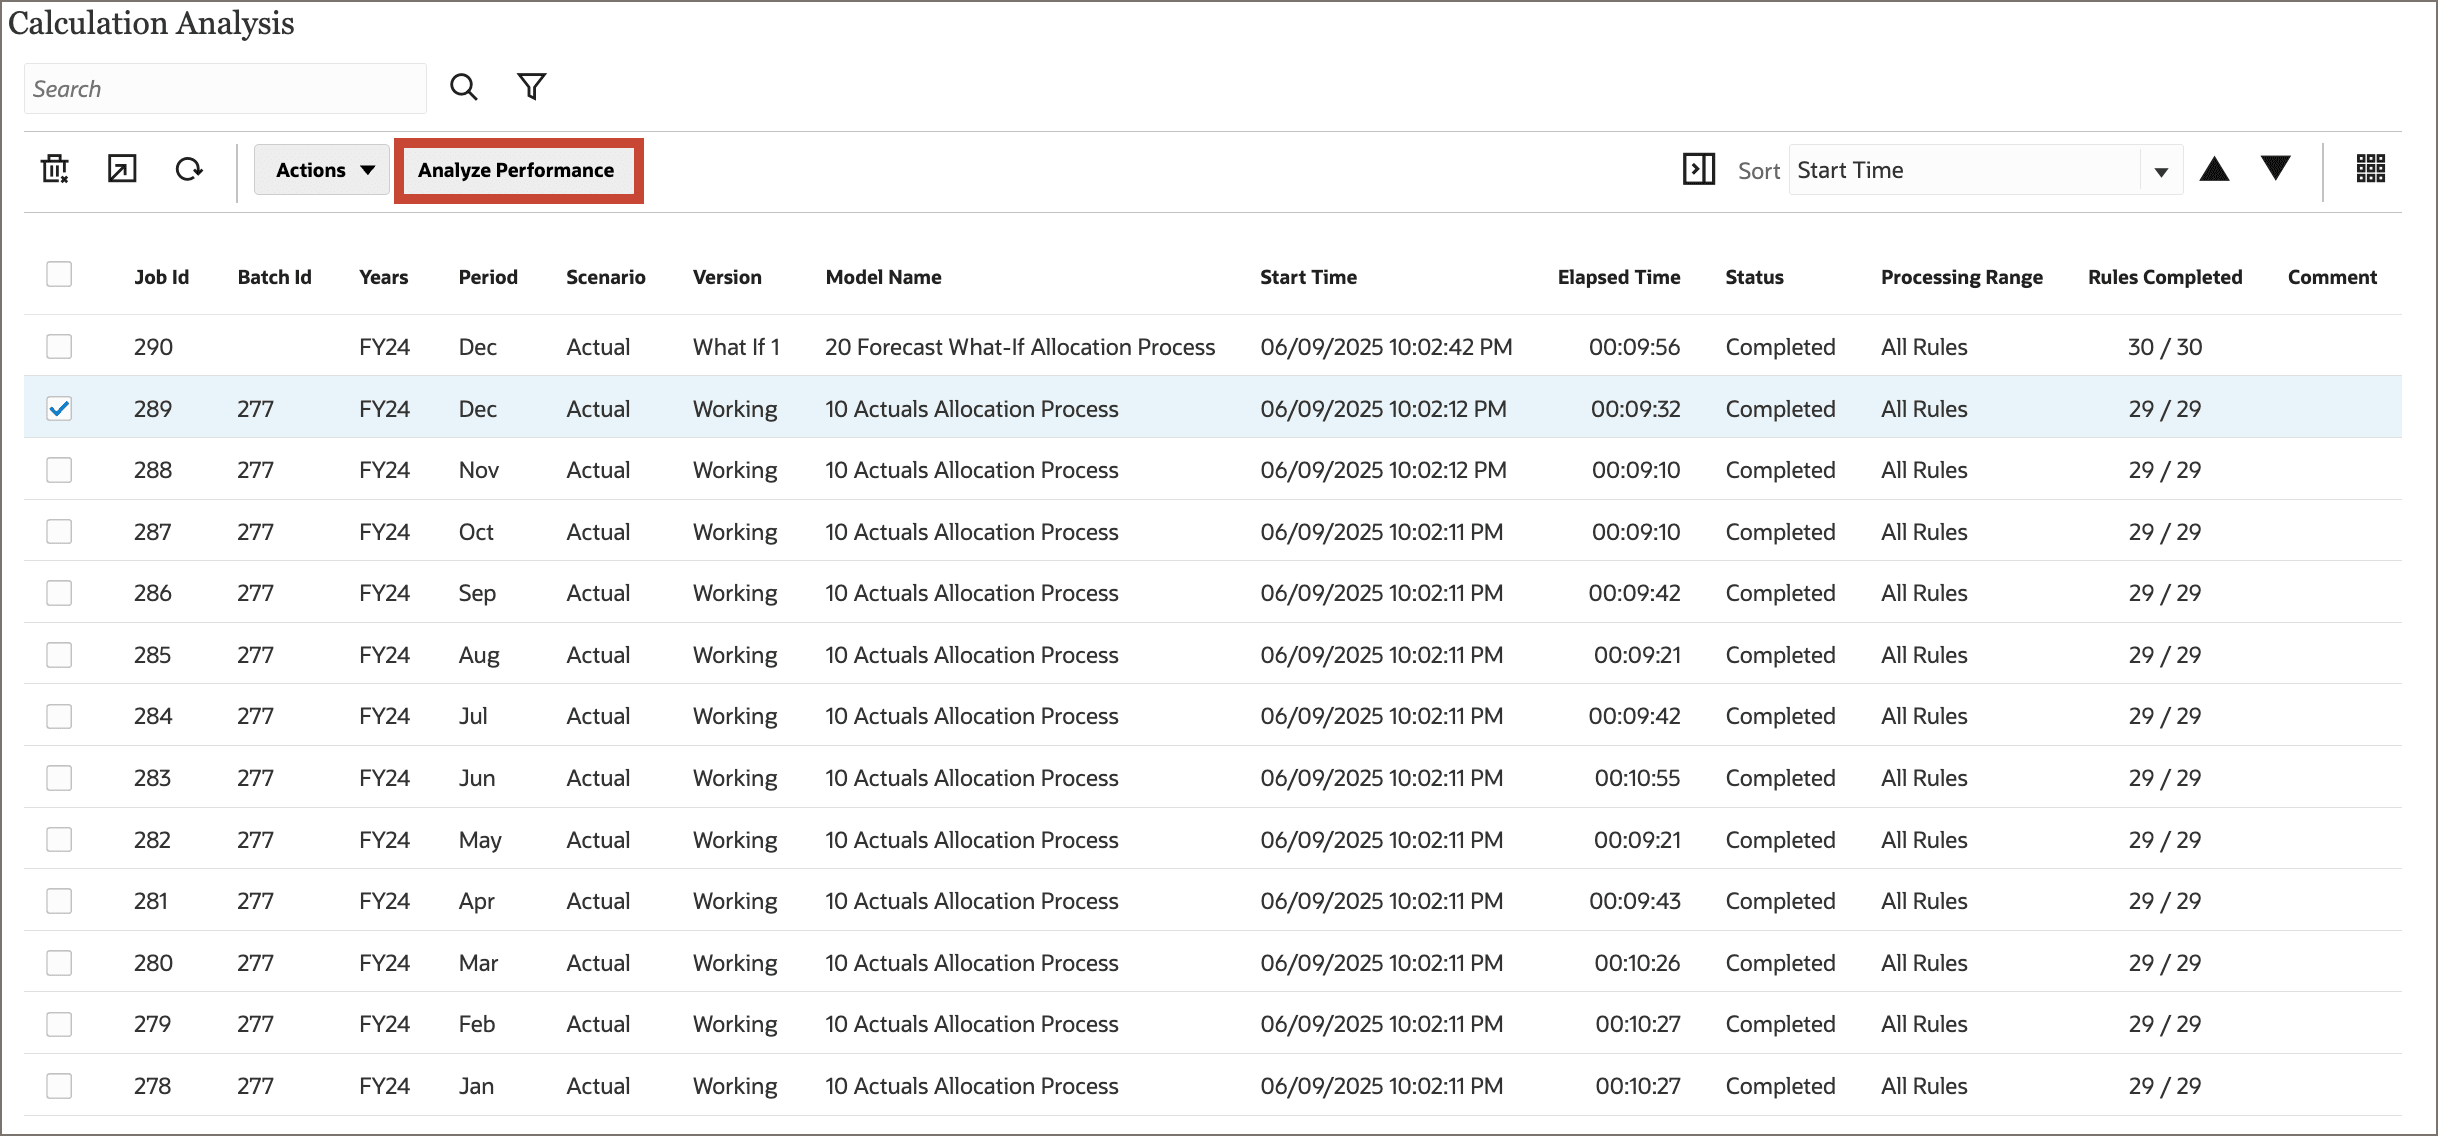
Clicking the Analyze Performance button engages the calculation analysis assistant and runs a generative AI analysis on the calculation job and displays the resulting Job Dashboard in a new tab:
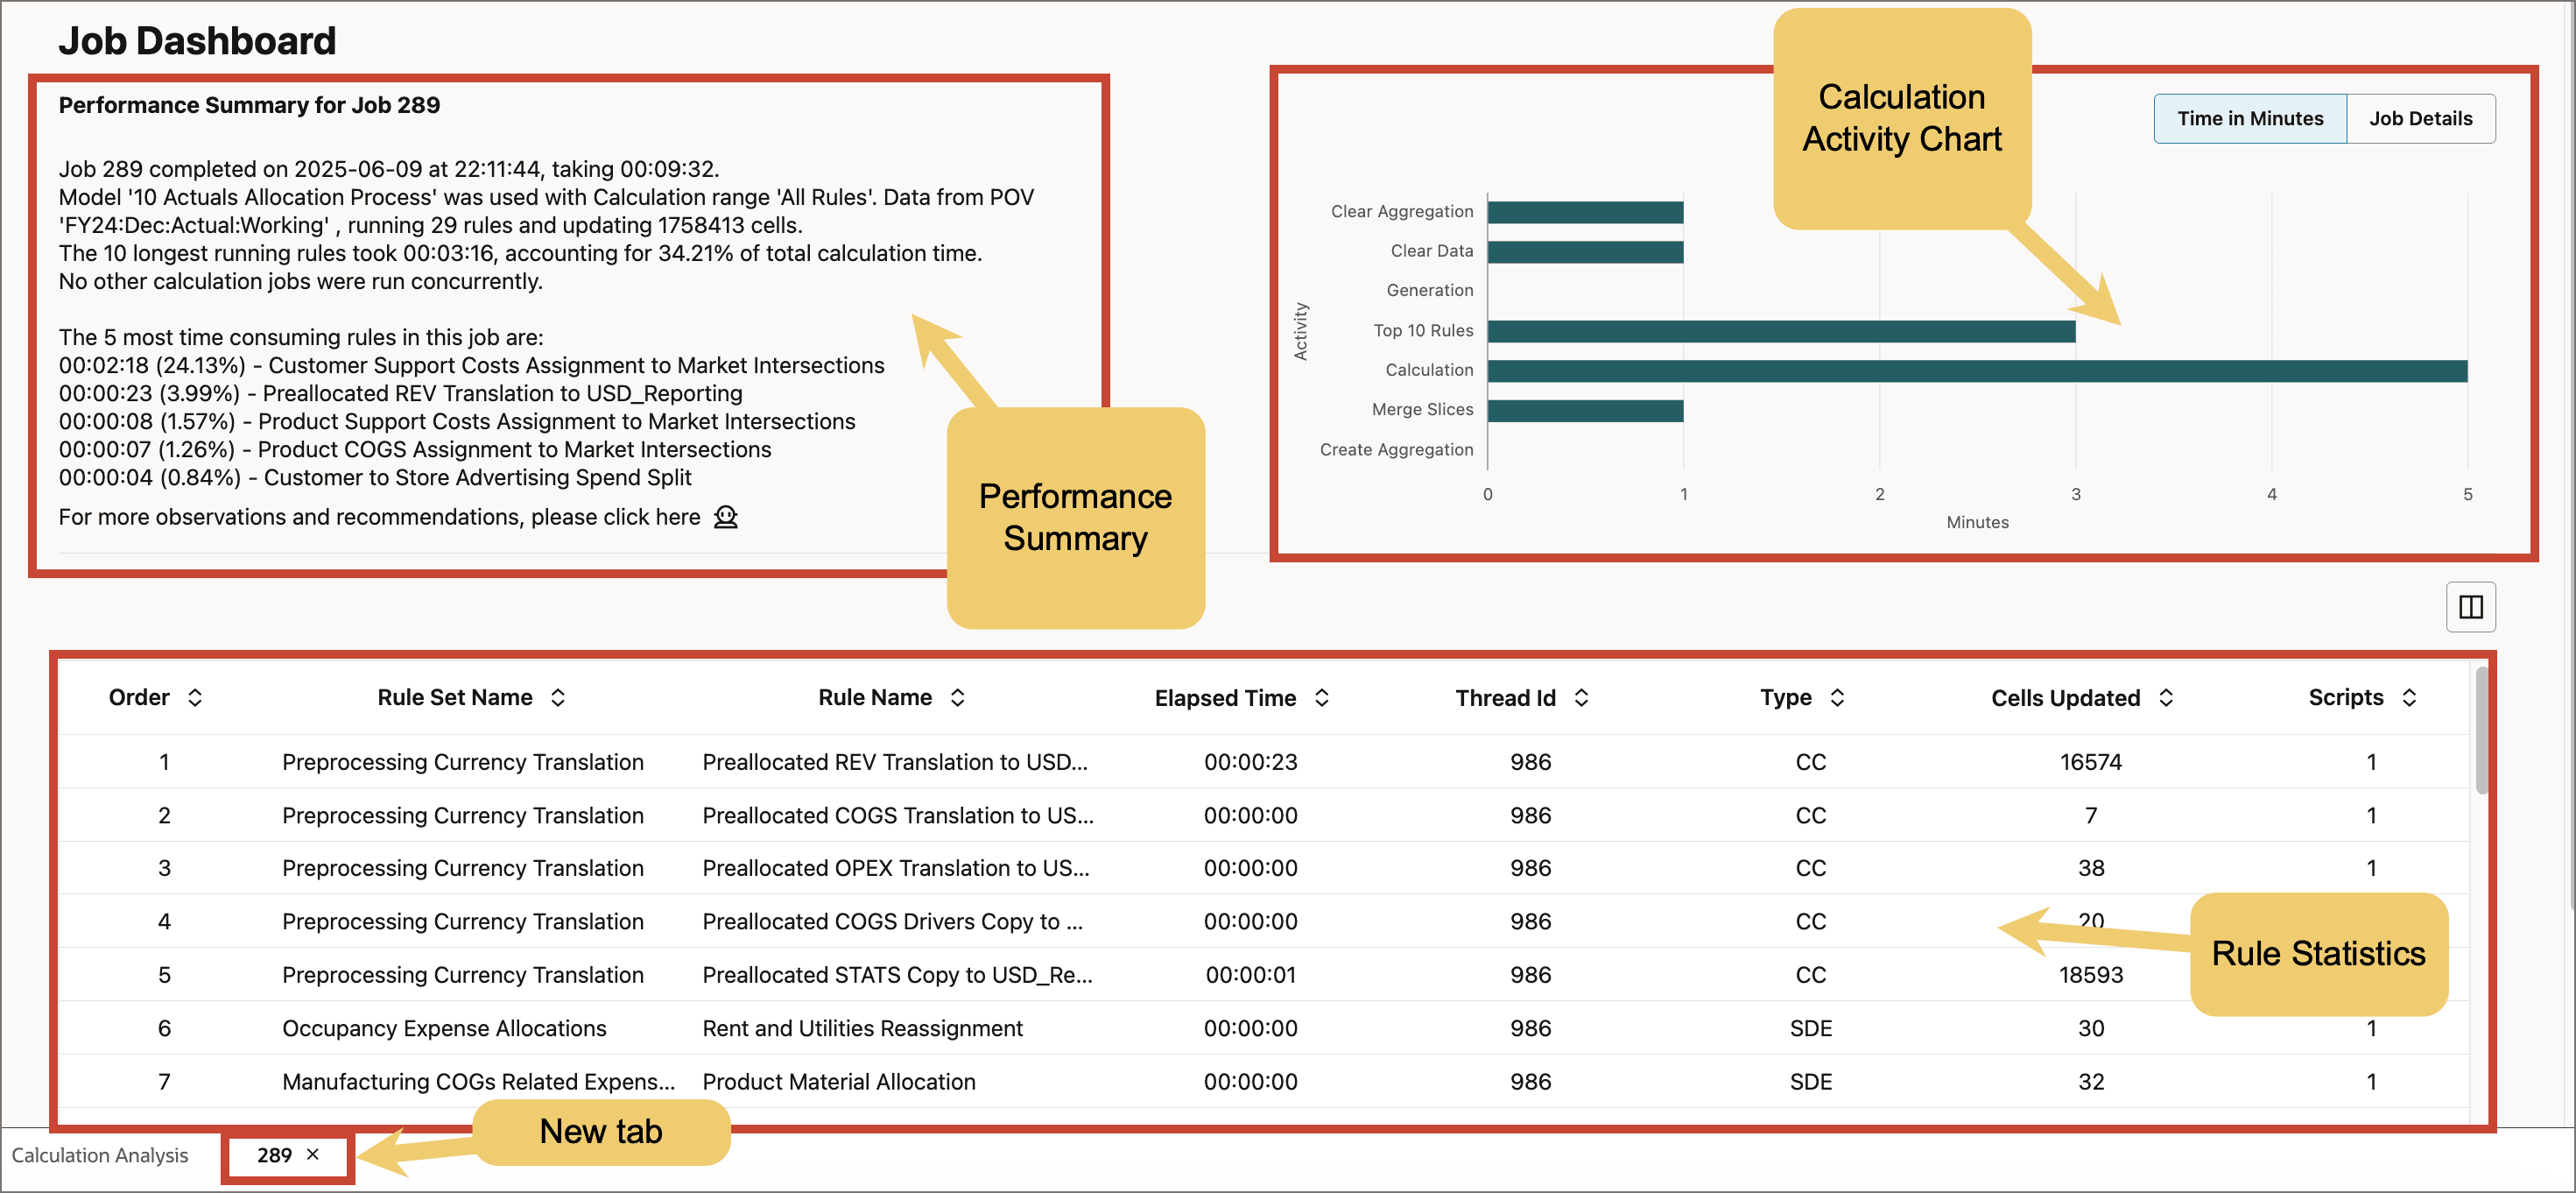
The Job Dashboard has the following components:
Accessing Generative AI Observations and Recommendations
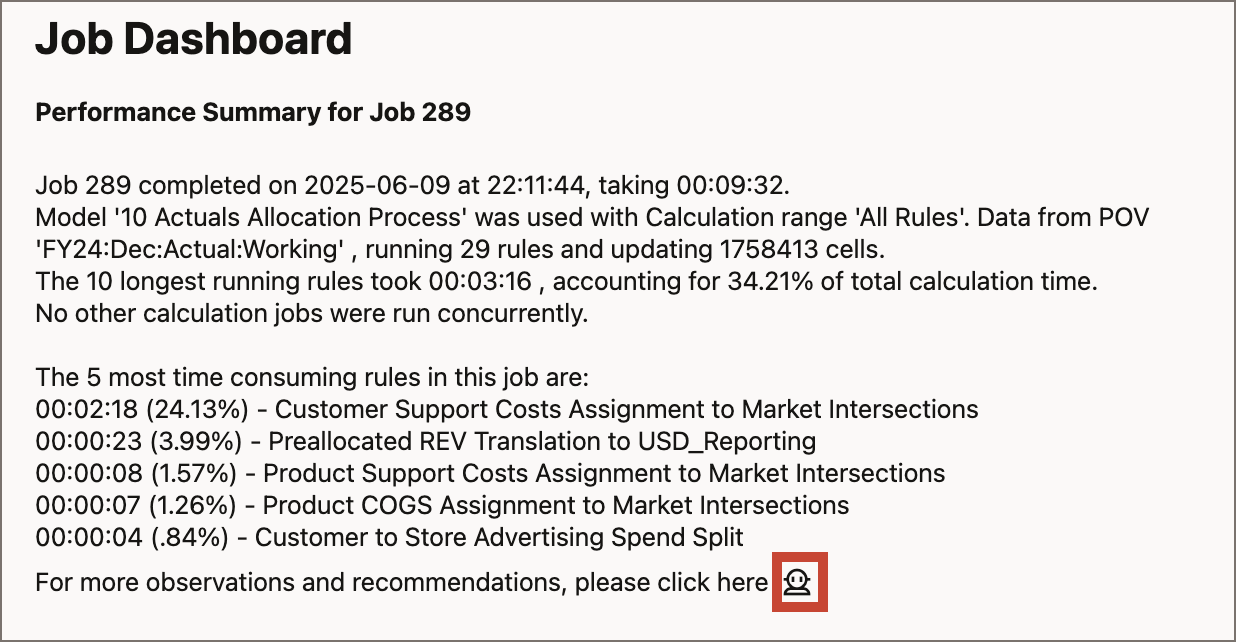
The Job Dashboard gives you a useful summary of your calculation job statistics, but the calculation analysis assistant can expand on that information by isolating your most time consuming rules, comparing job statistics with other jobs, and evaluating dimension and rule design.
- In the Performance Summary component of the Job Dashboard, click
 (Click to view Generative AI recommendations).
 - Click Click for Additional Suggestions to view generative AI options for the job.
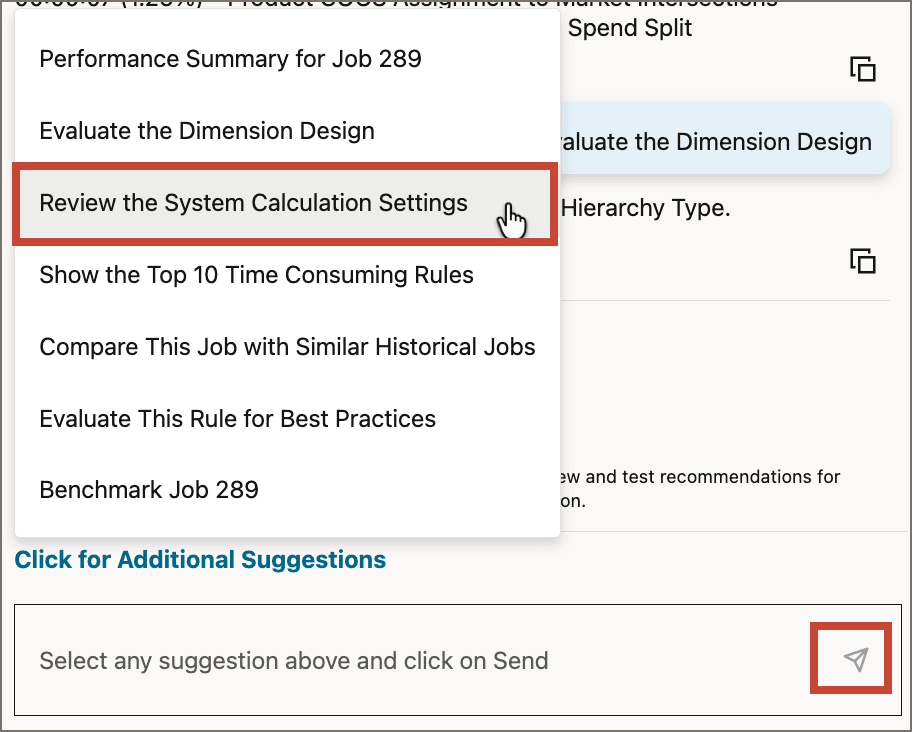
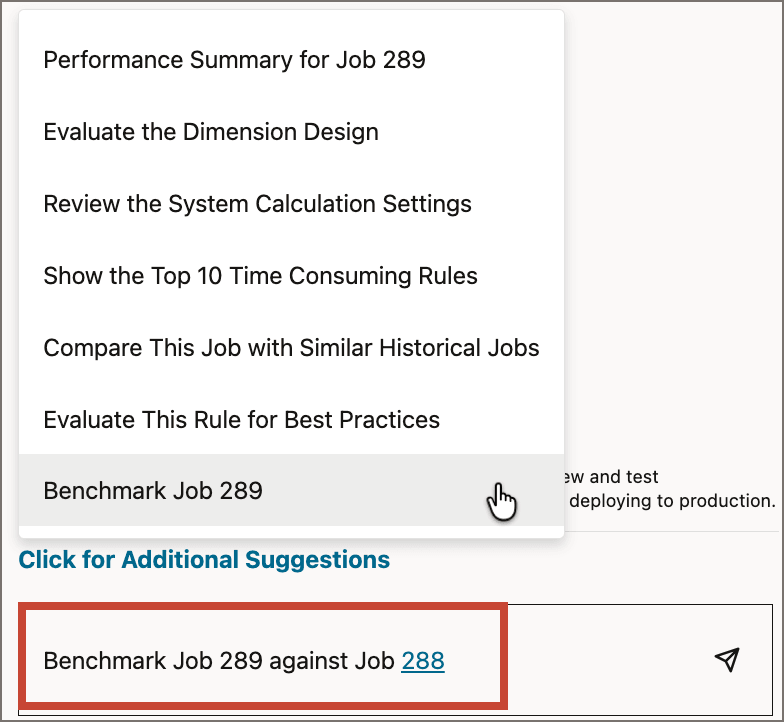
- Notice the available options for generative AI analysis on calculation jobs:
- Performance Summary for Job #: The default report, showing a summary of the job statistics.
- Evaluate the Dimension Design: The assistant evaluates your dimension designs for best practices.
- Review the System Calculation Settings: The assistant returns a list of your current system calculation settings for review.
- Show the Top 10 Time Consuming Rules: The assistant returns a list of the ten rules in your calculation that took the most time to calculate.
- Compare This Job with Similar Historical Jobs: The assistant looks for other calculation jobs with similar model and calculation range selections and displays average calculation benchmarks to compare with the current job.
- Evaluate This Rule for Best Practices: The assistant evaluates the selected rule design for best practices. You can select any of the top 10 time consuming rules for evaluation.
- Benchmark Job #: The assistant displays calculation benchmarks of the current calculation job against a selected historical calculation job. You can select from a list of jobs with similar model and calculation range selections for comparison.
- Finally, notice the toolbar icons at the top of the drawer:
- Clear: Clear the contents of the Calculation Analtyics drawer.
 (Export): Export the contents of the Calculation Analytics drawer to a text file.
 (Generate Analysis Summary Report): Generate a text file with a summary analysis that includes a performance summary for the job, an evaluation of dimension design, a review of the system calculation settings, the list of the top 10 time consuming rules in the job, and a comparison with similar historical jobs.
The Calculation Analytics drawer slides out, displaying the job performance summary.
Note:
Generative AI for performance analysis does not accept natural language prompts. There is a set list of commands you can send to the calculation analysis assistant to analye your calculation job performance.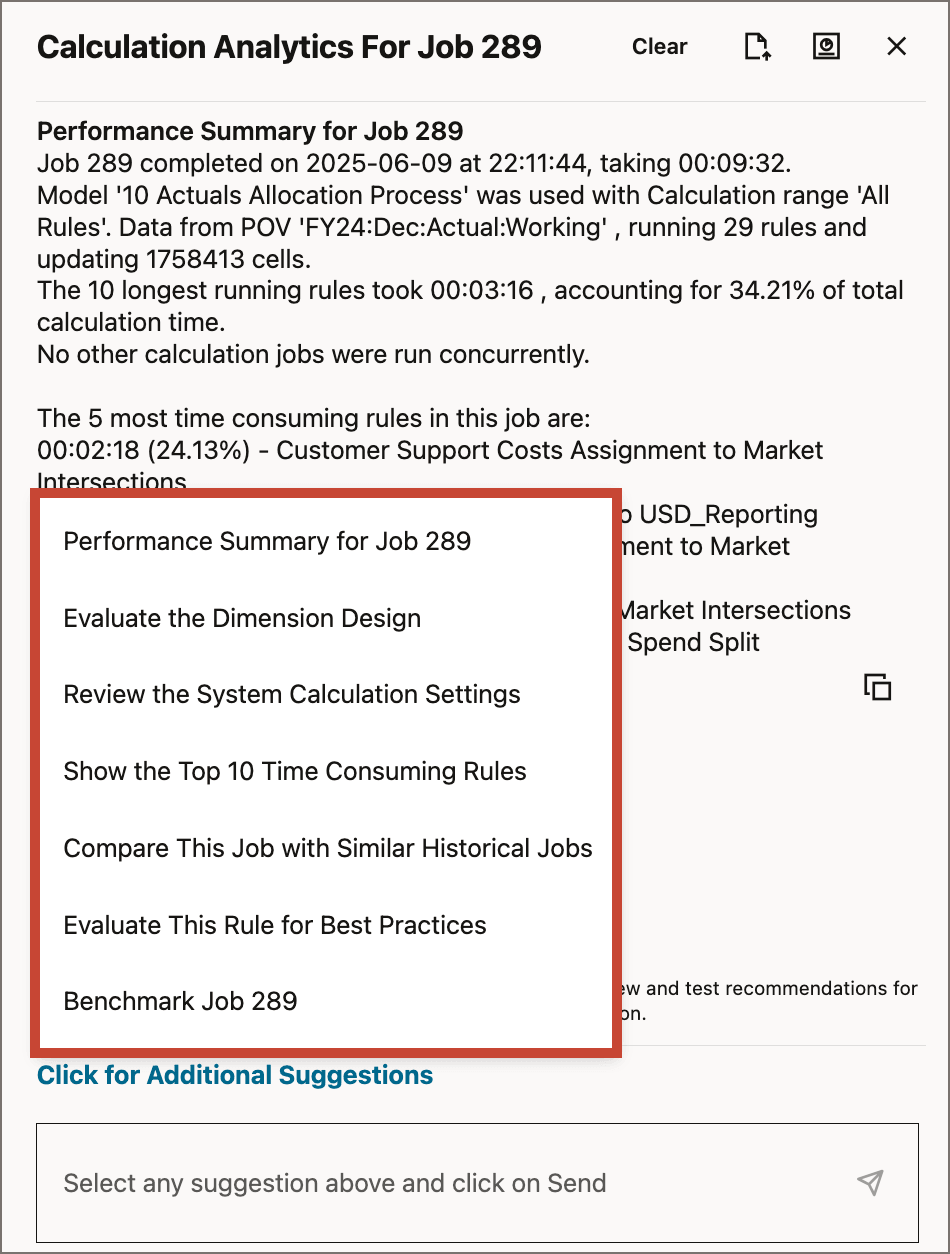
Evaluating the Dimension Design
- From the list of generative AI suggestions, select Evaluate the Dimension Design, then click
 (Send).
The assistant checks for dimension design best practices; mainly that the Dynamic hierarchy type is being used only when necessary.
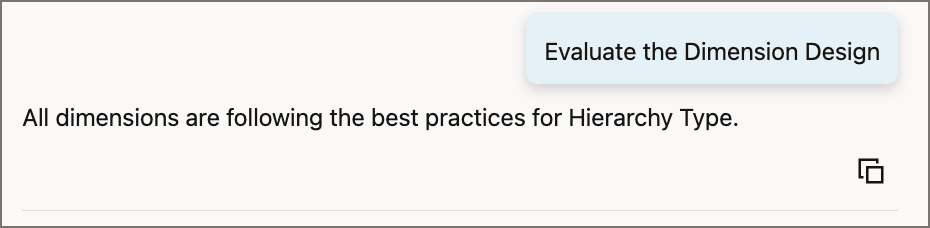
The sample application doesn't include any dynamic hierarchies that should be stored, so the assistant returns the message "All dimensions are following the best practices for Hierarchy Type."
For applications with dimensions that don't follow design best practices for hierarchy types, the assistant returns a message similar to the following:
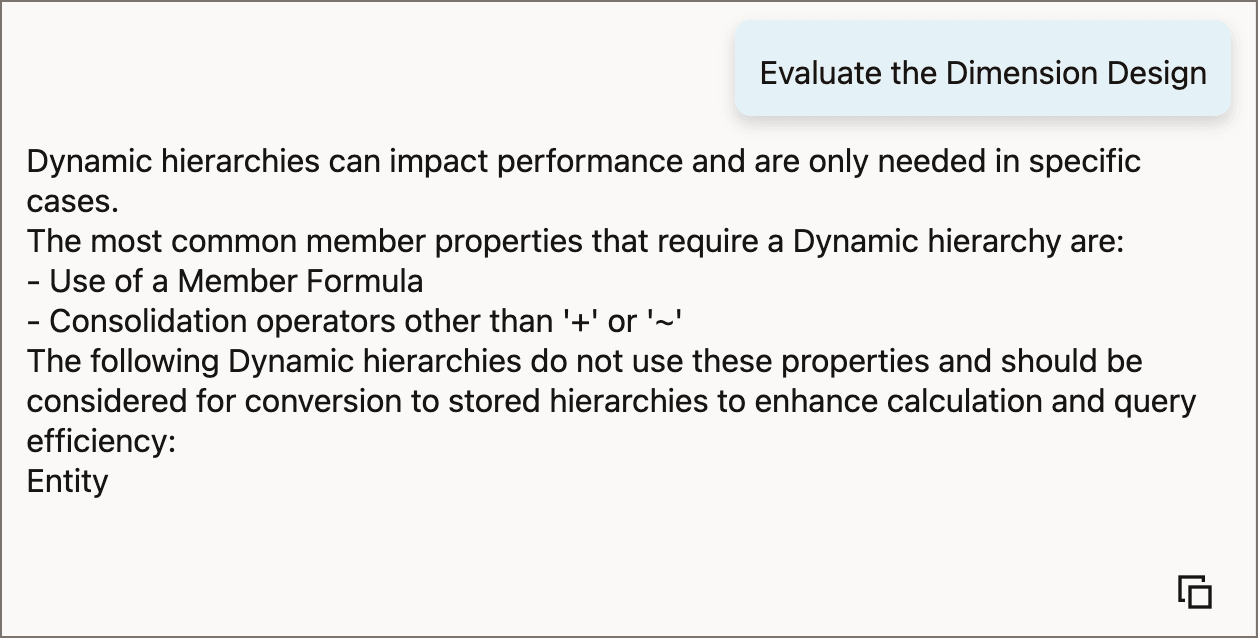
The message from the assistant gives you information about dimension designs that could possibly affect calculation times. This does not mean that changing your dimension design will improve performance, but it does give you a place to start troubleshooting.
Reviewing System Calculation Settings
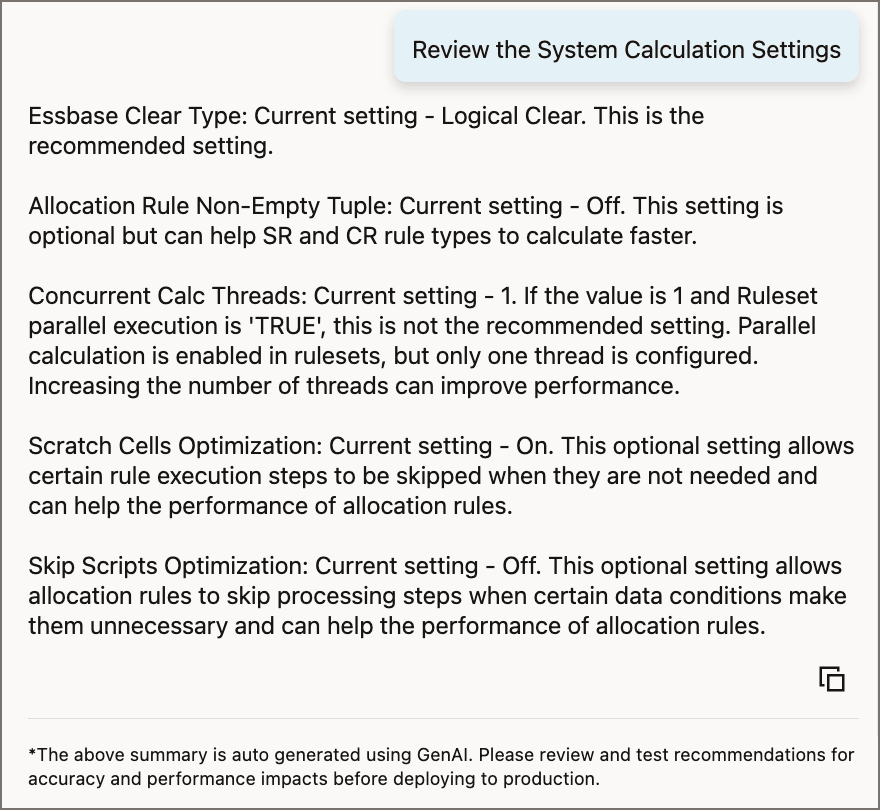
- From the list of generative AI suggestions, select Review the System Calculation Settings, then click (Send).
- Essbase Clear Type: Current Setting - Logical Clear. This is the recommended setting.
- Allocation Rule Non-Empty Tuple: Current setting — Off. This setting is optional but can help SR and CR rule types fo calculate faster.
- Concurrent Calc Threads: Current Setting - 1. If the value is 1 and Ruleset parallel execution is 'TRUE', this is not the recommended setting. Parallel calculation is enabled in rulesets, but only one thread is configured. Increasing the number of threads can improve performance.
- Scratch Cells Optimization: Current setting - On. This optional setting allows certain rule execution steps to be skipped when they are not needed and can help the performance of allocation rules.
- Skip Scripts Optimization: Current setting - Off. This optional setting allows allocation rules to skip processing steps when certain data conditions make them unnecessary and can help the performance of allocation rules.
- Return to the home page.
- Click Application, then click Settings.
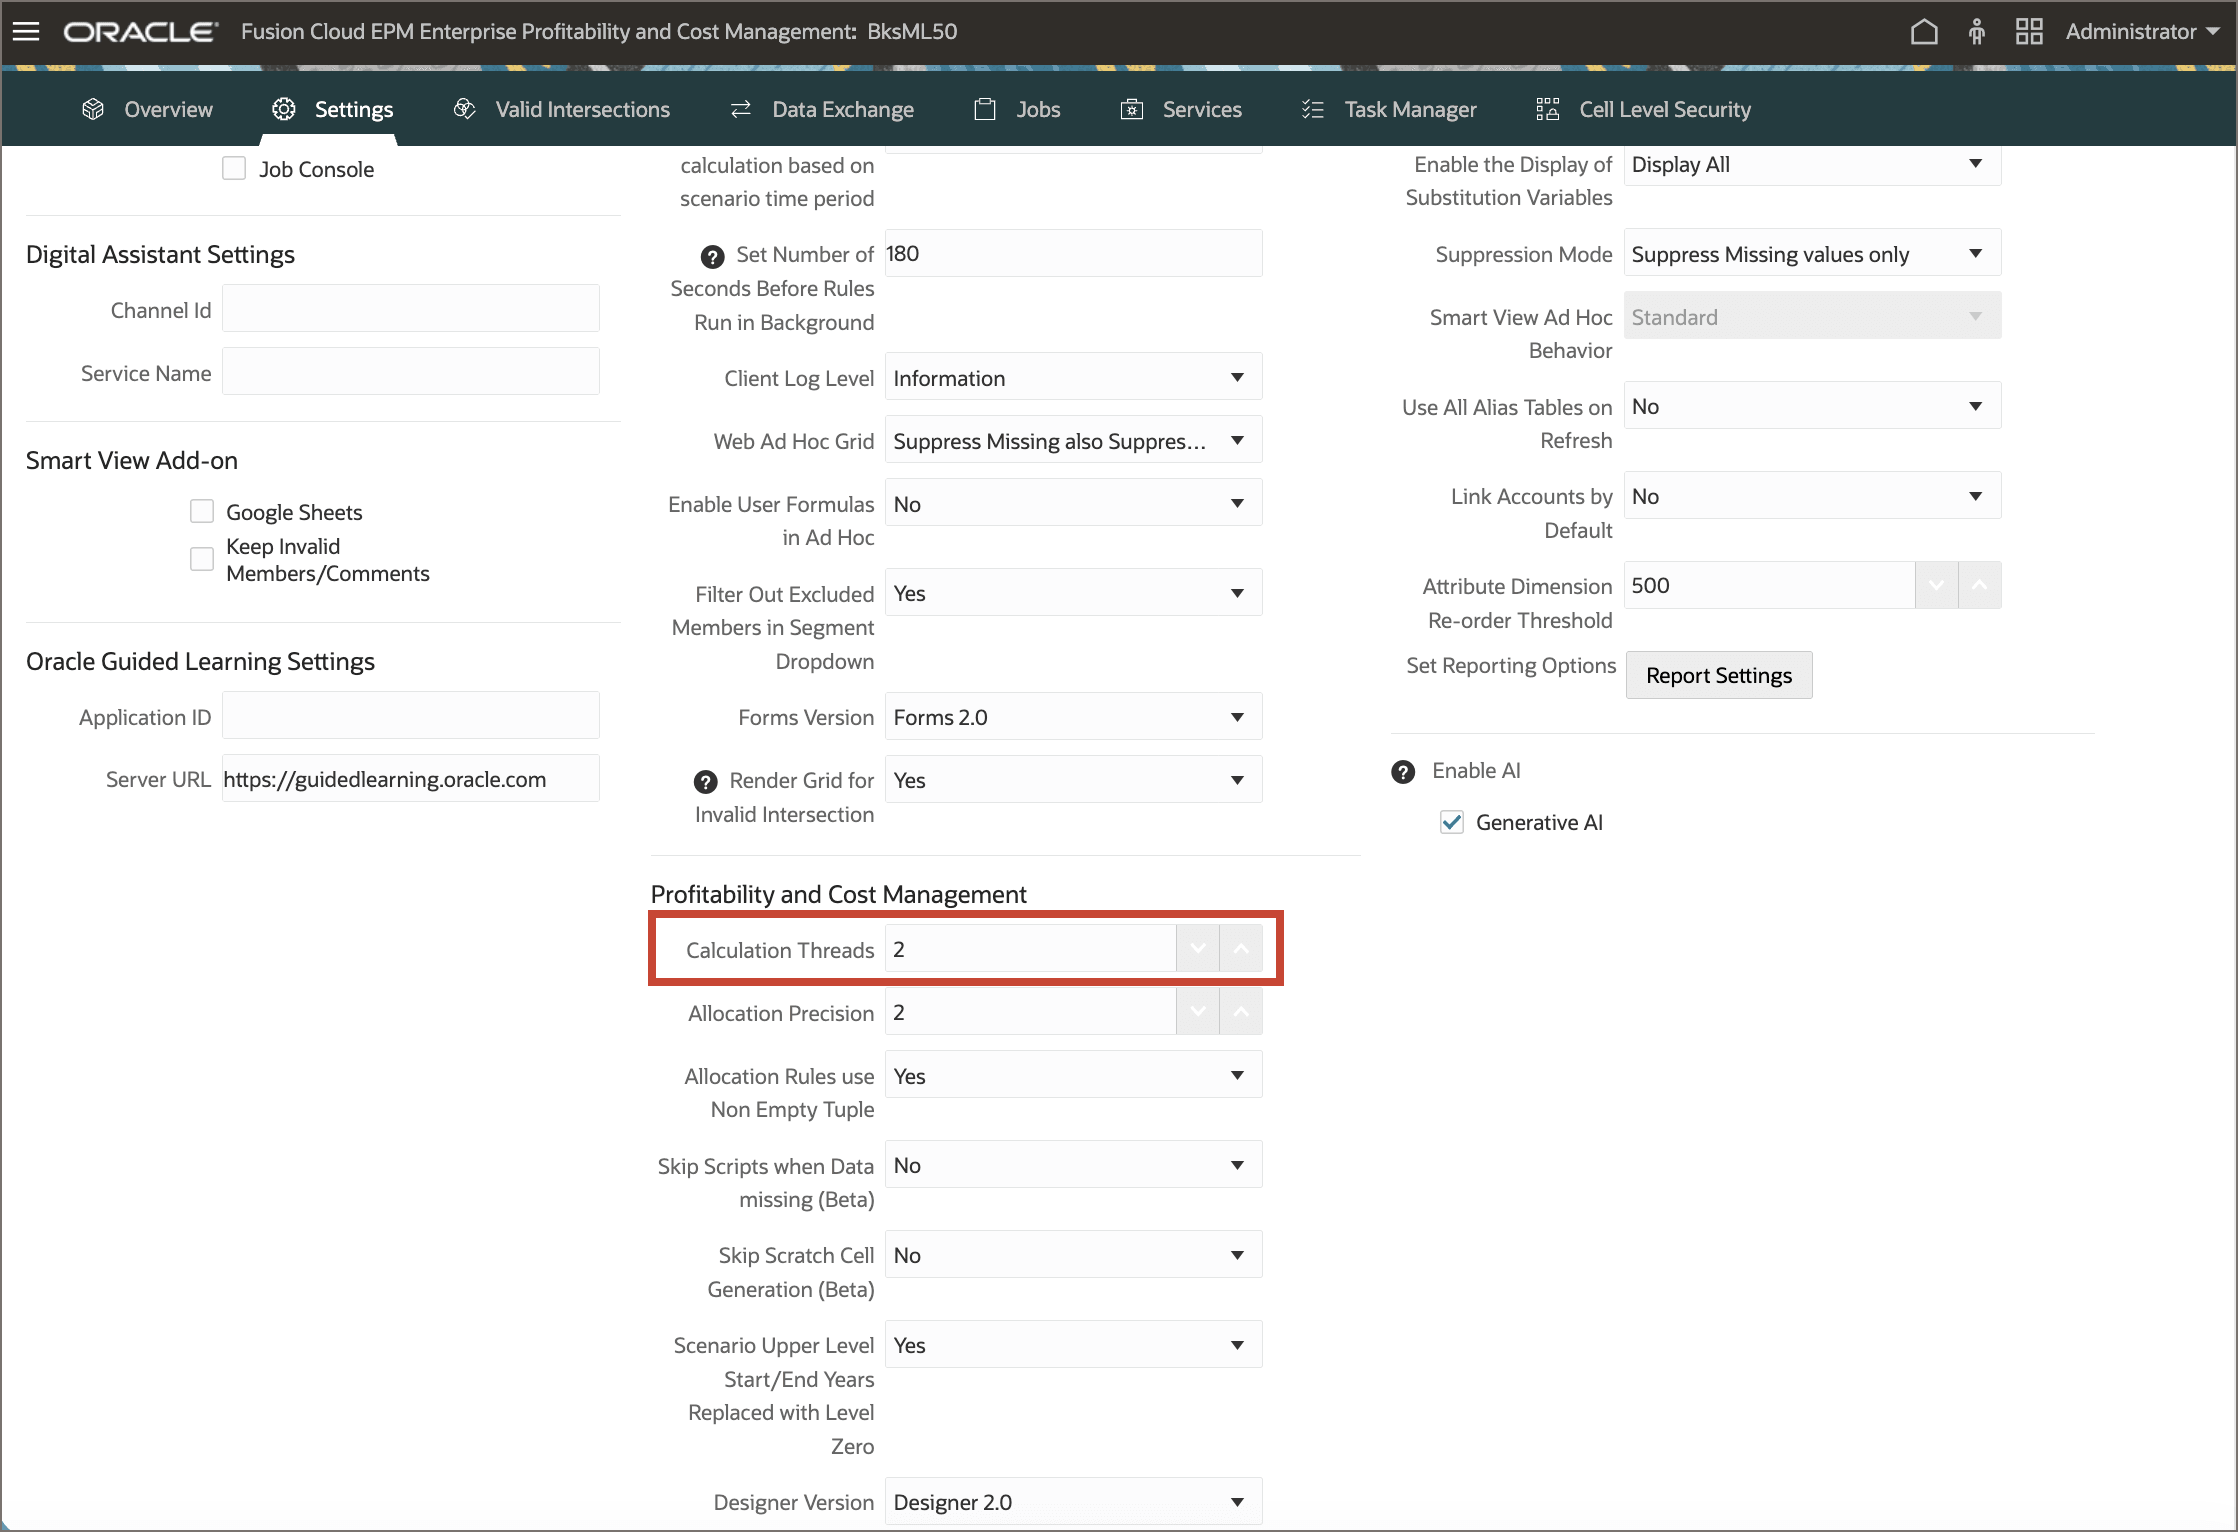
- Scroll down to the Profitability and Cost Management section.
- Change the number of Calculation Threads to 2.
- Scroll back to the top of the page, then click Save. At the confirmation message, click OK.
- Return to the home page.
- Click Modeling, then click Calculation Analysis. Notice that the dynamic tab with the Job Dashboard for job 289 is still active, but the drawer overlay with generative AI recommndations is not displayed.
- Click (Click to view generative AI recommendations) to open the generative AI drawer.
The assistant returns a list of system calculation settings with its assessment of each setting.
For the sample application, the assistant returns the following response:
The assistant's review indicates that some rule sets are configured for parallel calculation, but the system setting for concurrent calculation threads is 1, which is not recommended.
Showing the Top 10 Time Consuming Rules
Listing the ten rules in your model that consume the most calculation time can help you start to zero in on performance problems in your model calculations.
- Click Click for Additional Suggestions, then select Show the Top 10 Time Consuming Rules.
- Click (Send).
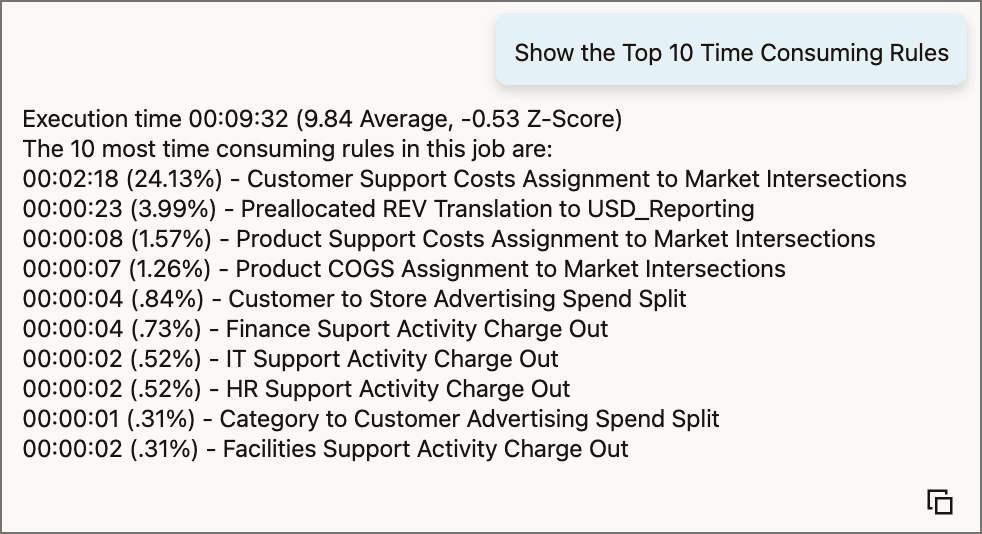
The assistant returns the list of the 10 rules that took the longest to calculate for this calculation job. The list includes the total calculation time, the time for each rule, and the percentage of the total calculation time for each rule.
Comparing the Current Job with Similar Historical Jobs
By comparing the current job to other historical jobs that use the same calculation model and calculation range, you can see how the current job's performance aligns with other calculation jobs. Are the times similar, or is there a large variation between calculation times? With this information, you can determine if the current calculation job deviates significantly from similar calculations.
- Click Click for Additional Suggestions, then select Compare this Job with Similar Historical Jobs.
- Click (Send).
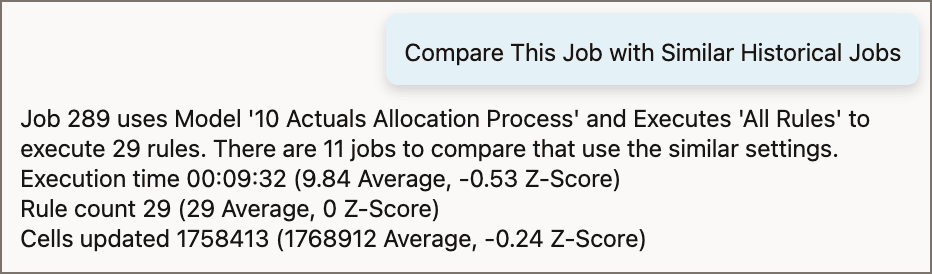
The assistant identifies historical jobs stored on the Calculation Analysis page that used the same model and calculation range as the current job. It calculates averages across the identified jobs for calculation time, rule count, and number of cells updated, and shows the deviation of the current job's statistics from the averages.
Evaluating Rules for Best Practices
The assistant can evaluate any of the top 10 time consuming rules for best design practices, which may help you identify problems with your rule design that are contributing to poor performance.
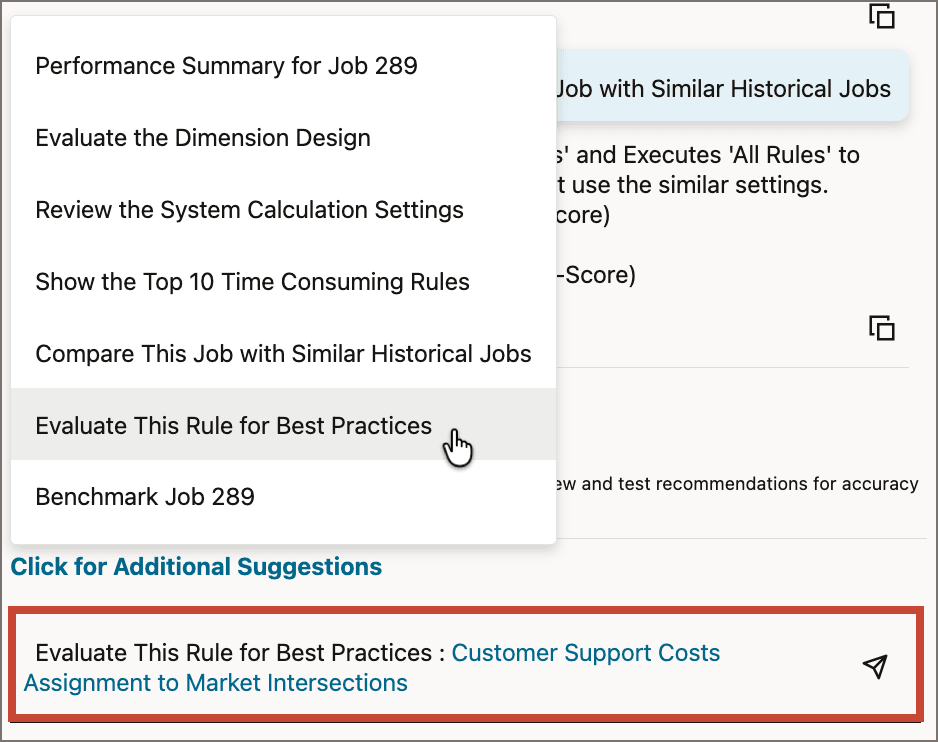
- Click Click for Additional Suggestions, then select Evaluate This Rule for Best Practices.
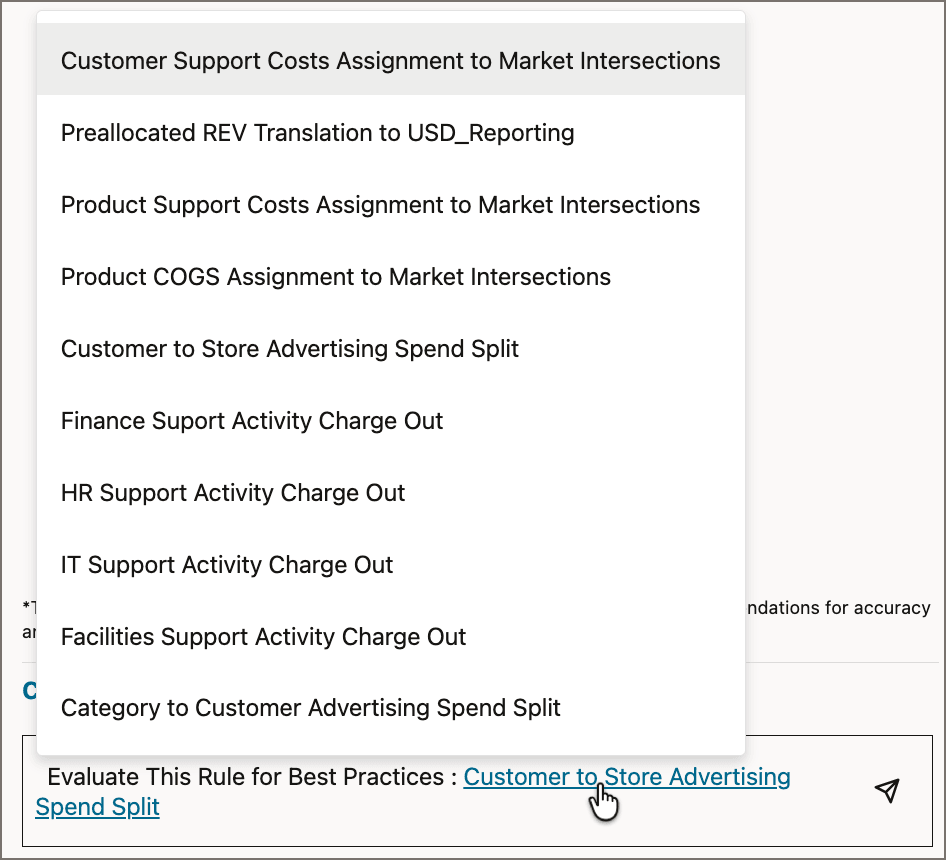
- Click the rule name (for example, Customer Support Costs Assignment to Market Intersections) to display a list of the top 10 time consuming rules.
- Select a rule (for example, Customer to Store Advertising Spend Split).
- Click (Send) to evaluate the selected rule.
The prompt is added to the prompt box, with the most time consuming rule selected by default.
The assistant returns a summary of performance statistics for the selected rule, followed by rule design best practice suggestions. You can use the suggestions to review your rule design for compliance and tune your calculation performance.
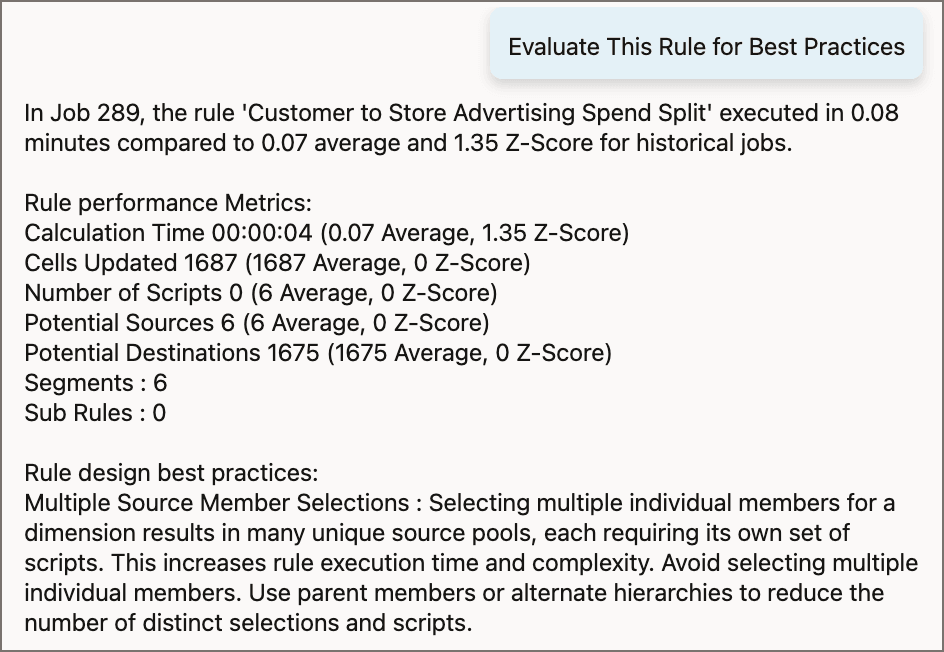
In this example, the assistant identifies that there are multiple source member selections for a dimension in the rule, which can increase rule execution time and complexity. This rule should be reviewed to see if a parent member or an alternate heierarchy can be used to provide a single source member for the dimension while achieving similar allocation results.
Note:
Remember that these summaries are auto-generated using GenAI. Please review and test recommendations for accuracy and performance impacts before deploying to production.Benchmarking the Current Job against Another Job
While comparing the current job to similar historical jobs finds statistical averages across all similar historical jobs, the benchmarking option allows you to compare the current job to just one of those similar historical jobs.
- Click Click for Additional Suggestions, then select Benchmark Job 289 (where the job number is the currently selected job).
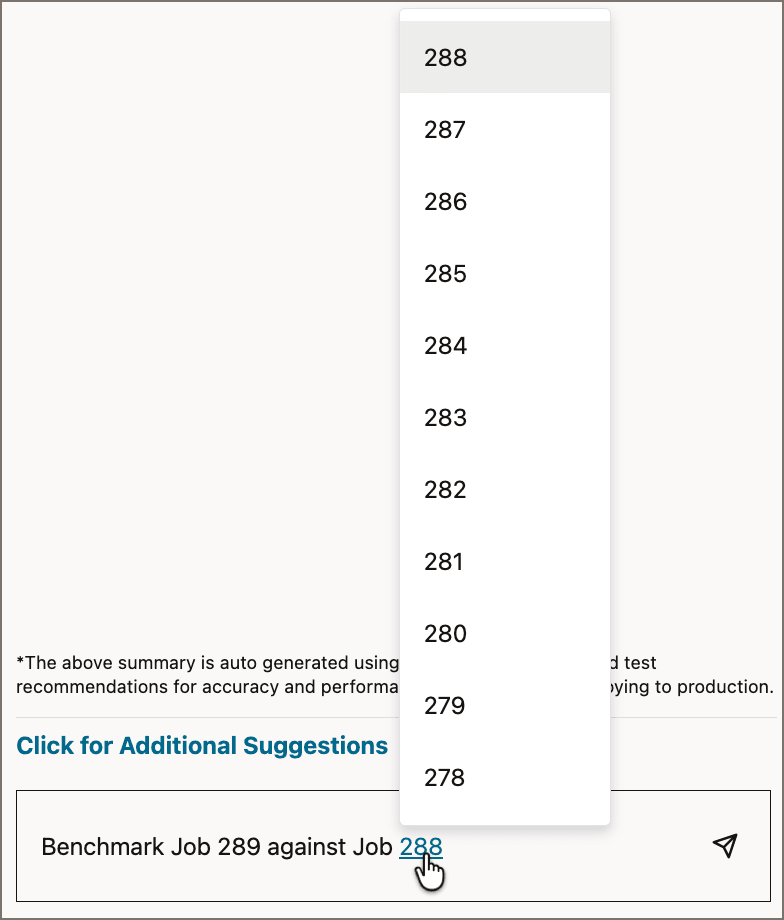
- Click the historical job number (for example, 288) to display a list of other similar historical jobs.
- Select a job to benchmark the current job against (for example, 286).
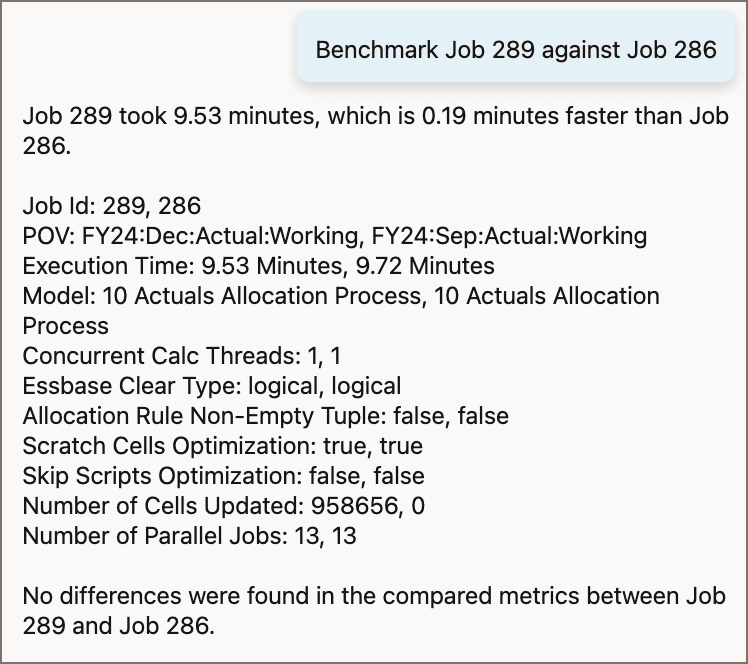
- Click (Send) to benchmark the current job against the selected job.
The prompt is added to the prompt box, along with the most recent similar historical job by default. For example, "Benchmark Job 289 against Job 288".
The assistant returns a comparison of the current calculation job to the selected historical calculation job.
Analyzing the Performance of Multiple Jobs Together
Analyzing the performance of multiple jobs generates a Job Comparison dashboard, which displays a statistical comparison of the selected jobs.
- At the bottom of the page, select the Calculation Analysis tab.
- Select jobs 289, 288, and 287.
- Click Analyze Performance.
- At the top of the dashboard, click All Rules to display the list of rules used in the selected jobs.
- Scroll to the bottom of the list and select Customer to Store Advertising Spend Split.
- Change the rule selection back to All Rules.
- Click Database Details.
- Click All Statistics.
- Click (Click to view Generative AI recommendations) .
The system runs a generative AI analysis on the selected calculation jobs and displays the resulting Job Comparison Dashboard in a new tab:
.png)
The default Performance view shows charts comparing calculation times, number of cells updated, number of rules, number of scripts generated, and number of parallel jobs across the selected calculation jobs. By default, the statistics for all rules are shown. You can view statistics for a specifc rule, view charts with database statistics, and review a comparison of all statistics. You can also access generative AI recommendations for any of the jobs in the comparison.
Let's investigate the Job Comparison dashboard.
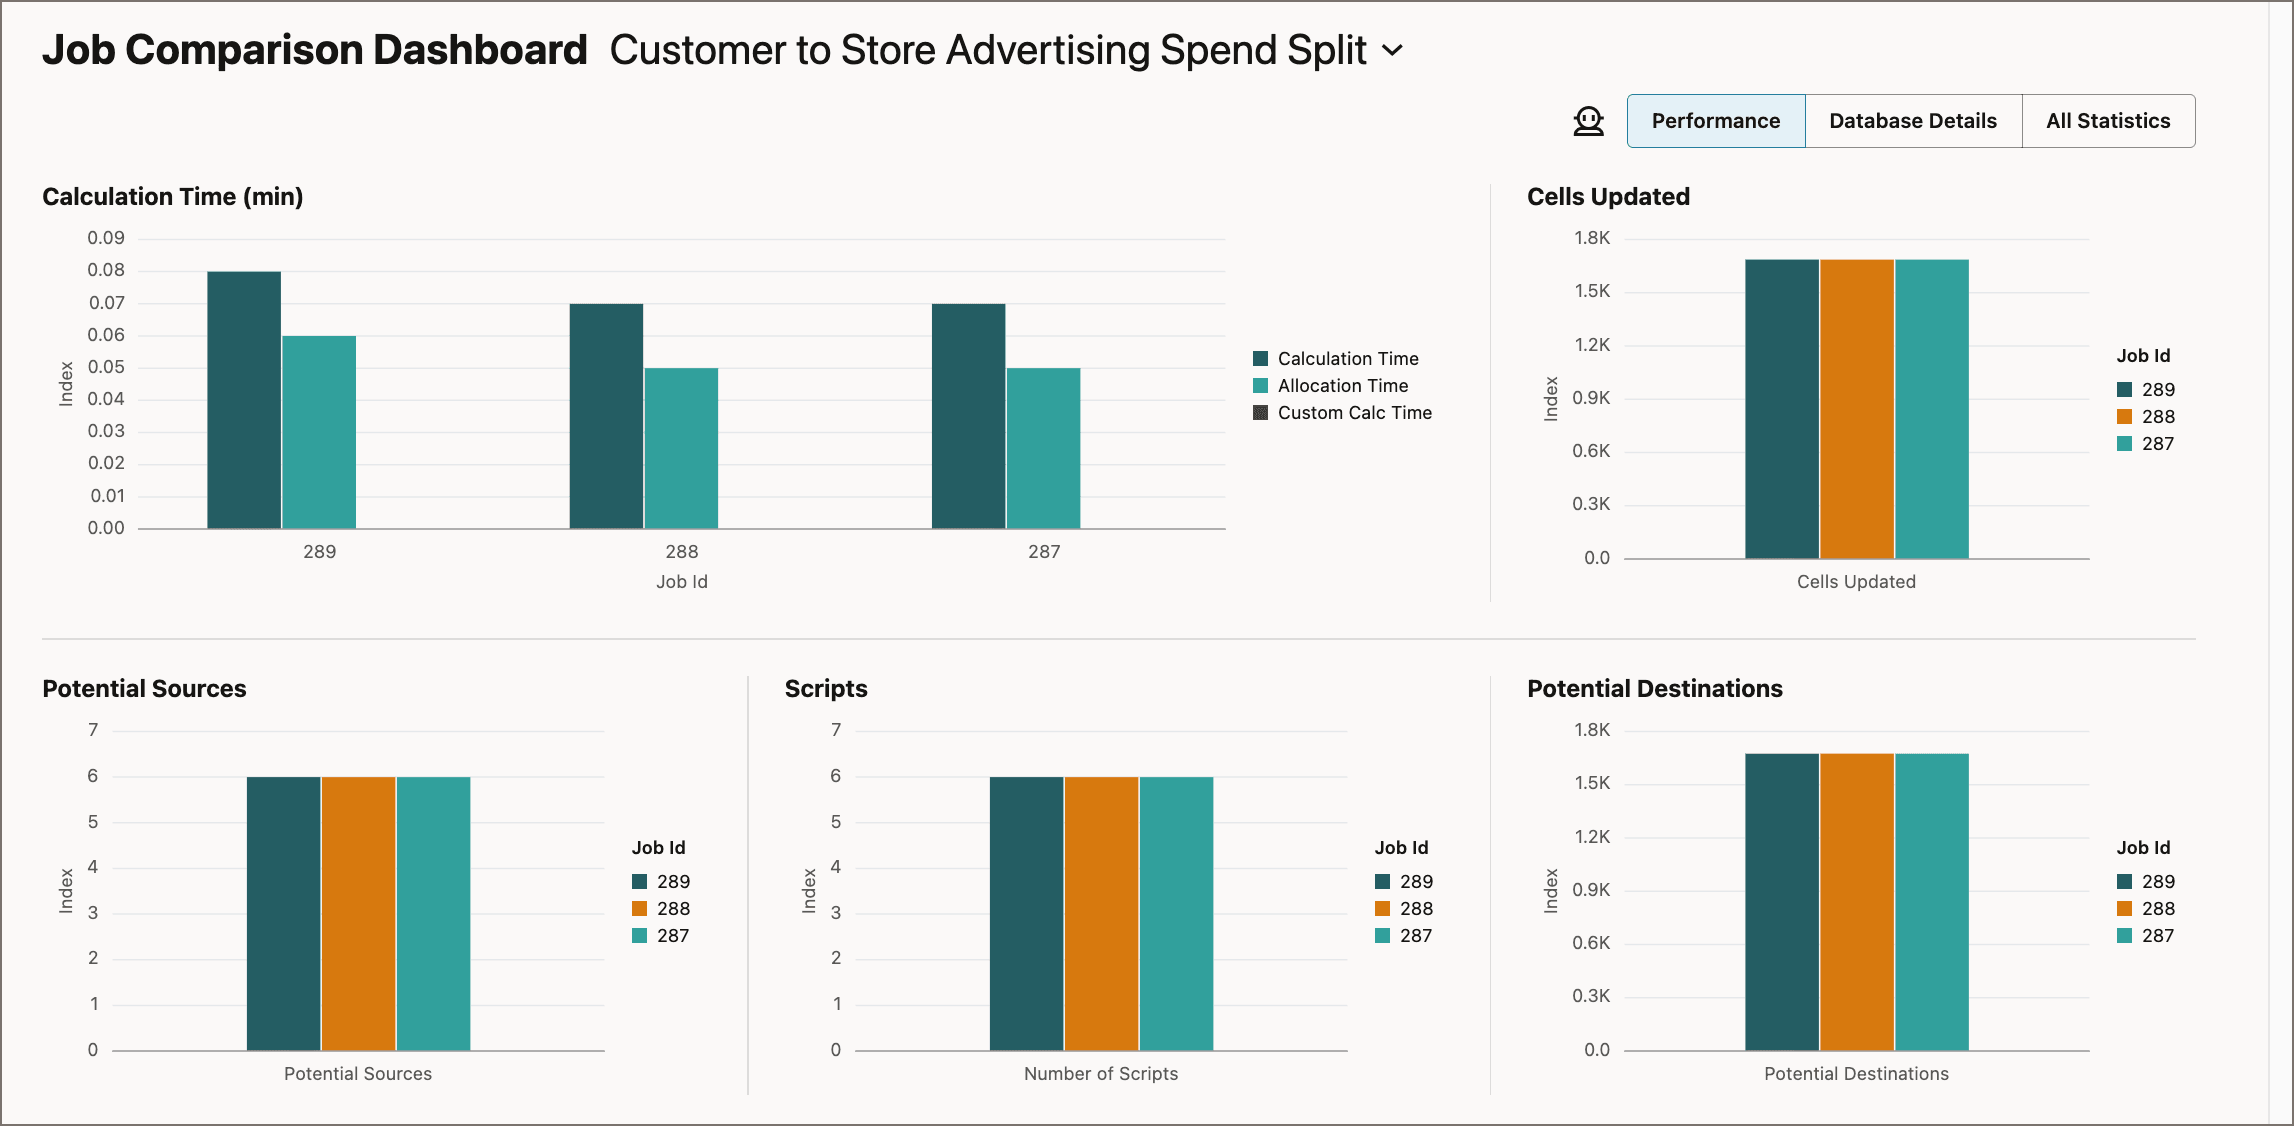
When a single rule is selected, notice that the "Rules" chart is replaced with a chart comparing the number of potential sources for the rule, and the "Number of Parallel Jobs" chart is replaced with a chart comparing the number of potential destinations for the rule.
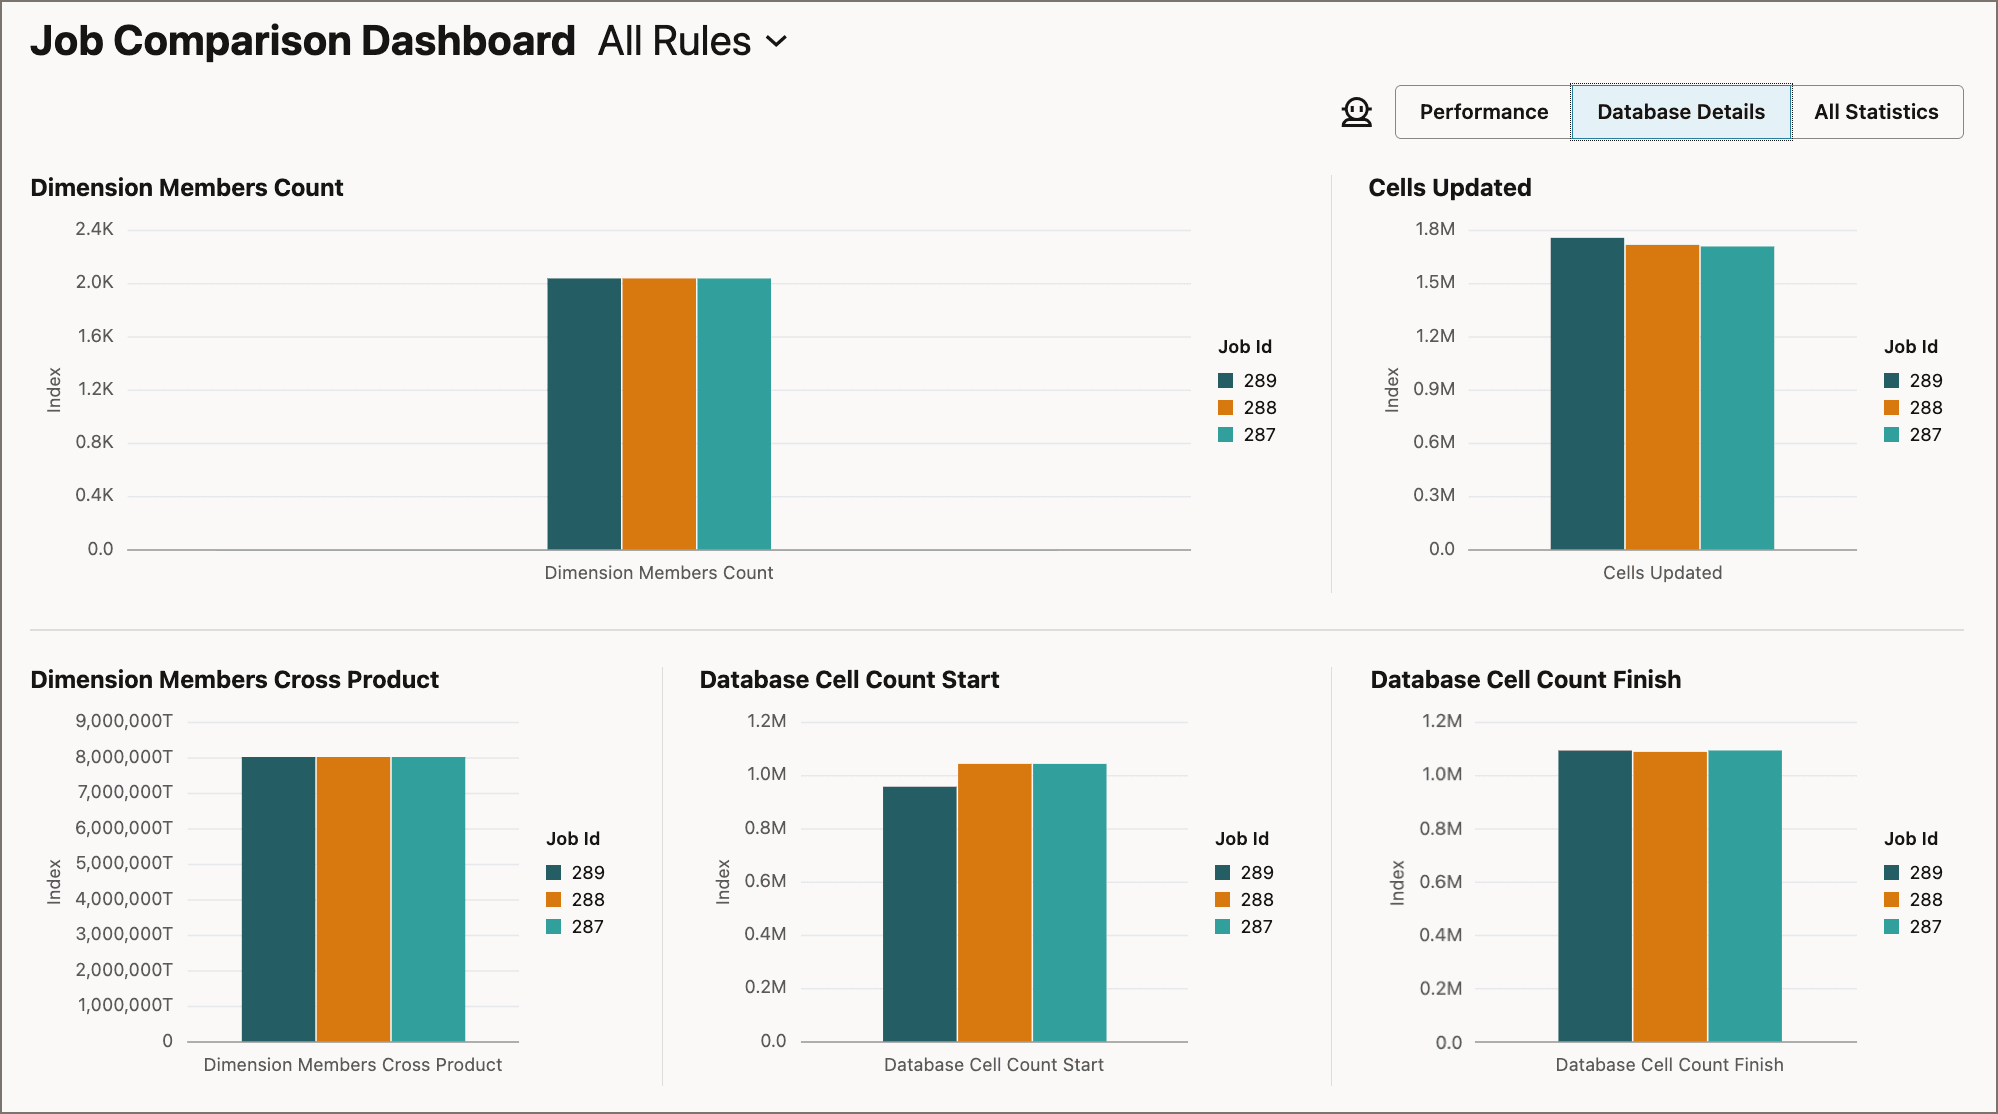
The Database Details view includes charts comparing the dimension members count, the cross product of all dimension members, database cell count at the start of calculation, database cell count at the finish of calculation, and the number of cells updated during calculation.
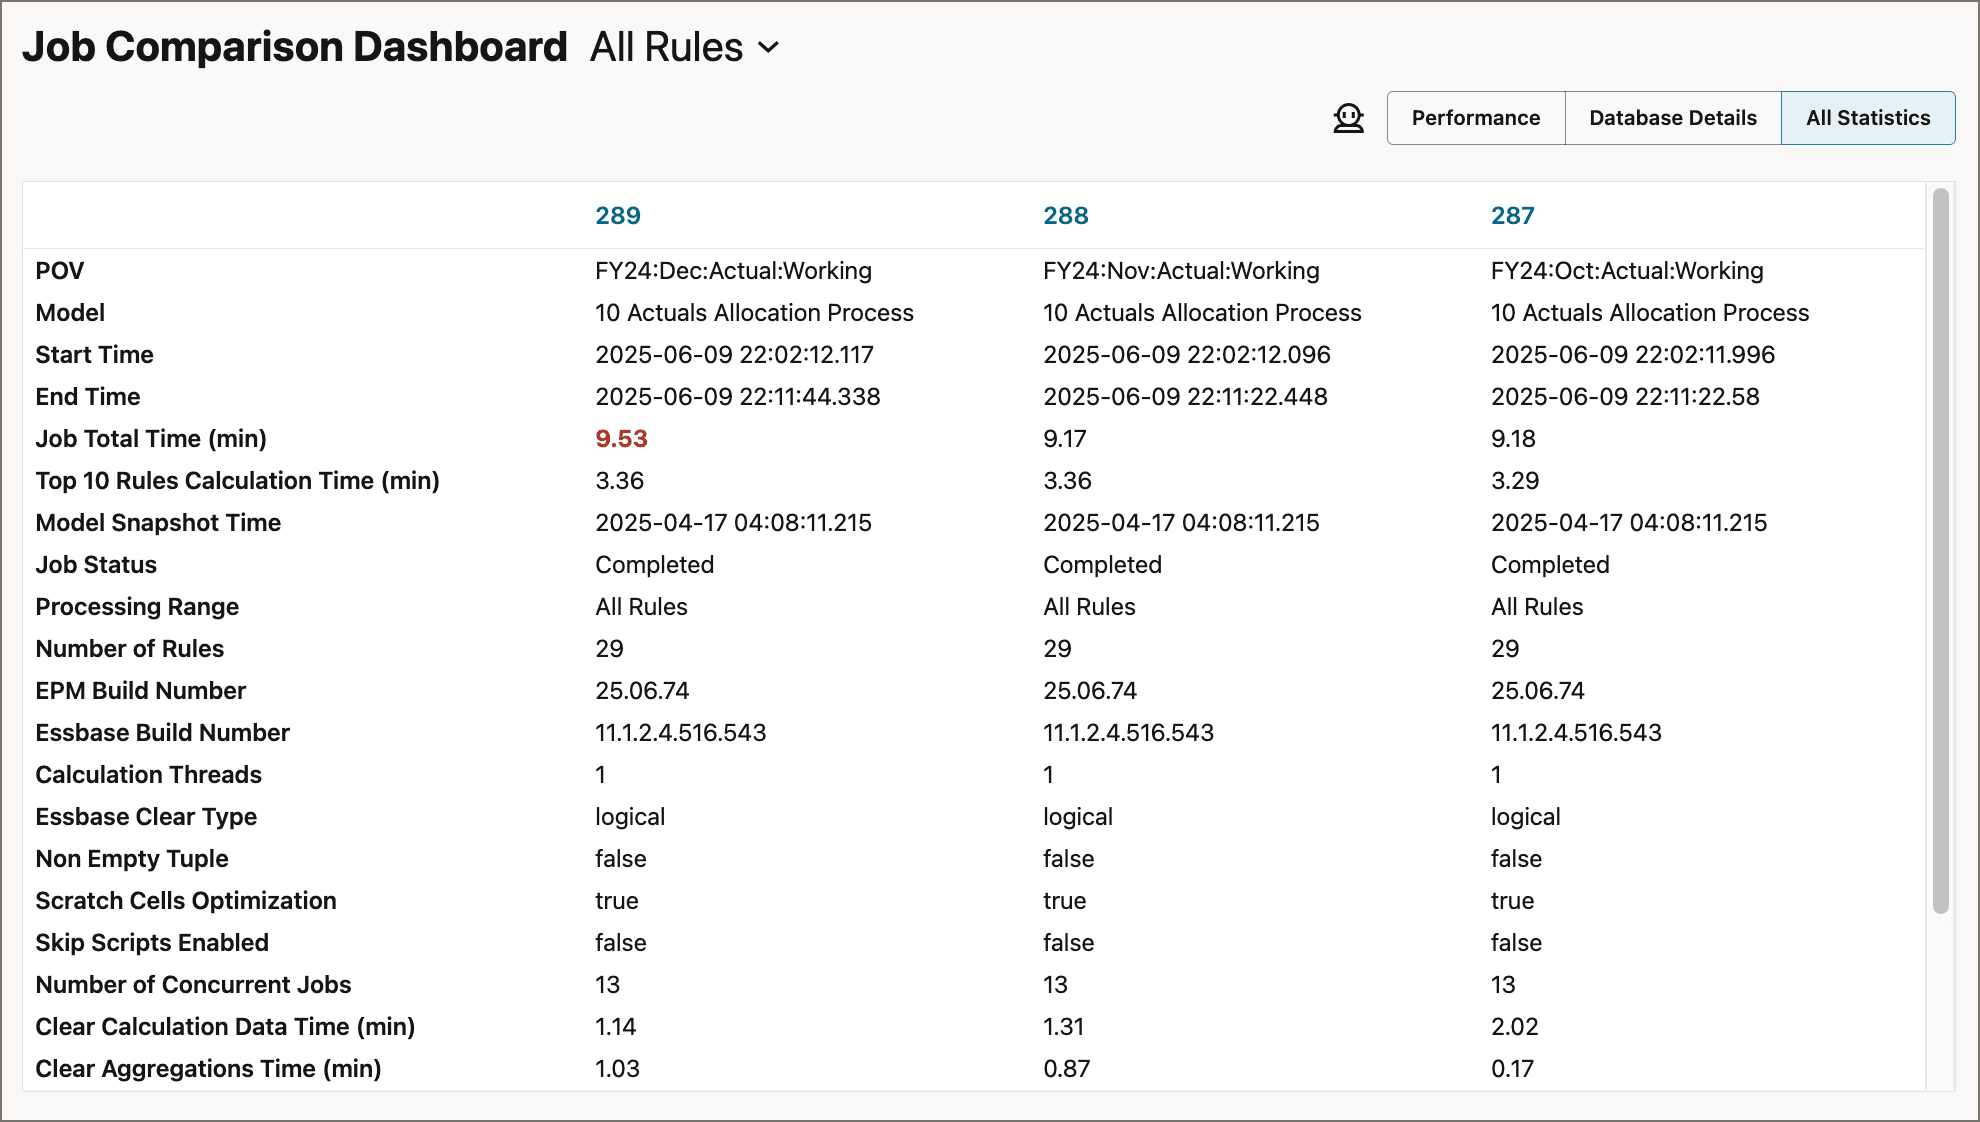
A comparison of all job statistics is displayed, with a separate column for each job. The longest total job time is highlighted in red.
Tip:
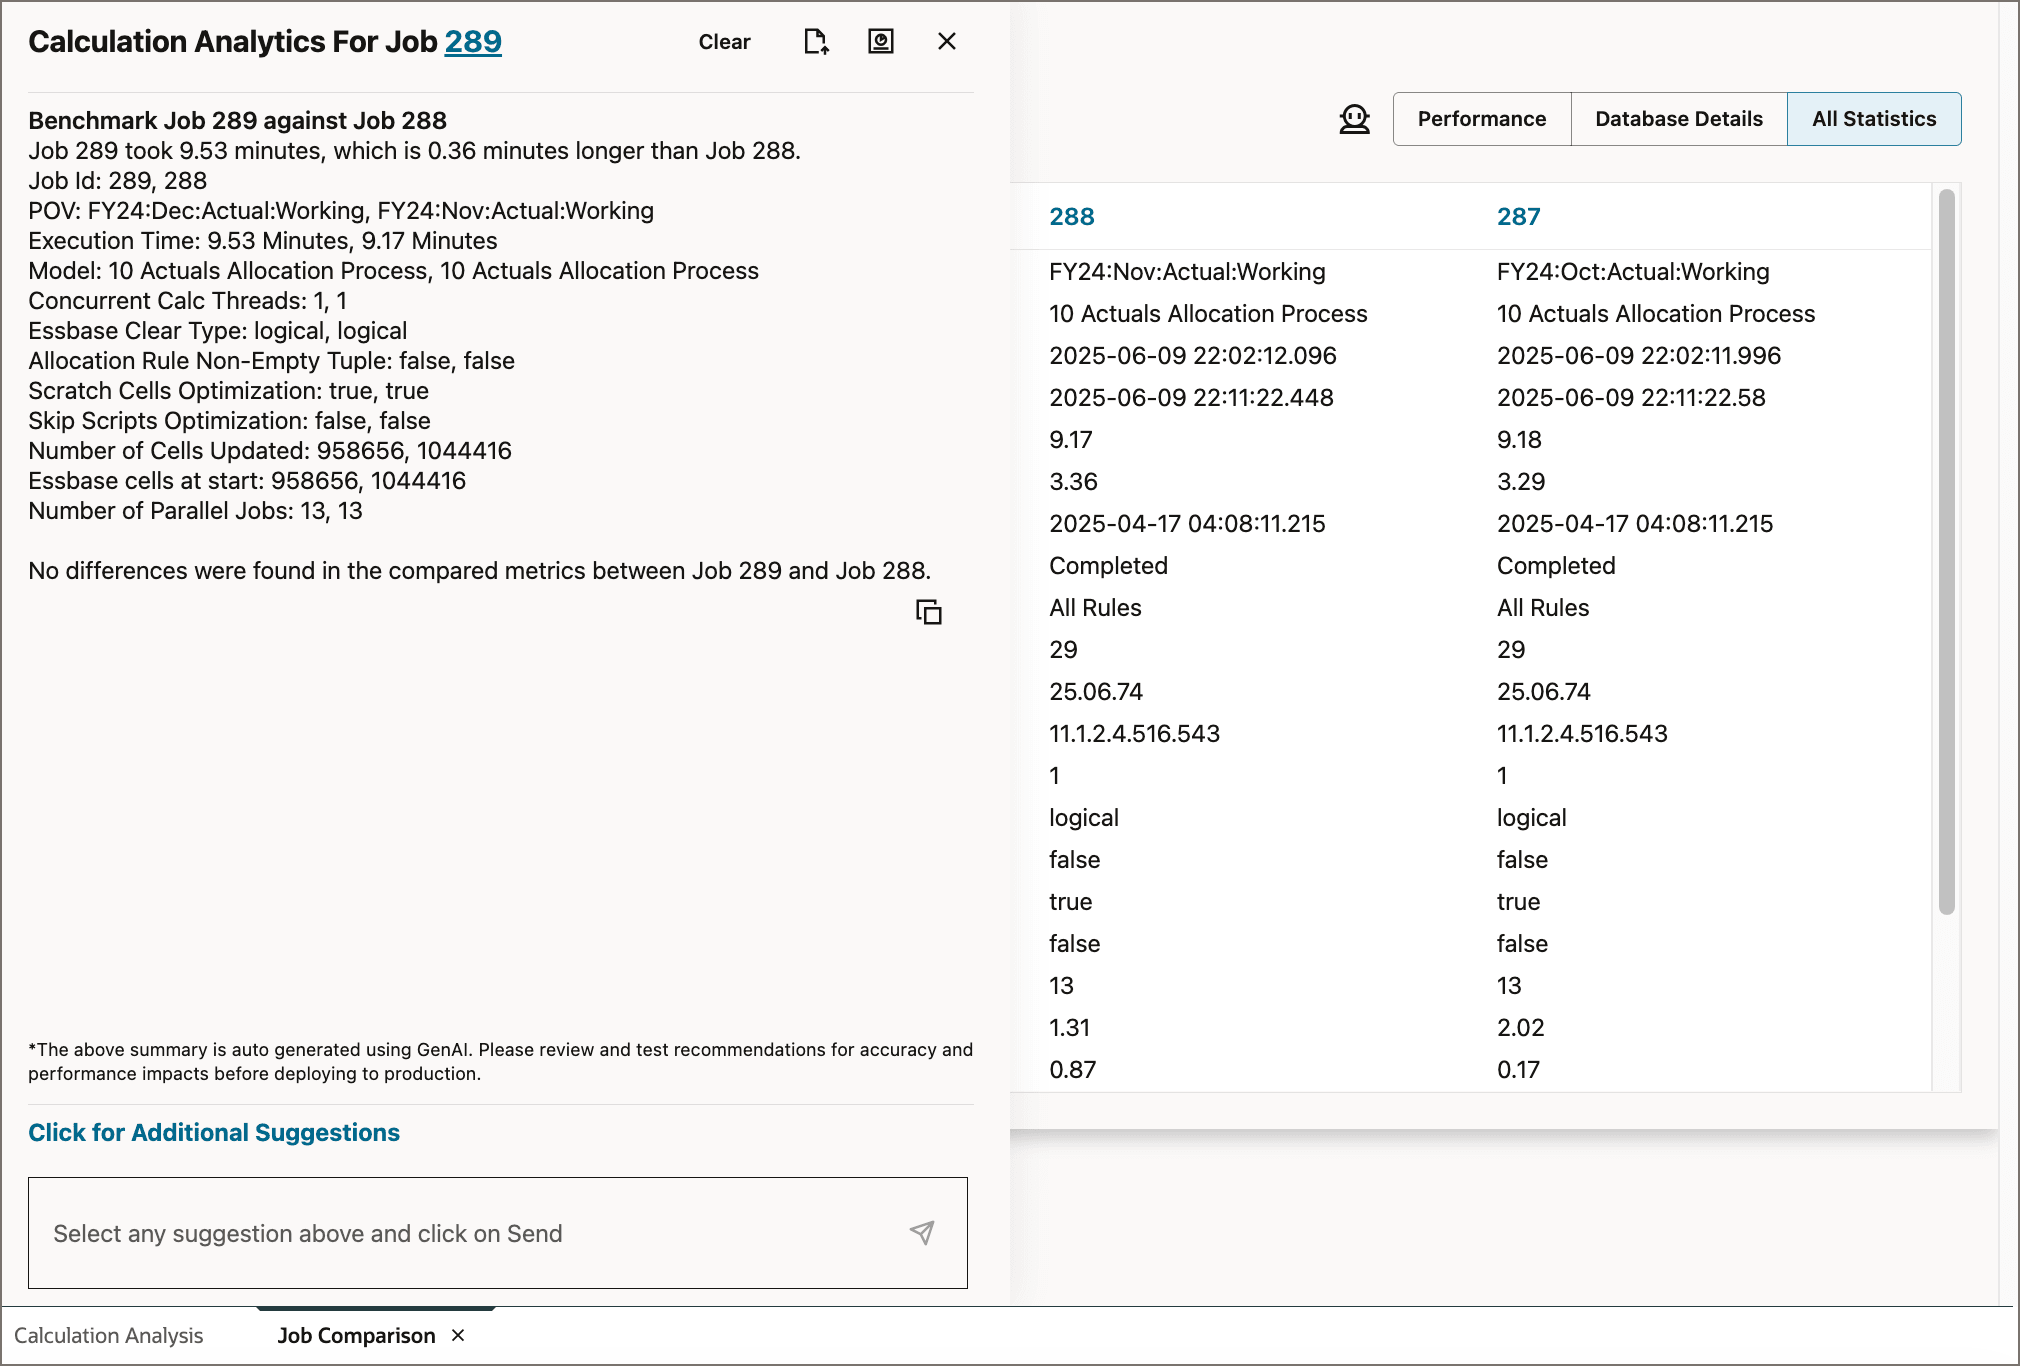
You can click a job number at the top of one of the columns to open a new tab with the Job Dashboard for the selected job.The Calculation Analytics drawer overlay for the first job in the comparison is displayed. You can click the job number in the drawer title to select any of the jobs in the comparison.
Tip:
You can use the Calculation Analytics drawer overlay here to generate the same suggestions as you do when you analyze a single job.Related Links
Additional resources:
More Learning Resources
Explore other labs on docs.oracle.com/learn or access more free learning content on the Oracle Learning YouTube channel. Additionally, visit education.oracle.com/learning-explorer to become an Oracle Learning Explorer.
For product documentation, visit Oracle Help Center.
Analyzing Calculation Job Performance
G51458-01
March, 2026