Designing Data Forms for Profit Curves
When designing a data form for a profit curve, you need a dimension member of the population (for example, customers) and a metric (for example, net income). This generates a profit curve with the corresponding values plotted on it.
You can change the point of view dimensions (Period, Year, Scenario, and Version) in a data form. If required, narrow it down to a product group or some other segmentation to generate multiple profit curves (for example, profit curves for bikes and accessories by region). You can have multiple types of profit curves based on such segmentations.
Note:
For information on creating data forms, see Creating Forms.
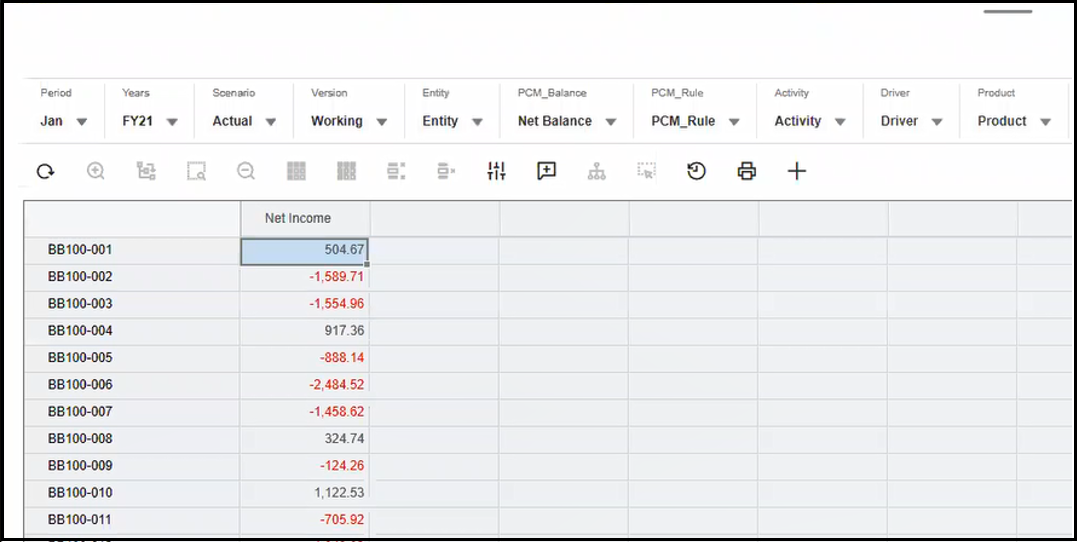
For example, in the data form below, population is the row dimension, and net income is the column dimension.

In this example, the profit curve sorts the data by the net income value with the highest number in the first row (plotted on the leftmost part of the profit curve). Here, the data form generates a calculated column, cumulating the net income values. This cumulative values are the values plotted on the profit curve.
If you sort the net income column with the largest value first, the first cumulated value is same as the Net Income value in the first row. The second row in the cumulated value column is the summation of the first row and the second row of the net income value column. The third row is the first three rows of net income added together and so on.
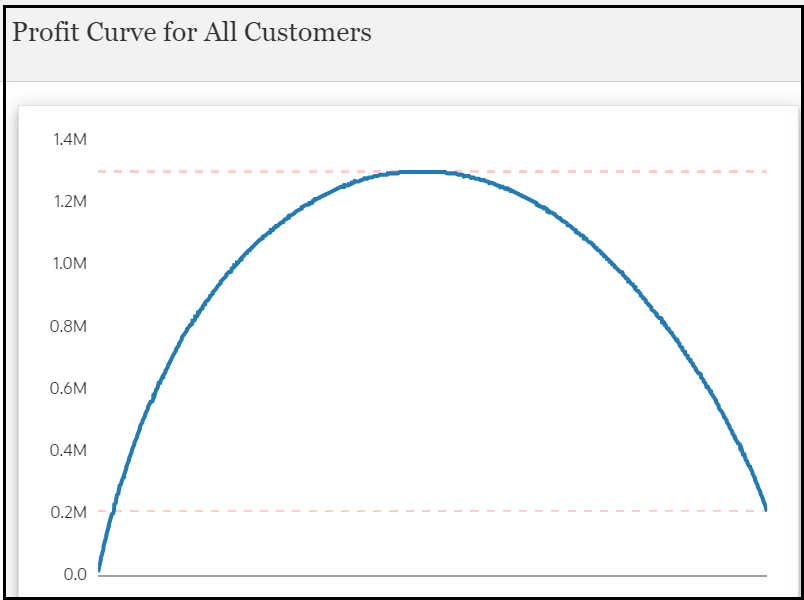
As long as the net income values are positive, the cumulative values will be growing. If you sort it from the largest to smallest, eventually you will be getting negative net income values. So, the cumulative values start decreasing and the curve starts sloping downward.
The following profit curve is generated from the data form above:

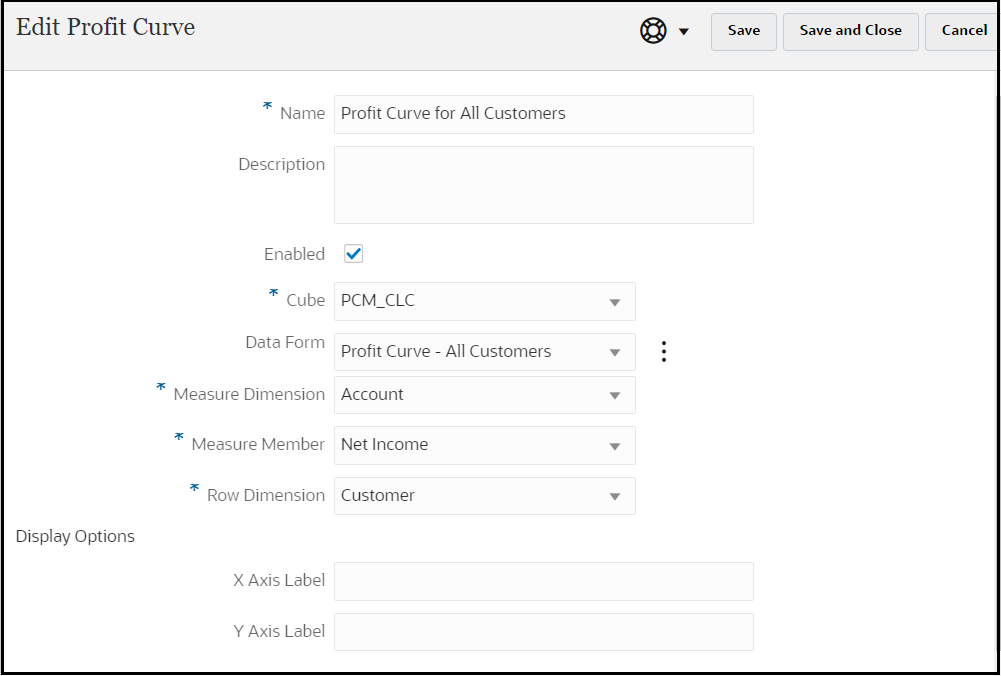
The profit curve above is created with Account selected as the Measure Dimension, Net Income selected as the Measure Member, and Customer selected as the Row Dimension.

Tip:
As a best practice, it is recommended to design your data form as simple as possible.