Manage Working Time Plans on Available Capacity Page

Working Time is the period of time that a resource spends performing activities and tasks. You can use the Planned Capacity editor in Available Capacity screen to view and manage working time plans of resources for capacity areas and organization units on a day level.

Before you start

The editor displays either on the Resources or Capacity column based on the option selected from the Working time unit drop-down list on Quota Configuration page.
As a quota or capacity manager, you can perform the following actions:
  • Enter the capacity plan either on resource basis (in resource units) or on capacity basis (in man-hours, days, minutes) to cater to the business needs.

  • View previously entered plans for capacity area.

Note: The users who have access to the Available Capacity page can view and edit the working time plans.

To add, edit, or view working time plans:

Here's what to do

  1. Select Quota.
  2. Select a capacity area from the left-hand pane.
  3. Select the Available Capacity icon.
    The Available Capacity page displays.
  4. Click on the value that is displayed on the Capacity or the Resources column for the capacity area.
    The Planned Capacity editor displays an empty field for the capacity area and for each organization unit within the capacity area.

    Indicates the Capacity Editor of the Capacity column.

    Also, these columns are displayed for both Capacity and Resources column:

    • Available: Represents the available capacity for the capacity area and its organization units.

    • Planned: Represents the working time plans that is defined for the capacity area and its organization units. You can enter or edit the values (must be whole numbers within the range of 0 to 65535) and the difference between planned and available capacity is recalculated automatically. When you click Save planned values , only the value of the Variance column for the capacity area is displayed on the Capacity or Resources column.

    • Variance: Represents the difference between the values of the Available and Planned columns.

    For example, assume that the available capacity for a capacity area in the Available column is set as 853 hours. You estimate 850 hours for the capacity area and enter the planned value as 850 in the Planned column. Since the available capacity for the capacity area is more than the planned value, the Variance column displays +3 in orange color which means there is enough capacity available. If the planned value is entered as 856 hours, then the Variance column displays –3 in orange color which means there is not enough capacity available. If the values in the planned and available capacity are the same, then 0 is displayed in the Variance column.

    Also, the above logic applies for all the organization units within the capacity area. If the planned and the available capacity are the same, then a green check mark Displays when planned and available capacity are same. is displayed on the Capacity column.

    Similarly, assume that the available capacity for a capacity area in the Resources column is set as 97. You estimate 96 resources for the capacity area and enter the planned value as 96 in the Planned column. Since the available resources for the capacity area is more than the planned value, the Variance column displays +1 in orange color which means there are enough resources for the capacity area. If a negative value displays in the Variance column then it means that there are not enough resources for the capacity area.

    Also, the above logic applies for all the organization units within the capacity area. If the planned and the available capacity are the same, then a green check mark is displayed in the Resources column.

    Note: The organization units within the capacity area are displayed as a plain list rather than a tree structure. Also, if you have opted for temporary assigned resources using the Use resources outside the capacity area check box, then the number of resources that are temporarily assigned to a capacity area is displayed on the editor.
  5. Select a previous date to view the previously entered plans for the capacity area.
    Note: The planned capacity editor has the same functionality if you select multiple days.

Example 1:

The difference between the planned values for the capacity area and its organization units are displayed on the bottom of the editor. For example, consider the following scenario:
  • The available capacity for the capacity area is 853 hours and you enter a value as 852 hours. The Variance column displays +1.

  • The available capacity for the organizations units, for example, Organization A and Organization B is 351 and 279 hours respectively and you enter values of 350 and 278 hours respectively. The Variance column displays +1 for both the organization units.

However, a message “The difference between plans for capacity area and its Organization Units is -1” displays on the editor which means that there is not enough planned capacity for the organization units.

Example 2:

The difference between the planned values for the capacity area and its organization units are displayed on the bottom of the editor. For example, consider the following scenario:
  • The available capacity for the capacity area is 97 resources and you enter a value as 96. The Variance column displays +1.

  • The available capacity for the organizations units, for example, Organization A and Organization B is 75 and 65 resources respectively and you enter values of 74 and 64 respectively. The Variance column displays +1 for both the organization units.
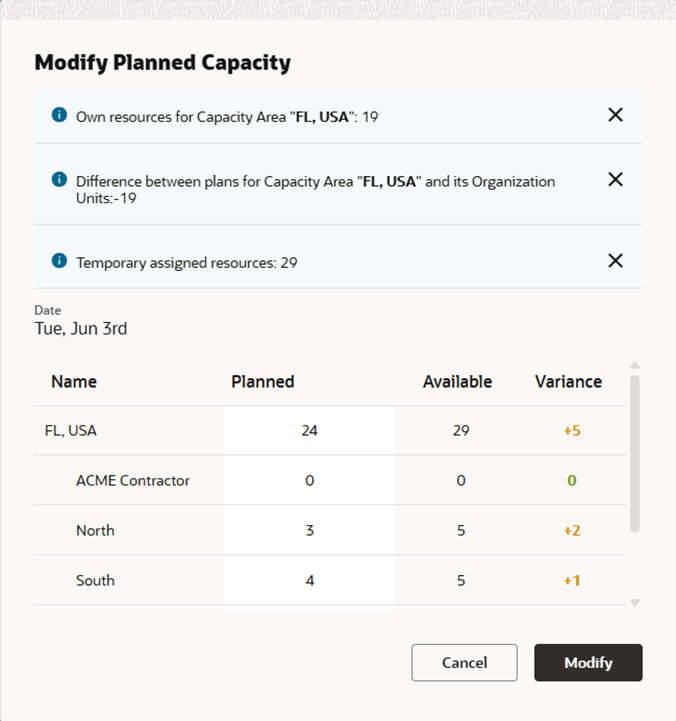
However, a message “The difference between plans for capacity area and its Organization Units is -1” displays on the editor which means that there are not enough planned resources for the organization units.