Forecasting Tables
You can display forecasting, plan and capacity data in the table-view mode.
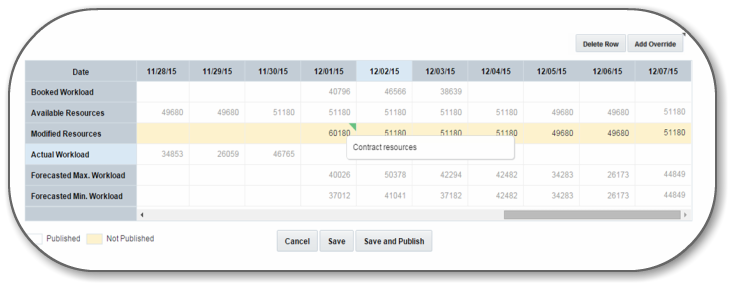
You can view Actual Workload, Forecasted Workload, Plan and Available Resources data in the table view mode below the chart view. The table and chart views show the same data. However, in the table view you have the Add Overrides option, that lets you add overrides to the future data. Published data is shown in a white background and the non-published data, which is not visible to other users, is shown in a yellow background. You can identify the cells that have comments easily, as they are highlighted with a green triangle. The green triangle and the comment appear when you hover over the cell.
This screenshot shows the table view of forecasting plan and capacity
details: