Concepts in Designing Dashboards
Helpful information as you design dashboards:
- On the left is the design palette. Simply drag and drop objects from the palette to the canvas.
Tip:
Drag an object to a border line. The drag icon changes to a plus sign when you can drop the object in an allowed space. See About Your Dashboard's Layout.
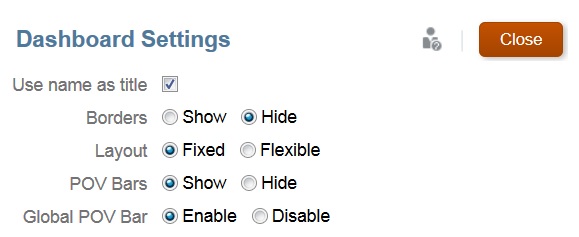
- On the top right are settings for the entire dashboard:

- Use Settings
 to set these aspects of the dashboard:

Note:
When a new dashboard is created, the borders are hidden by default. To show borders in newly created dashboards, you must change the borders setting to Show.
For more information about POVs, see About Global and Local POVs.
- At the top right of each object is a toolbar for that object that displays when you hover over it:

- As you create a dashboard, click Runtime
 so that you can immediately see how the dashboard looks and works to a dashboard user. To return to designer mode to continue designing the dashboard, click Designer.