The Power of Dashboards
Dashboards typically provide an overview by showing summary data. The versatility of
dashboards enables you to chart, evaluate, highlight, comment on, and even change key
business data. For example, you can change a driver such as Volume in a form that is in
a dashboard and immediately see its impact in other forms and charts:
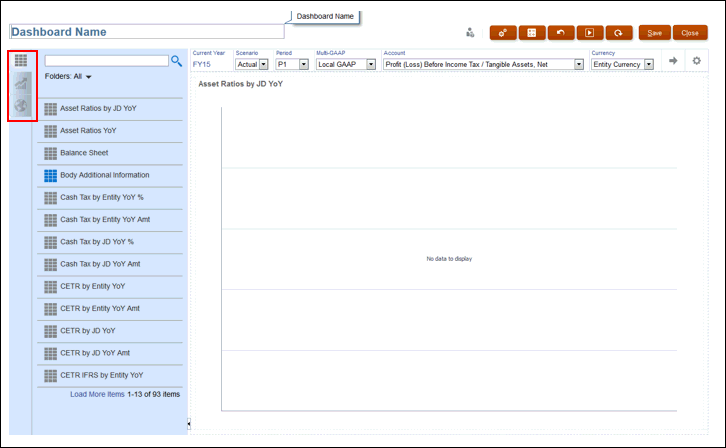
You create dashboards by simply dragging and dropping a variety of objects from the design pallet to the dashboard canvas.
With dashboards, you can:
- Include up to six forms that dynamically update, including their associated charts, as you change data in the form.
- Include up to nine charts or tiles. Tiles display a specific value from the cube. To provide the value for each tile, you can specify a form or a cell intersection as a data source.
- Switch between using the design pallet and runtime mode, so you can see exactly what the dashboard user will see.
- Depict data interactively with a wide variety of chart types such as area, bar, bubble, column, combination bar and line, doughnut, funnel, gauge, scatter, radar, and so on.
- Add links to dynamically display external Web pages.
- Finely control the dashboard’s layout. For example, two forms can consume the top half of a dashboard and three charts can each consume 33% of the bottom half.
- Depending on the form design, enable users to drill down into underlying detail and select which members to work with.
- Include user variables in the global POV bar and the local POV.
- Include explanations of data called Commentary in the dashboard.
- In certain charts:
- Customize the colors and line width.
- Show gridlines. (The default is to hide gridlines.)
When users use a dashboard (referred to as runtime), they can set many aspects of the object, such as the type of chart displayed, the dashboard’s title, and so on. A toolbar is available for each object type. Dashboard users can change and save data, run rules, and so on. However, changes made in runtime to the chart type options aren't saved for the next session. Clicking Save in runtime saves the data, but not the dashboard definition.
Administrators create, redesign, delete, and assign permissions to dashboards.
Related Topics: