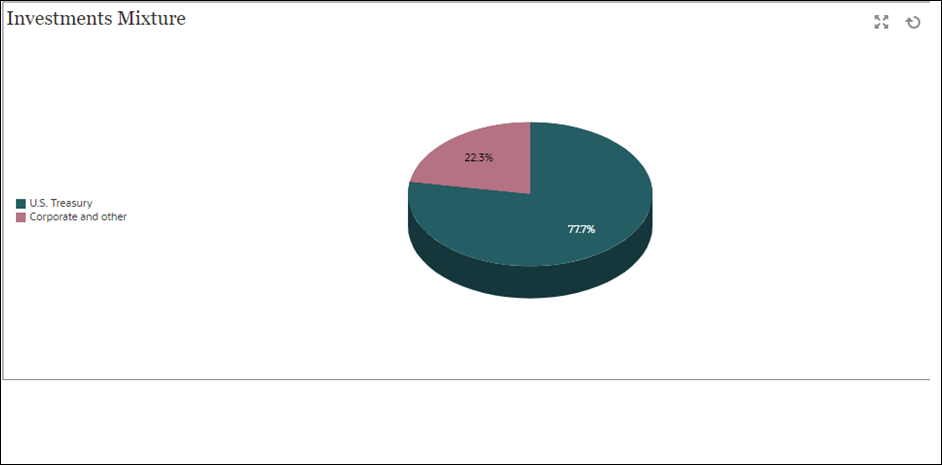
Chart View: Investments Mixture
In the following example, Supplemental data is being used to gather details on different types of debt instruments. The following pie chart shows the allocation of these debt instruments.

Within the dashboard, top left view:
- Click the Object Type icon and select Supplemental Data > Investment Details (Collection).
- Click the View Selector icon and select Chart View.
- Click the Settings icon and specify the following:
- On the Properties tab:
-
Title: Investments Mixture
- Type: Pie
- 3D Chart: Select this option
- Background: No fill
-
Display as Percentage: Select this option.
- Period: Selection
-
- On the Layout tab:
- X-Axis:
- Type: None
- Attribute 1: Entity
- Sort: Alphabetically from the first drop-down menu and Descending from the second drop-down menu
- Legend (Series):
-
Value: Market Value
- Aggregation: Sum
- Categories: Security Type
-
- X-Axis:
- On the Legend tab:
- Legend Position: Left
- Palette: Redwood
- Select the default labels for each series
- Select the default colors for each series.
- On the Properties tab:
- Click OK.