Account Groups
Account groups are easy-to-use reporting components that save queries on account balances that require regular monitoring.
With account groups, you define tolerance rules to create self-monitoring accounts. Tolerance rules are set using criteria that compare two balances. The comparison looks for an increase or decrease that's above or below a percentage or constant amount threshold. When the criteria are met, the balance information for the specified account displays on the Account Monitor section of the General Accounting dashboard, General Accounting infolets, and the Financial Reporting Center. Use account groups to eliminate surprises of account anomalies during your close process.
With account groups you can:
-
Automatically monitor key accounts in real time on an exception or permanent basis.
-
Review both current and comparative balances, including comparisons with your budgets or the actual performance for the same period last year, and across different periods, such as PTD, QTD, YTD.
-
Analyze change percentages based on your defined rules and thresholds to assess whether your balance variances are favorable or unfavorable.
-
Arrange accounts to be monitored on a regular basis into different account groups to meet your business requirements.
-
Share account groups with other users or across ledgers.
-
View all account groups from the Account Monitor section on the General Accounting dashboard. Click View > Account Group > Manage.
Best practice is to have the same chart of accounts across ledgers. Then you can potentially use the same account group across your ledgers as account groups are chart of accounts driven. If you don't want to use an account for all ledgers, add the specific ledger to each account group row. If you enable the Dynamically derive ledger option when setting up the account group:
-
The ledger is derived based on your given data access set selection. If the data access set has multiple ledgers, the default ledger for that data access set is used as the default initially, but you can choose another ledger that's available for that data access set.
-
The ledger column in the account group row isn't displayed.
Viewing Account Groups in the General Accounting Infolets
With the General Accounting infolets you can display the account group results for revenue, expense, and allocation information. Before the account group-based infolets are set up, a link appears on the infolet that's used to open the setup page. For example, the link that appears on the Expenses infolet says: Set up Expense Accounts.
Account groups for the Revenues and Expenses infolets can be automatically generated by the Rapid Implementation process. You can also submit the Generate Financial Reports and Account Groups process to automatically create account groups for the Revenues and Expenses infolets.
The infolet names are derived from the account group names. You can override the name for your infolet by selecting Edit Title and Views on the Actions menu. You can give each account group row a short name that's displayed in infolet details.
The signage display options are applied to the Account Monitor display. You can define the signage options by clicking your user name, the Set Preferences link, and the General Ledger Preferences link. For infolets, the signage is already set to show:
-
Revenue amounts as a positive for credit balances.
-
Expense amounts as a positive for debit balances.
Close Calendar Infolet
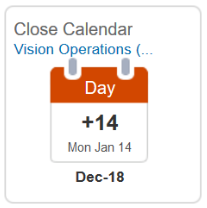
The Close Calendar infolet shows how many days there are before or after the accounting period close date. A negative value represents the number of days remaining to the end of the accounting period. A positive value represents the number of days past the end of the accounting period. The ledger and accounting period for this infolet apply to all infolets on the General Accounting Infolets dashboard.
The default ledger is your primary ledger. The default accounting period is the current accounting period, unless the prior period is open. When the prior period is still open and the current system date falls within the first half of the current accounting period, the prior period displays in the infolet.
For example, you have the following setup:
-
Current system date is January 14, 2019.
-
Date range for the Jan-19 accounting period is January 1 to January 31.
-
Prior accounting period Dec-18 is open.
In this example, the default accounting period that displays in the infolet is Dec-18 and the number of days is + 14.
When the prior period is still open and the current system date falls within the last half of the current accounting period, the current period displays in the infolet. For example, you have the same setup, except the current system date is January 17, 2019. In this case, the default accounting period that displays in the infolet is Jan-19.
The following image shows an example of the Close Calendar infolet. The infolet displays the default primary ledger, current accounting period, current date, and a positive value, which indicates the number of days past the end of the previous accounting period.
You can change the ledger, or specify an override for the accounting period assigned by the application, from the Setting and Actions menu for your user name. Click the Set Preferences link and then click the General Ledger Preferences link.
Revenues Infolet
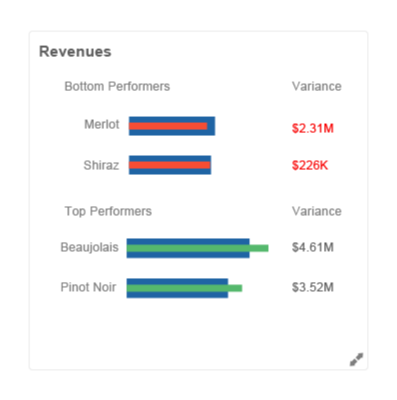
The default view for the Revenues infolet shows the top two and bottom two performing accounts. The performance is measured by the variance between the current period result, and a budgeted amount or a prior period result.
The following figure shows an example of the Revenues infolet with bottom and top performers along with their variance amounts from the target.
You can expand the infolet to view more information. The expanded view:
-
Displays all the revenue accounts you're tracking.
-
Shows the performance against the target.
-
Allows drilling into the Account Monitor.
-
Allows viewing through the Sunburst visualization tool.
Expenses Infolet
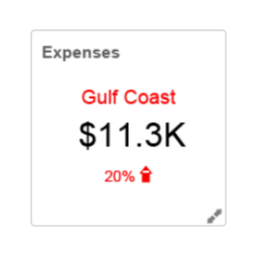
The Expenses infolet shows the expense account with the most unfavorable variance against the target, as defined in the account group. The infolet displays the variance amount and percentage.
The components in the infolet represent:
-
The name of the expense account with the most unfavorable variance against the target.
-
The amount and percentage of the variance between the current balance of the account compared to its target. The target can be a budget or a prior period balance depending on the account group configuration.
The following figure shows an example of the Expenses infolet with an expense account name, variance amount, and variance percentage.
You can expand the infolet to view more information. The list can be sorted by either the variance amount or variance percentage column. The expanded view:
-
Provides list of all the expense accounts you're tracking.
-
Shows the performance against the target.
-
Allows drilling to the Account Monitor.
-
Allows viewing through the Sunburst visualization tool.
Allocations Infolet
The Allocations infolet identifies residual amounts from allocation pools and provides insight into remaining account details, balances, and activities.
The default view of the infolet displays the residual amounts in allocation pools and the count of allocation pool accounts with outstanding balances. The default view uses an X of Y format, where:
-
X represents the number of accounts with an outstanding (nonzero) balance.
-
Y represents the total number of account rows defined in the account group, which is all of the allocation pool accounts being tracked.
When defining an Allocations account group on the Create Account Group page, set the Change criteria on allocation pool accounts to Not Equal and the Threshold value to 0. This instructs the account group to only return allocation pool accounts that still have remaining balances, which are then tracked in the Allocations infolet.
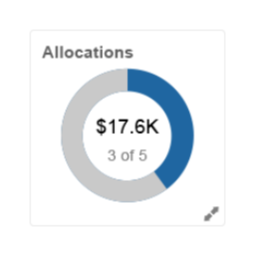
The following figure shows an example of the Allocations infolet. The infolet displays the total balance that's not allocated, the number of accounts with a balance pending allocation, and the total number of rows in the account group, which is all of the allocation pool accounts being tracked.
The expanded view of the infolet displays the list of the allocation pool accounts and their remaining balances.
Viewing Account Groups in the Financial Reporting Center
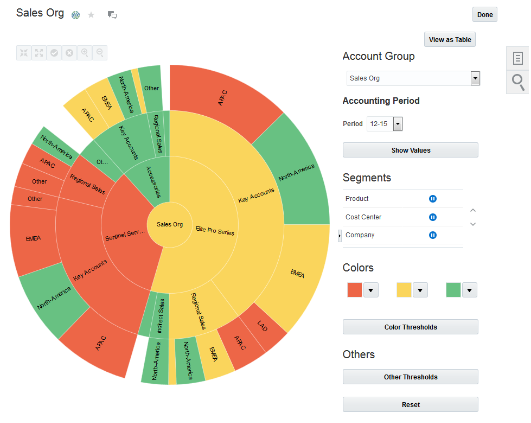
You can view account groups from within the Financial Reporting Center by searching on the name of the account group. When you select an account group, the default view is a table view. You can also view the account group with the Sunburst visualization tool.
With the Sunburst tool, you can:
-
Explore account group balances across three business dimensions.
-
View balances from different perspectives by changing values.
-
Drill into specific sections for a more detailed view.
For example, you can view quarterly regional sales from an account group. The Sunburst tool helps you identify sales trends that are visually represented by size and color. The visualization can indicate whether that region's sales increased or decreased over the quarter. Each Sunburst ring represents a different segment of the accounting flexfield. You can use the control panel to change which segments to display in a ring and the order in which the segments are displayed.
The following figure shows an example of an account group viewed through the Sunburst visualization tool.