Create a Trial Balance Report for Mexico
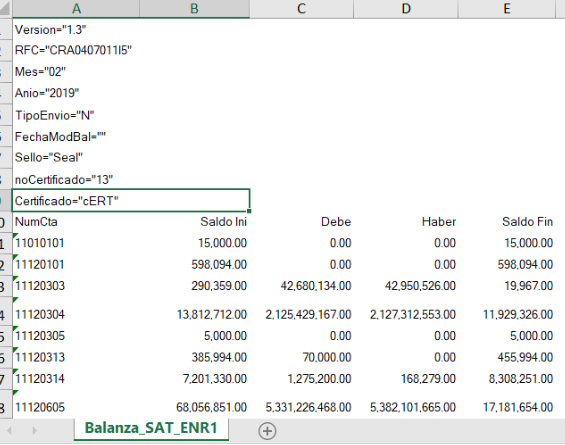
The trial balance report is an XML file that includes a summary of the initial balances, the sum of total transactions for the period, and the final balances for each account in the Chart of Accounts XML file.
The report includes information on accounts related to assets, liabilities, equity, and the results of operations (revenues, costs and expenses).
Use the Financial Reporting Web Studio to create the Trial Balance Report for Mexico. You can create the report once and use it periodically. The report can also be modified based on the requirements from the Federal Government.
Perform the following steps to create the report:
-
From the Financial Reporting Center work area, select the Tasks panel tab and click Open Workspace for Financial Reports.
-
On the Tools menu, select Launch Financial Reporting Web Studio.
-
Click File > New > Report or click the New Report icon.
-
Use the Report Pallet page as the container to build your report.
-
Click Insert > Grid... or click the New Grid icon.
-
Click and hold the left mouse button to select a large area of the grid to create the report.
The Select a Database Connection dialog box appears when you release the mouse after setting the size and position of the grid.
-
Click the Database Connection list.
-
Select your database. A unique cube exists for each combination of chart of accounts and accounting calendar.
Note: The user name and password are the login credentials you used to access the Financial Reporting Web Studio. -
Click OK.
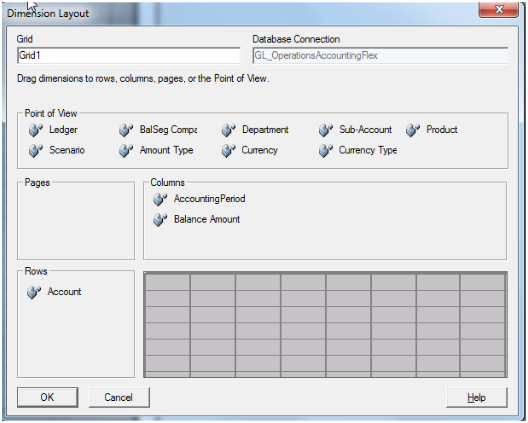
The Dimension Layout dialog box appears. Set the point of view dimensions and accounts for the rows, columns, and page levels.
-
Use the Dimension Layout dialog box to arrange your dimensions. Move:
-
Accounting Period and Balance Amount to Columns.
-
Account to Rows.
Tip: Click the icon in front of the name to select the dimension to move to the designed area.The following figure illustrates how the dimensions appear on the Dimension Layout dialog box after you made your selection.
-
-
Click OK.
You return to the grid which has the selected dimensions.
-
Add additional rows and columns to the grid according to your requirement.
-
Columns: Copy column A and paste it four times to see columns A to E.
-
Rows: Select row 1, right-click and select Insert Row > Text. Insert ten rows.
-
-
Enter the row text in each row cell. The following table lists the row text for each row.
Row
Text
1
Version="1.3"Note: You can update the version number anytime.2
RFC="SYS11103"Note: You can update the RFC anytime.3
Mes="<<MemberName("Grid1", "AccountingPeriod")>>"4
Anio="<<MemberName("Grid1", E, "AccountingPeriod")>>"5
TipoEnvio="N" (User needs to fill value)6
FechaModBal=" " (User needs to fill value)7
Sello="Seal" (User needs to fill value)8
noCertificado ="13"(User needs to fill value)9
Certificado="cERT"(User needs to fill value)10
Update the row cell and columns for row 10 with the following values:
-
Row cell with NumCta
-
Row 10, Column A with Saldo Ini
-
Row 10, Column B with Debe
-
Row 10, Column C with Haber
-
Row 10, Column D with SaldoFin
The following figure illustrates how the grid should appear: 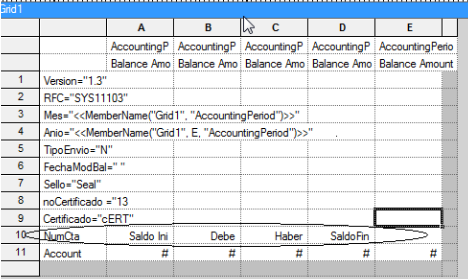
-
-
In the first column on the grid (Column A), double-click the AccountingPeriod cell.
The Select Members dialog box appears.
-
Remove the default selection from the Selected pane and assign a user-defined period selection.
-
Select the AccountingPeriod in the Selected pane and click Remove.
-
Select Current Point of View for Accounting Period from Available pane and click Move to place it in the Selected pane.
-
Select the Place selection into separate columns option.
-
Click OK.
-
Repeat the steps for Columns B, C, and D.
-
In the last column on the grid (Column E), double-click the AccountingPeriod cell to open the Select Members dialog box.
-
Select the AccountingPeriod in the Selected pane and click Remove.
-
Select Current Point of View for Accounting Period from Available pane and click Move to place it in the Selected pane.
-
Click the Functions tab and select RelativeMember from the list.
-
Click Add.
-
Use the Edit RelativeMember Function dialog box to add the parameter values. The following table lists the values you can enter.
Parameter
Value
Member
Current Point of View for Accounting Period
Offset
0
Hierarchy
AccountingPeriod
RelativeMemberList
Fiscal Year
-
Select the Place selection into separate columns option.
-
Click OK.
-
In the first column on the grid (Column A), double-click the BalanceAmount cell.
The Select Members dialog box appears.
-
Remove the default selection from the Selected pane and assign a user-defined selection.
-
Expand the Balance Amount node in the Available pane and select Beginning Balance.
-
Click Move.
-
Select the Place selection into separate columns option.
-
Click OK.
-
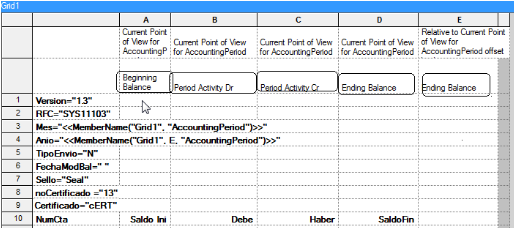
Repeat the steps and assign the user-defined properties as shown in the table for the BalanceAmount cell in the other columns.
Column
Parent Node
Custom Selection
B
Period Activity
Period Activity Dr
C
Period Activity
Period Activity Cr
D
Ending Balance
Ending Balance
E
Ending Balance
Ending Balance
The following figure illustrates how your grid appears when you finish updating user-defined values for all the dimensions.
-
Select column E.
The Custom Properties dialog box appears.
-
Select the Hide Always check box.
-
Select the first two rows (row 1 and 2).
-
Select the Hide Always check box in the Custom Properties dialog box.
-
Select row 11, right-click and click Insert Row > Data. Row 12 is added.
Note: For each account in the SAT chart of accounts mapping, add a row. -
Double-click the Account cell in row 11 to open the Select Members dialog box.
-
Select Account in the Selected pane and click Remove.
-
Click the Members tab.
-
Expand the Account > All Account Values nodes that appear in the Available pane.
-
Select 1110 and click Move. The account appears in the Selected pane.
-
Select the Place selection into separate columns option.
-
Click OK.
You can follow the similar steps to add all your natural accounts.
-
Update the dimensions that appear in the grid with the values specified in the following table.
Note: To update the dimensions, double-click the respective dimension buttons to open the Select Members dialog box. Select the values as specified in the table in the Select Members dialog box and click OK.Dimension
Value
AccountingPeriod
Qtr1-00 for the year 2000
Note: Run the report either for a year or for any quarter of a year.Scenario
Actual
Ledger
Vision Operation
Note: Run the report for any ledger.Amount Type
Base
Currency
MXN
Currency Type
Entered
-
Set the grid properties. Select the grid to open the Grid Properties dialog box. In the Suppression region, check the following check boxes:
-
Basic Options
-
If Zero, Suppress
-
If Missing, Suppress
-
If Error, Suppress
-
-
Save the report.