Spacing and Alignment
Here are some best practices to follow for spacing and alignment of charts and grids in dashboards:
-
Ensure that grids fill the entire designated area.
-
Grid background colors should denote active and read-only cells, if applicable.
-
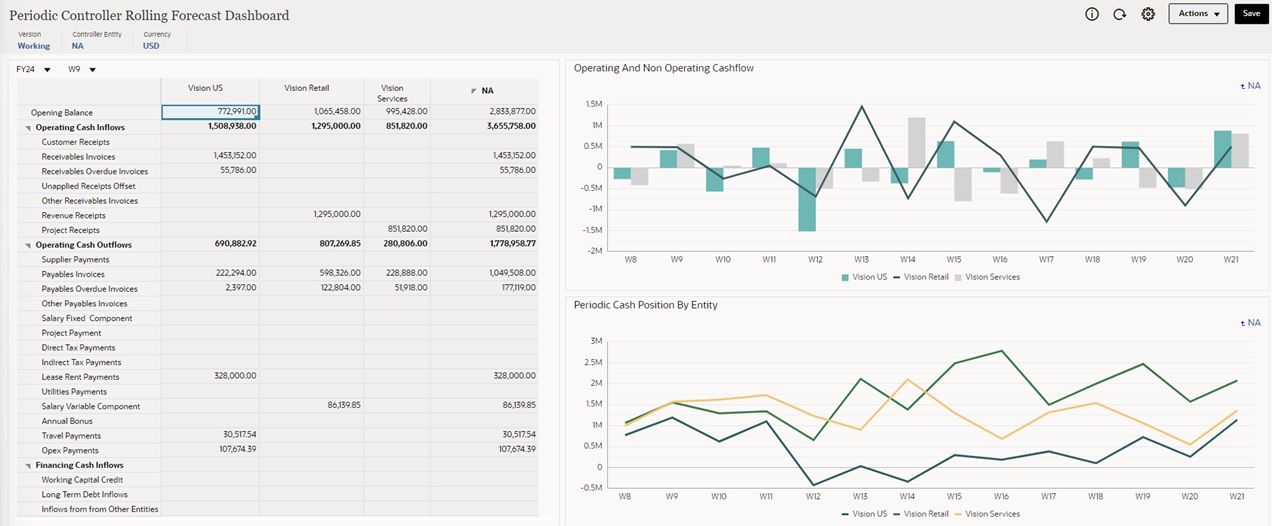
Place legends in a location that enables charts to align. For example in the dashboard below, both of the legends are placed below the charts so the x-axis line in the bottom chart aligns with the x-axis line in the chart above it. If one of the legends was placed to the right of the chart, the x-axis lines would not align.
-
To reduce clutter, consider combining charts with similar information (such as Operating Cashflow and Non Operating Cashflow) into one chart.
-
Another way to reduce clutter is to hide local and global POVs.
Figure 11-9 Example Dashboard: Periodic Controller Rolling Forecast
