Read-Only Dashboard Examples by User
Provided in this topic are examples of read-only dashboards by user. Also provided are recommendations for the information to display in dashboards, the chart types to use, and number of components.
Read-Only Dashboards for Managers and Executives
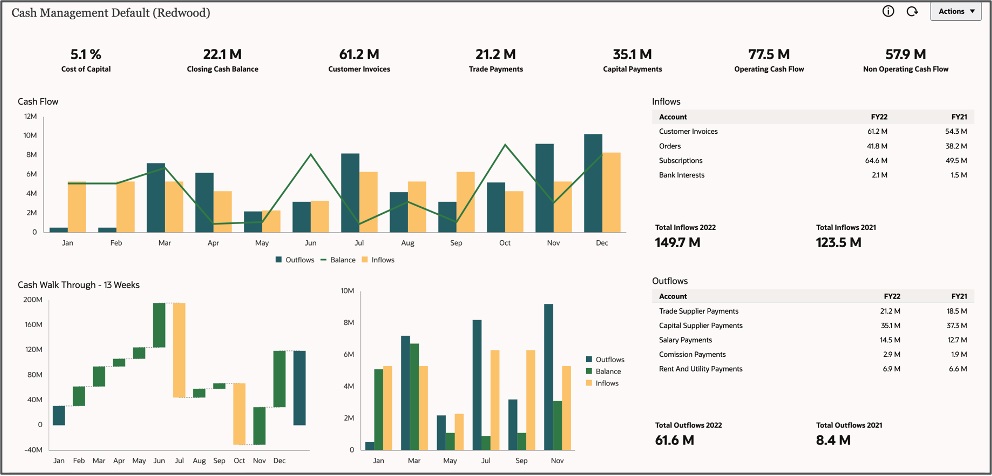
Managers and Executives are typically decision makers. They expect to see tables and charts that give them clear information. Make sure to include expected details in one dashboard consisting of multiple components.
Table 11-16 Read-Only Dashboard Recommendations for Managers and Executives
| Dashboard Content | Recommendation |
|---|---|
|
Information to display |
|
|
Chart types |
Tile, Gauge, Table, Pie/Doughnut, Line/Bar, Geomap, Radar, Waterfall |
|
Number of dashboard components |
3 to 6 |

Read-Only Dashboards for Data Analysts and Interactive Users
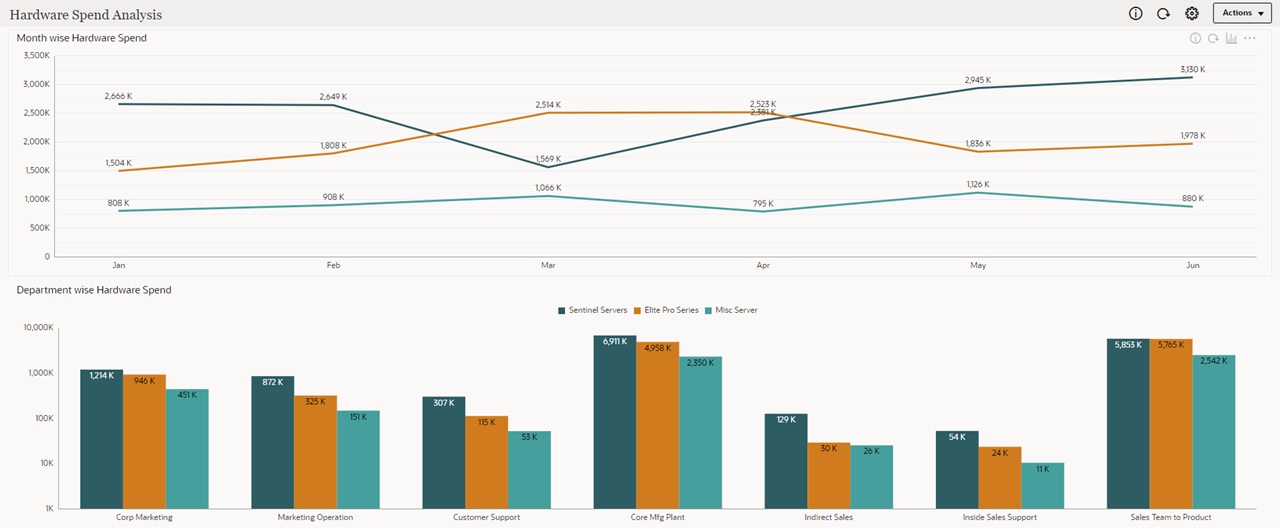
Data Analysts and Interactive Users typically perform data analysis and provide insights to senior management for important decisions.
Table 11-17 Read-Only Dashboard Recommendations for Data Analysts and Interactive Users
| Dashboard Content | Recommendation |
|---|---|
|
Information to display |
|
|
Chart types |
Tile, Gauge, Table with Spark Chart, Pie/Doughnut, Line/Bar, Geomap, Radar, Waterfall, Bubble, Scatter, Funnel, Pyramid, Grids (with summary data) |
|
Number of dashboard components |
3 to 6 |
