Overview of the Debugger
The debugger in AI Agent Studio helps you to trace, test, and troubleshoot agentic flows in real time. It provides visibility into node execution, context, inputs, outputs, and LLM reasoning, helping you understand the runtime behavior of the agentic flow. Before you publish your workflow or agentic app, you can use the debugger to validate its behavior. It shows how a request flows through the agent, what inputs are passed to each node, what outputs are returned, and how the final response is generated. This visibility helps you isolate defects and reduce trial and error.
- Shorten build cycles: Rerun the agentic flow from a specific node instead of replaying the entire flow.
- Improve quality: Catch incorrect routing, malformed payloads, poor tool responses, and weak summaries during design time itself.
- Increase reliability: Repeat common scenarios using saved run profiles.
- Lower operational risk: Use step-through debugging and output inspection to understand why an agent made a particular decision.
- Accelerate root-cause analysis: Trace an incorrect response back to the node where the issue originated.
- Improved collaboration: Help product managers, developers, and support teams collaborate by reviewing and discussing node inputs and outputs.
| Debugging Action | When to Use | What You Can Inspect or Verify |
|---|---|---|
| Run workflow | Run a full test path for the workflow. | Validate the complete workflow. |
| Run saved profile | Reuse saved test inputs. | Run regression tests for common scenarios. |
| Inspect nodes | View runtime data for a node. | Inspect inputs, outputs, variables, and context. |
| Breakpoint | Pause before or at a specific node. | Inspect state of each node before continuing the debug session. |
| Step through nodes | Run one node at a time. | Verify that each node passes the correct output to the next node. |
| Resume debugging | Continue the debug session. | Resume workflow run after inspection. |
| Rerun From Node | Retest the workflow from a specific node. | Retest the selected node and downstream logic. |
| Pin output | Reuse stable output data. | Verify how cached output affects downstream processing. |
| Edit output | Test downstream processing with modified output data. | Verify how downstream systems consume the modified payload. |
| Override node configuration | Test the changes to prompts or configurations. | Verify the effect of temporary changes before applying them permanently. |
Here's a screenshot showing the three main working areas in the debugger. 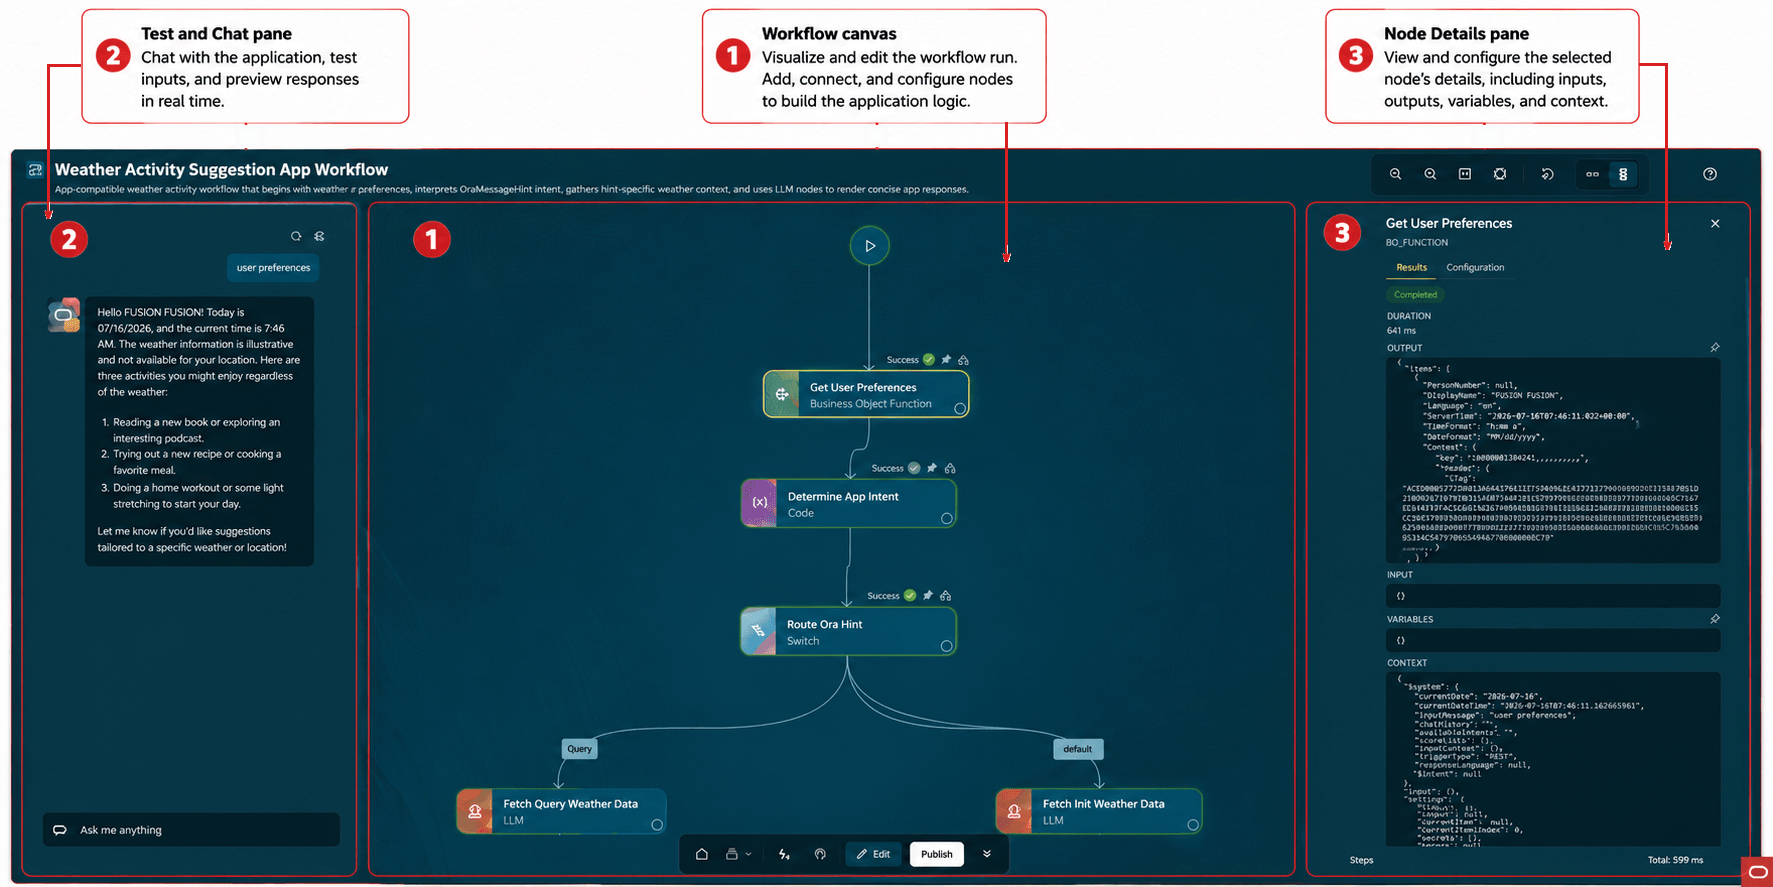
| Callout Number | Name | Description |
|---|---|---|
| 1 | Workflow canvas | This canvas displays the workflow nodes and the connections between them. Depending on the workflow, it can include start and end nodes, LLM or agent nodes, Decision nodes, Function or Tool nodes, Loop nodes, Human Approval nodes, and Return nodes. During a workflow run, the canvas shows the runtime status of each node. Completed nodes display a success status, while the active or stopped node is highlighted. Branch labels indicate the path followed after a Switch or If Condition node. |
| 2 | Test and Chat pane | In debugger, you can use Ask Oracle to submit a test prompt and review the response. Use realistic prompts that represent the path you want to test, such as a request that must trigger a list, detail, policy, update, approval, or lookup flow. Use the conversation to view debugger status messages that indicate where the run is paused and which node currently has control. |
| 3 | Node Details pane |
Selecting a node displays the node details that include the Results and Configuration tabs.
|