Summary Configuration in Budget Display
You can enable the views that appear in the summary area of the budget worksheet, such as a scoreboard, a table, or both.
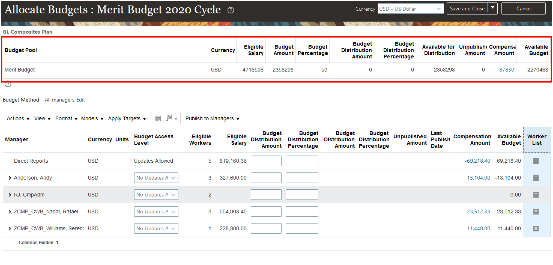
If you enable both views, you also specify which view appears by default when managers open the worksheet. Here's an example budget worksheet with only the table view enabled.
You can enable the columns that appear on the view and override all of the default display names. For example, you change Budget Distribution Percentage to Budget Distribution %. And you can override the default sequence of any column, as appropriate to best support how your managers expect their analytics. For the table view, use the Refresh icon on the Column Preview panel to see how the reordered columns will appear in the summary area.
You can also configure properties for the columns you enable, such as setting a rounding rule and the decimal places to display. The actual properties vary depending on the column. All columns include a Plan Info property that you can use to communicate useful information to managers. For example, you share the expression used to calculate the column values, or add a definition for the column, such as explaining what is compa-ratio.