Flow Debugger User Interface
This topic only applies to Intelligent Advisor Cloud Service
The flow debugger has two tabs:
Flow tab
The Flow tab shows you the current state of each item that makes up the flow session that you are debugging.
The Flow tab has two panes:
-
a left hand pane, known as the flow model panel
-
a right hand pane, known as the details view
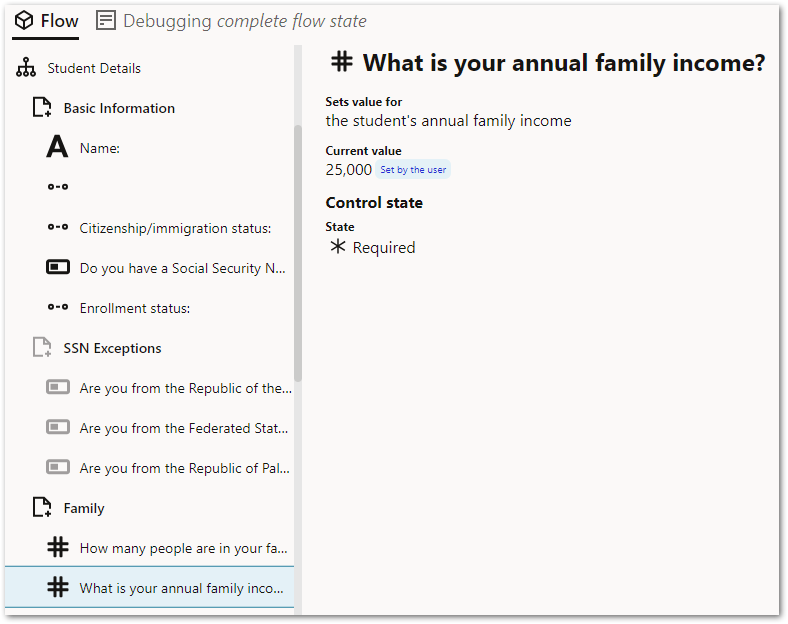
This lists all items in the flow (excluding comments). Any items that are hidden in the flow (based on the current state of the flow) are greyed out.
Clicking on an item in the flow model panel will show the details of that particular item in the flow model.
The details view shows the details for the item selected in the flow model panel. What appears for each item in the view will depend on its type as described in Table 1 below.
| Item type | Details |
|---|---|
| Global input data | Information about the currently set global input data |
| Flow item group |
Information about the group's current state. If the group repeats, details on which records are being displayed |
| Page | Information about the page's current state |
| Custom data action |
Information on whether the data action's is active or not The current value of any configured send data The currently set return data for the data action |
| Label | Information on the label's current state |
| Input: text, date, Boolean or number |
Information on the control's current value and how it was set (user set or defaulted) Information on the control's current state Details on any input errors and validations created for each control |
| Input: record or multiselect (record list or reference list) |
Information on the control's current value and how it was set (user set or defaulted) Details about the options available for selection Information on the control's current state Details on any input errors and validations created for each control |
| List collect (record collect) |
Information on the control's current value and how it was set (user set or default blank instances) Information on the control's current state Details on any input errors and validations created for each control |
| Group |
Information on the group's current state If the group repeats, details on which records are being displayed |
| Validation | Information on whether the validation condition has been satisfied |
If you click on a field in an expression in the details view:
-
if the field is inferred by a rule, you can navigate to the rule that proves it using the Debug value link. For more information, see Debug a Field Expression.
-
if the field is collected by a control, you can navigate to the control that collects the value using the Set by a user link.
-
if the field is set by a data action or global input data, you can navigate to the action or global input that sets the value using the Mapped in by a data action link.

Debug tab
The Debug tab allows you to open individual rule documents using the folder menu.

Each document opened will be displayed on a separate tab. This is known as the rules view.
The title of the Debug tab changes to show you what you are debugging and at which location in the flow you are debugging at.
When debugging field expressions, the title will be in this format:
-
Debugging <field name> at location <flow location>
where:
-
<field name> is the name of the field you selected for debugging in the details view on the flow tab.
-
<flow location> will be the control location that is being debugging from. In other words, the rules will reflect as sessions state that include all the values collected before this control in the flow, but not any value collected after this control or any values collected by the control itself. Some expressions such as "must satisfy" validations on controls are always evaluated in the "complete state", that is the session state that results from evaluating the entire flow from start to finish. In this case, the flow location will be <complete flow state>.
When debugging relevance, the title will be in this format:
-
Debugging relevance at location <flow location>
where <flow location> will be the control location that is being debugging from. In other words, the rules will reflect as sessions state that include all the values collected before this control in the flow but not any value collected after this control or any values collected by the control itself.
The rules view is displayed when you select a field to debug in the details view of the Flow tab. It allows you to see the values of your rules in a similar manner as the Live mode for decision service rules.
If you click on a field in the rules view:
-
if the field is inferred by a rule, you can navigate to the rule that proves it using the Set by a rule link.
-
if the field is collected by a control, you can navigate to the control that collects the value using the Set by a user link.
-
if the field is set by a data action or global input data, you can navigate to the action or global input that sets the value using the Mapped in by a data action link.
When debugging field expressions, the debugger uses the green highlighting to show "contributed" mode. For more information, see Debug a Field Expression.
When debugging relevance expressions, the debugger uses the orange highlighting to show "required" relevance mode. For more information, see Debug a Relevance Expression.