Define Your Own Metrics

Create a user-defined metric or Key Performance Indicator (KPI) to display asset data that is specific to your operating environment. Metrics are created on asset types.

  1. Click Menu (Menu icon), and then click Design Center.
  2. Select Asset Types from the Design Center sub-menu.
  3. Select an asset type from the Asset Types list.
    You can also search for an asset type.
    The metric is available for each asset of the chosen asset type. The metric can be aggregated across assets on the Dashboard or the Map view.
  4. Click Metrics.
  5. Click Create Metric Add icon.
  6. Enter a Name to identify the new metric.
  7. Select Formula Based under Metric Type.
  8. (Optional) Select a value under Keep Metric Data For.
    If you have unique storage requirements for historical data related to this metric, you can select an option that is different from the global settings defined under Storage Management on the application Settings page.
    For example, if you are calculating frequent metrics across a large number of assets, and the metric data is not required beyond a month, then you can select 30 Days under Keep Metric Data For to optimize storage.
  9. Under Calculation Scheduling, choose an option under Type.
    Metrics can be calculated per entity (asset), or can be calculated globally for an entity type (asset type). If you select On Schedule per Entity, then the metric is calculated for each asset of the asset type. If you select On Schedule for Entity Type, then the metric is aggregated across all entities of the asset type. For example, you can calculate the average temperature across all temperature sensors.

    You can also choose to aggregate the metric across all assets in an asset group. This helps compare and rank groups. Select On Schedule per Group to create a metric aggregated across assets in a group. You can use both static and filter-based groups. On Schedule per Group aggregates data only for leaf groups.

  10. Specify a calculation Schedule:
    • Live calculates the metric every two minutes.

      Use this option sparingly, as it may require a lot of computational and storage resources depending on your number of assets. The Live option may be used in special circumstances: For example, when the metric is to be used for anomaly detection purposes.

    • Hourly aggregates the metric for every hour.

    • Daily aggregates the metric for every day.

    • Weekly aggregates the metric for every week.

  11. (Optional) Click Edit Edit icon to change the Data Window to use.
    By default, the Data Window is the same as the calculation schedule. For example, if you have set the metric schedule to Hourly, the data from the previous hour is used to calculate the metric.
    You can also use flexible data windows for your scheduled metric calculations. The data window can be different from the calculation schedule. For example, you may wish to compute the total output for the past twenty-four hours, and calculate this metric hourly.
    In addition to sliding data windows, you can also use dynamic custom data windows. For example, you may wish to do an hourly calculation of the cumulative output for the day, starting 9 a.m. in the morning.
    1. Select a Configuration value:
      • Default: Uses the default data window as per the selected schedule. For example, if you have set the metric schedule to Hourly, the data from the previous hour is used to calculate the metric.
      • Data Window Start Time: Lets you pick from a number of fixed options. For example, you may use data from the last one week, and calculate the metric hourly.

        When choosing larger data windows, ensure that the data life span settings for your custom metrics are large enough in the application settings, so that there is data available for the selected window.

      • Custom Data Window Start Time: Lets you choose a fixed start time for the data window. For example, you may wish to do an hourly calculation of the cumulative output for the day, starting 9 a.m. in the morning.

        This option is only available when selecting the Live or Hourly schedule.

    2. Select the Data Window value corresponding to the selected configuration:
      • If you selected Default, the Data Window is automatically selected to match the metric calculation schedule.
      • If you selected Data Window Start Time, specify the Offset to use. For example, choose One Week Ago, to use the data from the past one week.
      • If you selected Custom Data Window Start Time, then specify the fixed start Time for the data window in the UTC (Coordinated Universal Time ) time zone.
  12. Using the Formula editor, define an expression to calculate the new metric.
    You can build your operation using the elements in the Formula editor, or click Advanced to directly edit the SQL-like expression.

    Start by choosing your aggregation. For example, select Average if you wish to, say, calculate the average hourly temperature for a sensor.

    The following aggregation functions are available:
    • Count

    • Sum

    • Average

    • Min (Minimum)

    • Max (Maximum)

    Next, build your formula by selecting properties, operators, and other functions.

    Sensor attributes are examples of properties that are often used in metrics. For example, an HVAC asset may use various sensor attributes, such as oil viscosity and output temperature.

    The following are some examples of formulae:
    • AVG (FuelLevel): Returns the average FuelLevel over the specified time period.

    • MIN(MaxPressure/2 + MinPressure/2): First uses the MaxPressure and MinPressure sensor values to compute the average pressure, and then returns the minimum of this average pressure over the specified time period.

    Your expression can contain the following elements:
    • Parenthesis: Use parenthesis to group operations and indicate precedence.
    • Symbols: You can use arithmetic (+, -, *, /), relational (=, <, >, <=, >=, !=), and logic (AND, OR, LIKE) operators. When you click the Symbol button, the add operator appears in our formula. If you want to select another operator, click the Add icon and select a different operator from the list.
    • Numbers, text, and boolean values.
    • Properties: A list of system attributes and sensor attributes that you can use to build your own metrics. This list is based on the asset type and function that you selected.
    The description for the metric is automatically created based on the properties and operators that you select.

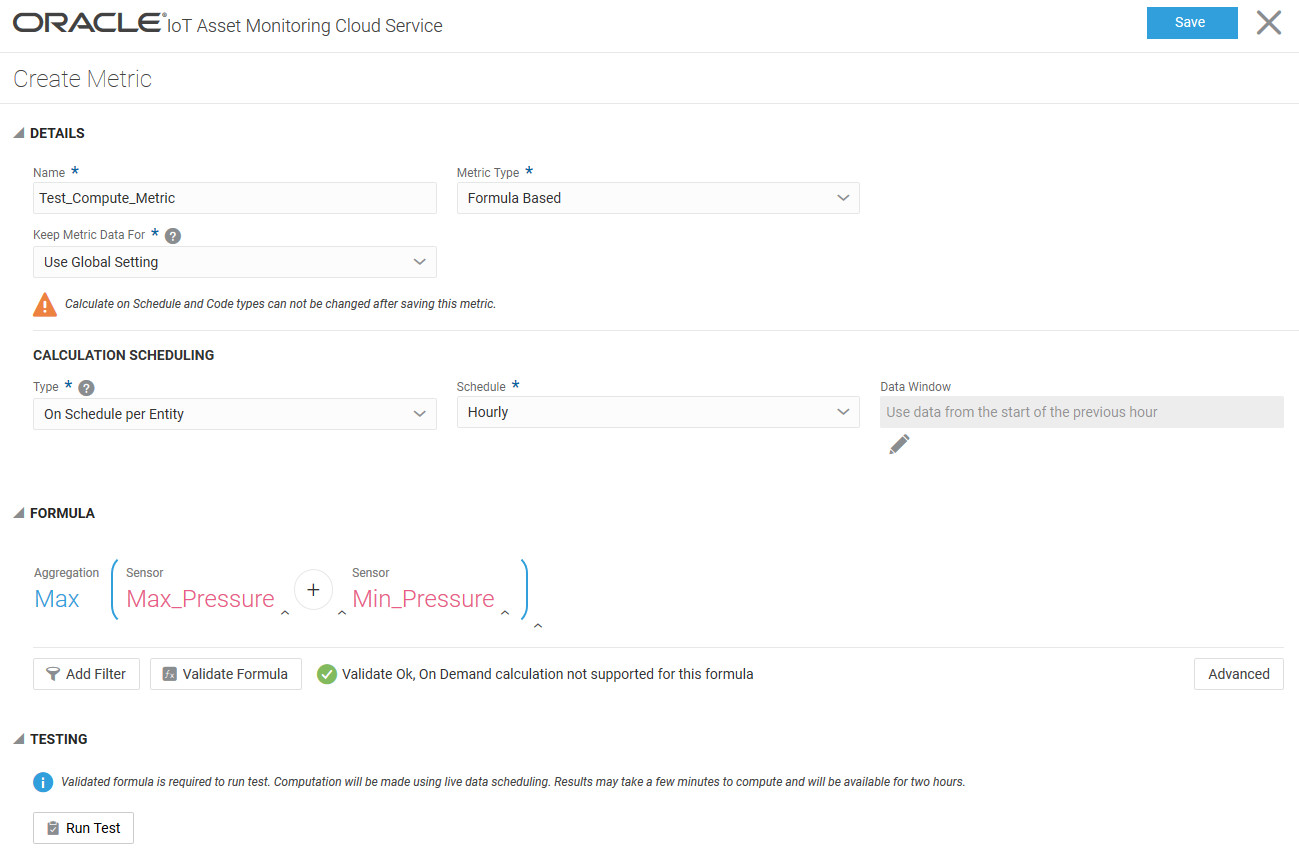
    The following example of the Create Metric editor shows a computed metric that returns the maximum value of the sum of two sensor attributes every hour.


    Create Metric Editor

  13. Click Validate Formula to validate your formula expression.
  14. (Optional) Under Testing, click Run Test to view sample metric results on live asset data.

    Note:

    You must successfully validate the formula before Run Test is enabled.
    Sampling the metric values lets you validate whether your computations work along expected lines. Sampling also lets you determine if the metric can go live, and if the metric is ready to be used in analytics artifacts, such as anomalies and predictions.

    Computations are made using live data scheduling. Results may take a few minutes to compute and are available for two hours. Metric results may be shown for a sample selection of assets to cover the range of metric values.

  15. Click Save to create the metric.
You can now add the metric to a dashboard or to the Map.

Metric Usage Examples

This section discusses metric usage examples to help you use the formula editor. It also provides several metric SQL examples.

Example 4-1 Single Asset Metrics and Multi-Asset Metrics

Concepts Covered:
  • Aggregation Functions
  • Sensor Attributes in Metrics
  • Filters
  • Relational Operators

Scenario: We create a metric to measure the maximum fuel level for each power generator. Next, we create a metric to measure the count of generators with sufficient fuel.

Metrics:
  1. Create a metric, Max_Hourly_Fuel that is calculated hourly for each asset.
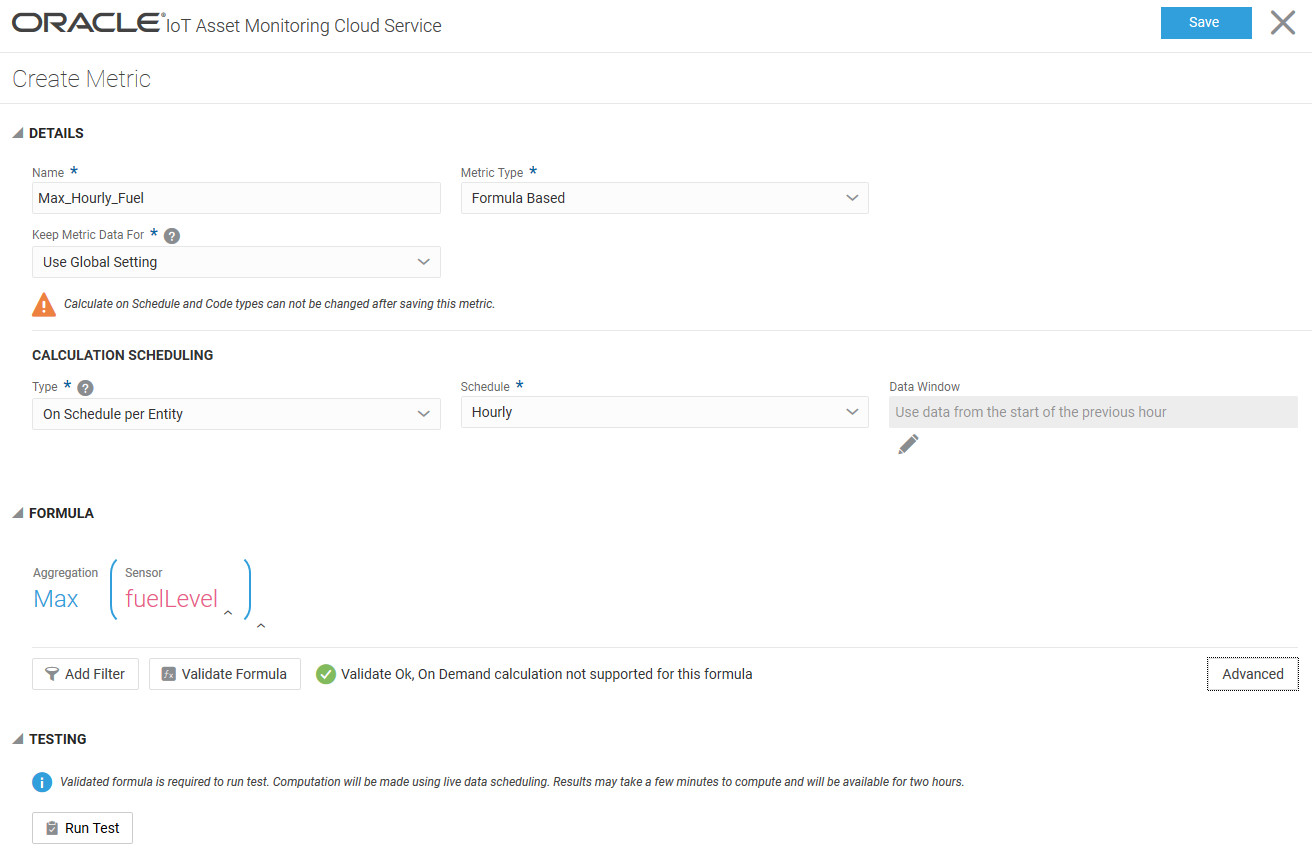
    Max Hourly Fuel Metric

    The following SQL is generated corresponding to the metric and calculated hourly:

    SELECT MAX('Sensors'.'fuelLevel') FROM 'Generator' GROUP BY ENTITY

    You can put this metric on the machine dashboard to see the hourly maximum fuel level for the selected asset.

  2. Create a metric, Assets_with_Sufficient_Fuel to calculate the count of assets that have sufficient fuel levels. The metric defines fuel levels above 20 to be sufficient. Note that a filter is applied after adding the Count function to add the Where clause. A relational operator (>) is used to perform the comparison.
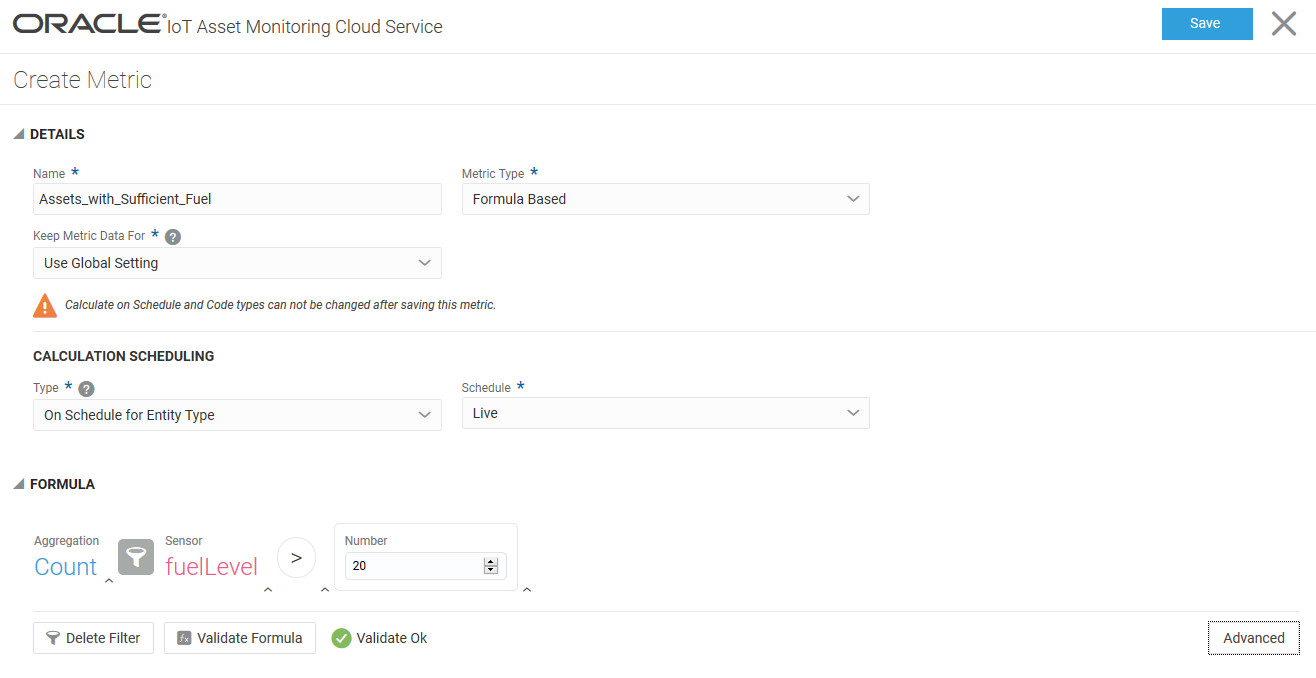

    Count of assets with Fuel Levels Greater than 20

    The following SQL is generated corresponding to the metric:

    SELECT COUNT(*) FROM 'Generator' WHERE 'Sensors'.'fuelLevel'>20

    You can put this metric on the organization dashboard to see the current count of generator assets with sufficient fuel.

Example 4-2 Nested Metrics and Formulas

Concepts Covered:
  • Functions
  • Metrics within Metrics
  • Filters
  • Relational Operators, Arithmetic Operators

Scenario: We first create a metric to measure the hourly standard deviation value of the fuel level for each power generator. Next, we create a metric specific to our business use case: The metric calculates the number of generators that can be allocated for the project using a custom formula. The formula makes use of the metrics already created.

Metrics:
  1. Create a metric, Fuel_Std_Dev that is calculated hourly for each asset.
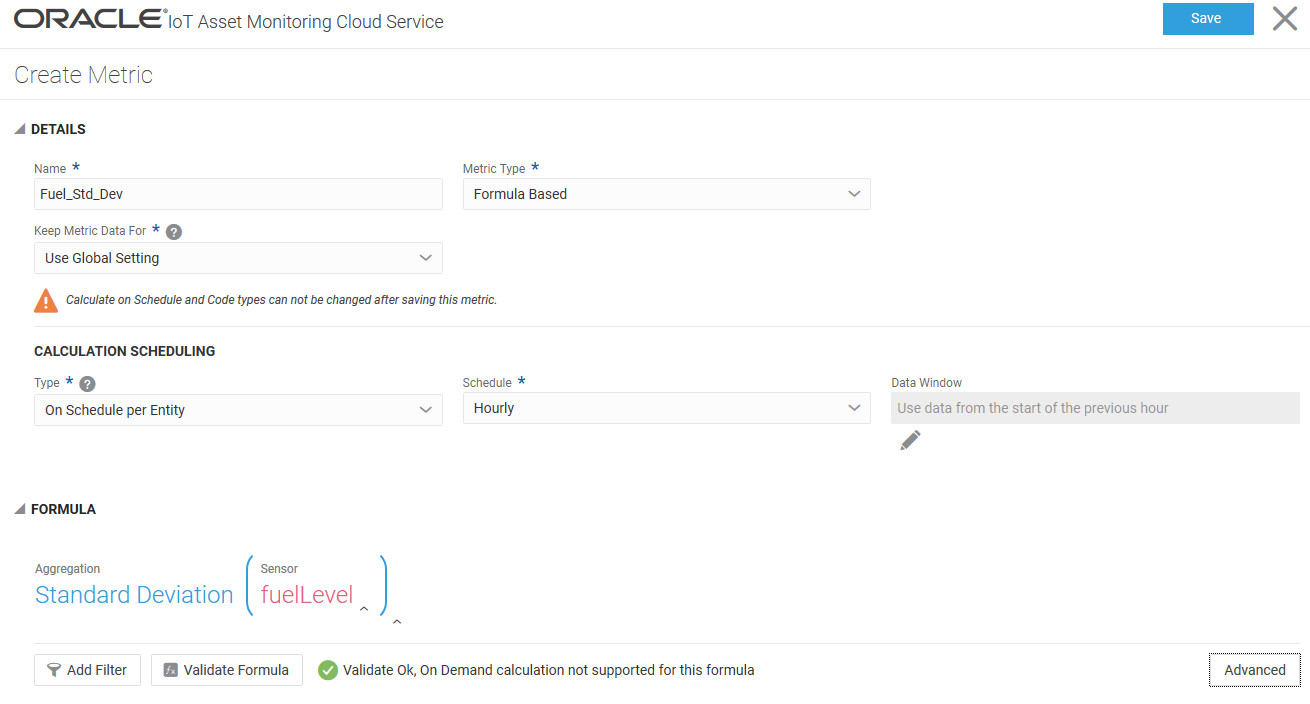

    Hourly Standard Deviation for Fuel Level

    The following SQL is generated corresponding to the metric and calculated hourly:

    SELECT STDDEV('Sensors'.'fuelLevel') FROM 'Generator' GROUP BY ENTITY

    You can put this metric on the machine dashboard to see the hourly standard deviation of the fuel level for the selected asset.

  2. Create a metric, Assets_to_Allocate to calculate the count of assets that are ready to be allocated to the project. The metric defines the following business-specific formula:

    Find the count of assets for which the fuel levels are greater than the difference between Max_Hourly_Fuel and 1.5 times the Fuel_Std_Dev metric. Here, Max_Hourly_Fuel and Fuel_Std_Dev are the metrics we calculated in the earlier examples.
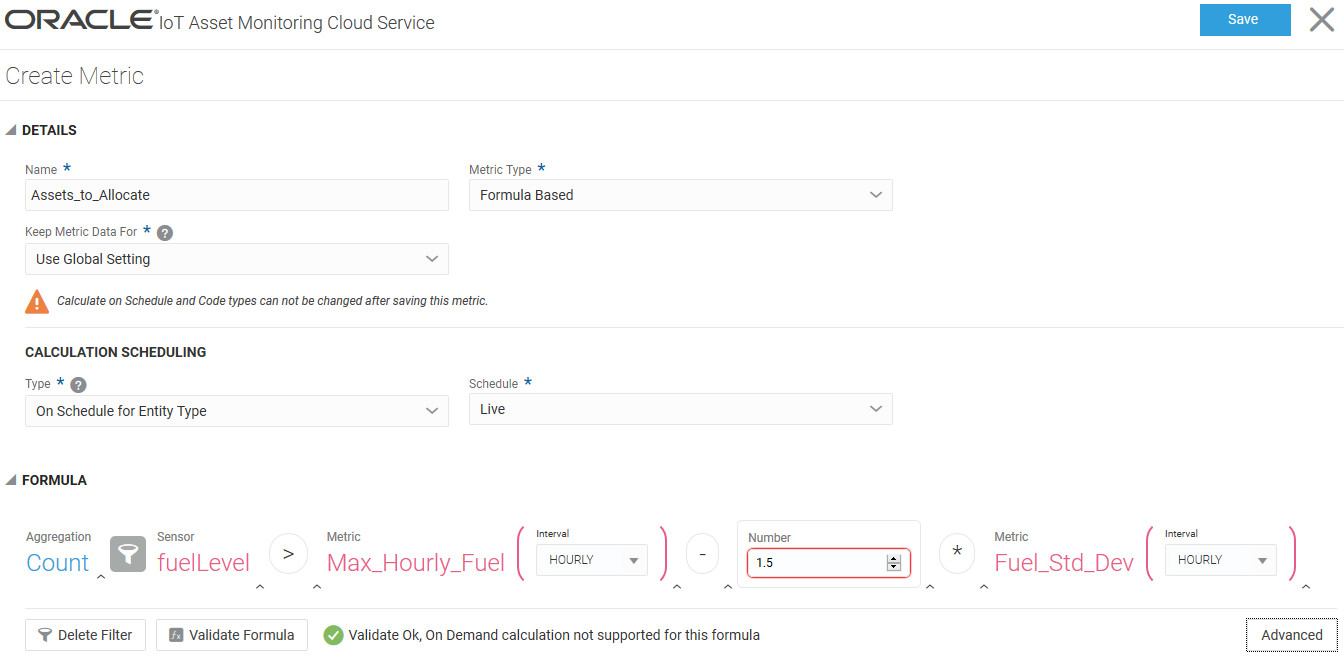

    Business Formula Metric: As described in surrounding text

    The following SQL is generated corresponding to the metric:

    SELECT COUNT(*) FROM 'Generator' WHERE 'Sensors'.'fuelLevel'>'Metrics'.'Max_Hourly_Fuel'['interval':"HOURLY"]-1.5*'Metrics'.'Fuel_Std_Dev'['interval':"HOURLY"]

    You can put this metric on the organization dashboard to see the current count of generator assets ready to be allocated.

Metric SQL Examples

Description and Use case for the Metric Metric SQL Query Type Concepts

Number of assets with incidents > 0.

Helps to understand the number of assets that have issues.

SELECT COUNT(*) 
FROM 'Assets' 
WHERE 'Metrics'.'sys_openIncidents' > 0
Multi-Asset
  • Aggregation Functions
  • System Metrics
  • Relational Operators

Number of assets of specific type with temperature sensor value > 50.

Helps understand the number of assets behaving abnormally.

SELECT COUNT(*) 
FROM 'AssetWithSensors' 
WHERE 'Sensors'.'temperature' > 50
Multi-Asset
  • Sensor Attribute
  • Relational Operators
  • Aggregation Functions

Number of assets of specific type with temperature sensor value > (pressure sensor value * 1.5).

Helps understand the number of assets behaving abnormally.

SELECT COUNT(*) 
FROM 'AssetWithSensors' 
WHERE 'Sensors'.'temperature' > 
  'Sensors'.'pressure' * 1.5
Multi-Asset
  • Multiple Sensor Attributes
  • Arithmetic Operators
  • Relational Operators
  • Aggregation Functions

Number of assets with temperature sensor value > average(temperature value over last 24 hours).

Helps understand the number of assets operating in the above average temperature range.

avgTemp[DAILY] ::= 
  SELECT AVG('Sensors'.'temperatue')
  FROM 'AssetWithSensors'
  GROUP BY ENTITY

SELECT COUNT(*) 
FROM 'AssetWithSensors' 
WHERE 'Sensors'.'temperature' > 
  'Metrics'.'avgTemp'['interval': "DAILY"]
Multi-Asset
  • Nested Metrics
  • Relational Operators
  • Aggregation Functions

Number of assets with temperature sensor value * 1.5 + humidity sensor value * 0.75 > 2.7.

You may create formula-based metrics based on your models.

SELECT COUNT(*) 
FROM 'AssetWithSensors' 
WHERE 'Sensors'.'temperature' * 1.5 + 
  'Sensors'.'humidity' * 0.75 > 2.7
Multi-Asset
  • Formula-Based Metric
  • Multiple Sensor Attributes
  • Arithmetic and Relational Operators
  • Aggregation Function

Number of assets with average (temperature in last hour) > average (temperature in last 24 hours).

May help identify drifting assets.

avgTemp[HOURLY, DAILY] ::= 
  SELECT AVG('Sensors'.'temperatue')
  FROM 'AssetWithSensors'
  GROUP BY ENTITY

SELECT COUNT(*) 
FROM 'AssetWithSensors' 
WHERE 'Metrics'.'avgTemp'['interval': "HOURLY"] > 
  'Metrics'.'avgTemp'['interval': "DAILY"]
Multi-Asset
  • Nested Metrics
  • Relational Operators
  • Aggregation Functions

Number of assets with average (temperature in last hour) > max (temperature in last 24 hours) - 1.5*standarddev (temperature in last 24 hours)

Helps identify drifting assets.

avgTemp[HOURLY] ::= 
  SELECT AVG('Sensors'.'temperatue')
  FROM 'AssetWithSensors'
  GROUP BY ENTITY

maxTemp[DAILY] ::= 
  SELECT MAX('Sensors'.'temperatue')
  FROM 'AssetWithSensors'
  GROUP BY ENTITY

stdevTemp[DAILY] ::=
  SELECT STDEV('Sensors'.'temperatue')
  FROM 'AssetWithSensors'
  GROUP BY ENTITY

SELECT COUNT(*) 
FROM 'AssetWithSensors' 
WHERE 'Metrics'.'avgTemp'['interval': "HOURLY"] > 
  'Metrics'.'maxTemp'['interval': "DAILY"] - 
    1.5 * 'Metrics'.'stdevTemp'['interval': "DAILY"]
Multi-Asset
  • Nested Metrics
  • Formula-Based Metric
  • Standard Deviation Function
  • Aggregation Functions

(Temperature value + pressure value *1.5 + (humidity value / 3))*0.05-2.7

You may create formula-based metrics based on your models.

SELECT LAST(
  ('Sensors'.'temperature' +
   'Sensors'.'pressure' * 1.5 +
   'Sensors'.'humidity' / 3
  ) * 0.05 - 2.7)
FROM 'AssetWithSensors'
GROUP BY ENTITY
Single Asset
  • LAST Function
  • Formula-Based Metric
  • Multiple Sensor Attributes
  • Arithmetic Operators

(Avg temperature value in last 24 hours )+(avg pressure value in last 24 hours) *1.5 +(avg humidity value in last 24 hours / 3))*0.05-2.7

You may create formula-based metrics based on your models.

avgTemp[DAILY] ::= 
  SELECT AVG('Sensors'.'temperatue')
  FROM 'AssetWithSensors'
  GROUP BY ENTITY

avgPressure[DAILY] ::= 
  SELECT AVG('Sensors'.'pressure')
  FROM 'AssetWithSensors'
  GROUP BY ENTITY

avgHumidity[DAILY] ::= 
  SELECT AVG('Sensors'.'humidity')
  FROM 'AssetWithSensors'
  GROUP BY ENTITY

SELECT LAST(
  ('Metrics'.'avgTemp'['interval': "DAILY"] +
   'Metrics'.'avgPressure'['interval': "DAILY"] * 1.5 +
   'Metrics'.'avgHumidity'['interval': "DAILY"] / 3)
  ) * 0.05 - 2.7)
FROM 'AssetWithSensors'
GROUP BY ENTITY
Single Asset
  • Nested metrics
  • LAST Function
  • Formula-Based Metric
  • Multiple Sensor Attributes
  • Arithmetic Operators

Total time in last 24 hours when the temperature value was > 45

Assessing the amount of time the asset is performing beyond specified temperature limits.

SELECT TIME_SUM(*)
FROM 'AssetWithSensors'
WHERE 'Sensors'.'temperature' > 45
GROUP BY ENTITY
Single-Asset
  • Time Function
  • Sensor Attribute
  • Relational Operator

Total time in last 24 hours when temperature value - pressure value * 1.5 > humidity value *0.75 / tire pressure

Knowledge base anomaly behavior definition

SELECT TIME_SUM(*)
FROM 'AssetWithSensors'
WHERE 'Sensors'.'temperature' - 'Sensors'.'pressure' * 1.5 > 
  'Sensors'.'humidity' * 0.75 / 'Sensors'.'tirePressure'
GROUP BY ENTITY
Single-Asset
  • Time Function
  • Formula-Based Metric
  • Multiple Sensor Attributes
  • Arithmetic Operators and Relational Operator

Total in-use time in last 24 hours when vibration > 300 AND temperature > 100

Understanding assets with anomalous behavior.

SELECT TIME_SUM(*)
FROM 'AssetWithSensors'
WHERE 'Sensors'.'vibration' > 100 AND
  'Sensors'.'temperature' > 300
GROUP BY ENTITY
Single-Asset
  • Time Function
  • Multiple Sensor Attributes
  • Relational Operator
  • Logical Operator