The Operations Center
The operations center is your default view for your organization. When you first log in to Oracle IoT Asset Monitoring Cloud Service, you are placed into the operations center for your organization.
You can return to the operations center from any page by clicking Menu and selecting Operations Center.
You can monitor all your digital twin assets and dashboards from within the operations center. The Map View displays your assets per their current locations on the map.
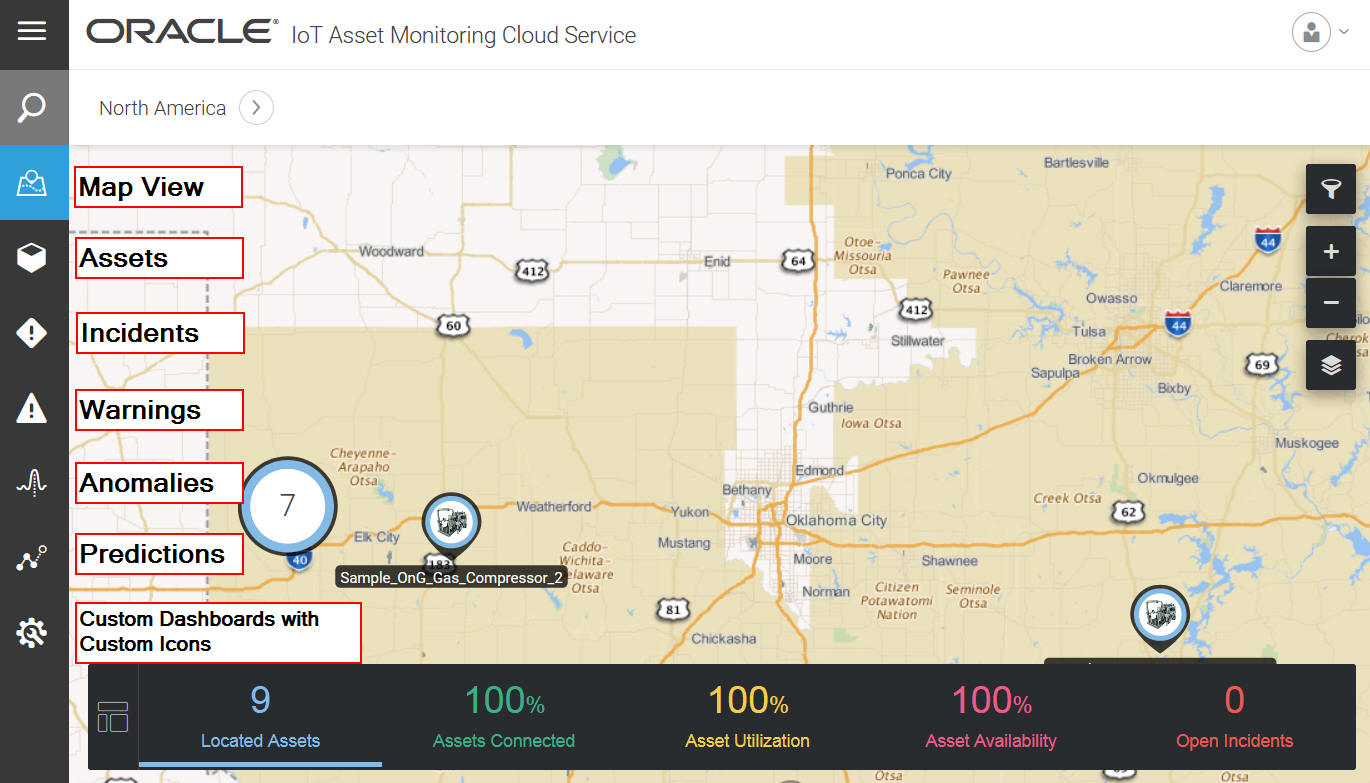
You are placed in the Map view by default. The toolbar on the left lets you access the following pages for the assets visible in the map:
- Search lets you search for groups, assets, locations, and places.
- Map displays the map view. See for more information on working with the map view.
- Assets displays the list of assets. If you have group subdivisions, the assets can be found under the groups and subgroups.
- Incidents displays the list of incidents for the assets currently visible in the map.
- Warnings displays the list of incidents for the assets currently visible in the map.
- Anomalies displays the list of anomalies for the assets currently visible in the map.
- Predictions displays the list of predictions for the assets currently visible in the map.
- Trends displays the list of trends for the assets currently visible in the map.
- Custom Dashboards display any custom dashboards that you have added for the organization or group.
The following image shows the Operations Center view and the various menu bar options.

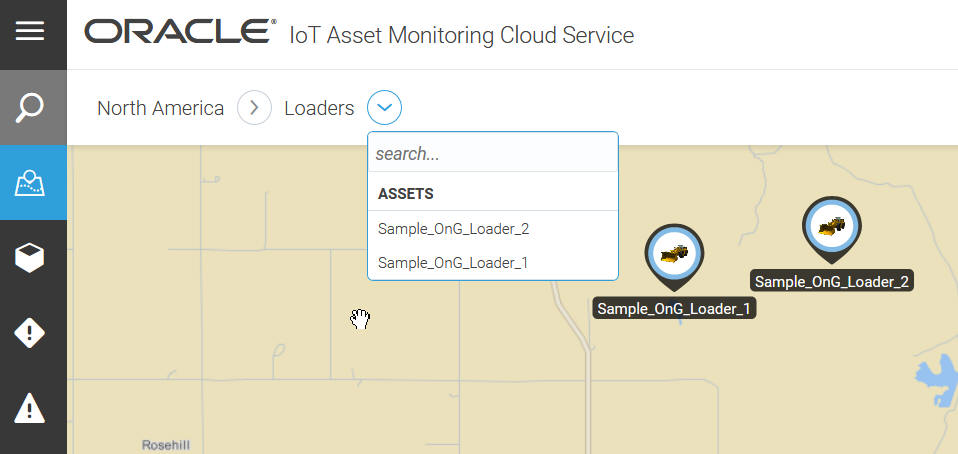
The breadcrumbs at the top let you filter your context. For example, in the following image, we navigate to the Loaders group under the North America organization to narrow down to the assets in the group.

By changing the context or scope using the breadcrumbs, you automatically change the context for all the options on the menu bar. So, if you change the context to the Loaders group, and click Incidents, then only the incidents for the assets in the Loaders group are displayed.
If you have created group-based dashboards, then changing the context to a group also makes the corresponding group's dashboard icons appear on the menu bar.
You can click any entity in the breadcrumbs to change your context back to that entity. For example, if you were to click North America in the preceding image, you would go back to the parent context.
The breadcrumbs maintain a trail of the pages and tabs that you used to navigate to a particular page. This trail helps you switch back to the tabs that you used at higher levels in the hierarchy. For example, if you used the Assets tab to navigate to the Digital Twin page for a particular asset, then you can use the breadcrumbs to switch back directly to the Assets tab without having to go through the Map.
For more information on filtering and locating your assets in the map, see Locate Your Assets in the Map View.