Use Statistical Trends for Your Asset Sensor Attributes and Metrics

You can study statistical trends for your asset sensor attributes and metrics using one or more Nelson Rules. These may help you analyze the consistency and predictability of your attribute values.

Trends use a set of Nelson Rules on your sensor attribute or metric values to be analyzed. For example, you may wish to analyze the trends for the pressure, temperature, or vibration sensor values of your asset. You can choose one or more of the following Nelson Rules that are relevant for your sensor attribute or metric:

  • Nelson Rule 1: One point is more than three standard deviations from the mean.
  • Nelson Rule 2: Nine, or more, points in a row are on the same side of the mean.
  • Nelson Rule 3: Six, or more, points in a row are continuously increasing or decreasing.
  • Nelson Rule 4: Fourteen or more points in a row alternate in direction, increasing then decreasing.
  • Nelson Rule 5: Two or three points in a row are more than two standard deviations from the mean in the same direction.
  • Nelson Rule 6: Four, or five, out of five points in a row are more than one standard deviation from the mean in the same direction.
  • Nelson Rule 7: Fifteen points in a row are all within one standard deviation of the mean on either side of the mean.
  • Nelson Rule 8: Eight points in a row exist, but none within one standard deviation of the mean, and the points are in both directions from the mean.

Define a Trend

You need to define a trend before the trend model can be created for the sensor attribute or metric that you wish to monitor.

  1. Click Menu (Menu icon), and then click Design Center.
  2. Select Asset Types from the Design Center sub-menu.
  3. Select an asset type from the Asset Types list.
    You can also search for an asset type.
  4. Click Trends.
  5. Click the Create Trend (Create New icon) icon.
    The Trend Detection Editor appears for the selected asset type.
    The trend detection that you define will apply to all assets of the chosen asset type.
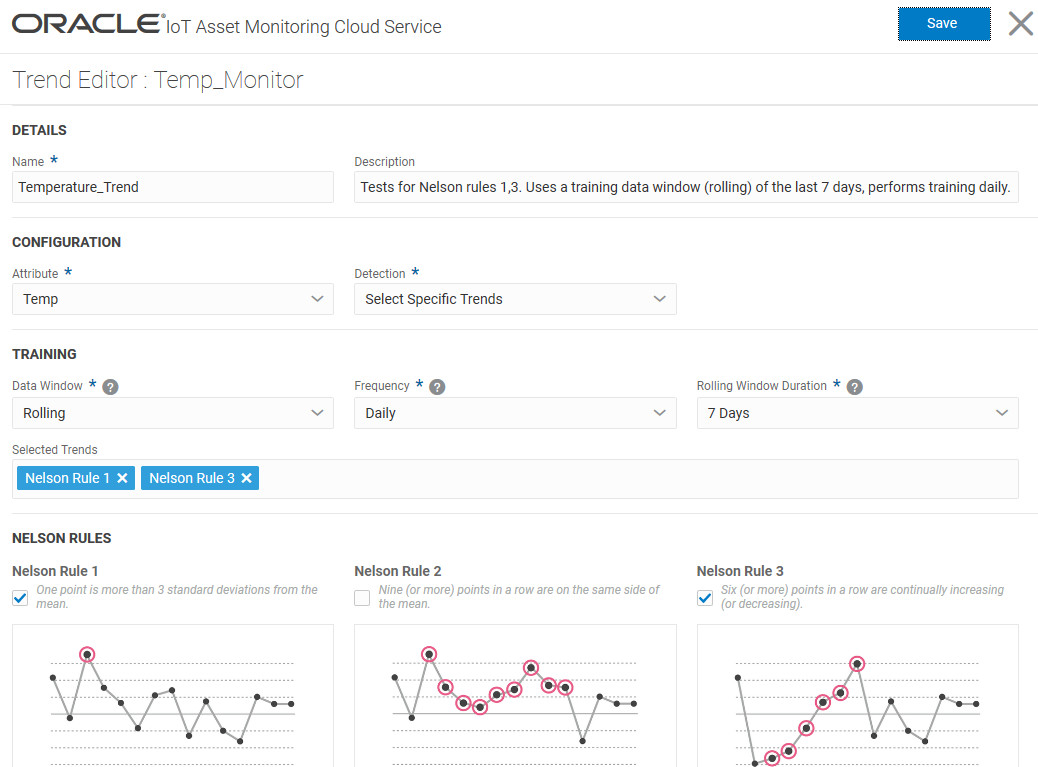
  6. Enter a name for the trend in the Name field.
  7. (Optional) Specify an optional description text for the trend.
  8. Under Configuration, select an available Attribute to monitor.
    Select from the list of asset sensor attributes and any metrics that you have defined for the asset type.
  9. Select a value for Detection:
    • Automatic: Automatically chooses trends corresponding to all available Nelson Rules.
    • Select Specific Trends: Lets you select one or more individual Nelson Rules that are relevant for your machine attribute.
  10. If you chose Select Specific Trends in the previous step, then select one or more Nelson Rules for your Trends.
    The description and graphical depiction of each rule are shown for you.
  11. Under Training, select the Data Window.

    The Data Window identifies the data set that is used to train the system for detecting trends.

    • Rolling: A rolling data window uses data from a rolling time window to pick the most recent data for training. For example, you can choose to train your trend model with a rolling data window of the last 7 days, and choose to perform the trend training daily.

      When you use a rolling window, the training model is re-created periodically, as determined by the schedule frequency that you choose.

      • Frequency: The frequency of the trend model training. For example, if you choose Daily, then the training happens every day at 00:00 hours (midnight), UTC time by default.
      • Rolling Window Duration: The duration of the rolling window going back from the model training time. For example, if you select 7 Days, then the last 7 days of specimen asset data is used to train the trend model.


      Configure Trend Page (Described in surrounding text).

    • Static: Uses a static data window to train your trend model. Select the Window Start Time and Window End Time for your static window period.

      The static data window provides data for a one-time training of your trend model. If your definition of typical data changes in the future, you should edit the Data Window for the trend, so that the model can be re-trained.

  12. Click Save to save the trend.
    The system now starts building a trend model for the new trend.
The trend is added to the Trends page. The Training Status column shows the latest training status for the trend model. Once training is complete, the application starts detecting and reporting trends.

The application reports completed model trainings along with their timestamps. For skipped training, the application includes additional information on the reasons. For example, the presence of a valid trained model may result in skipped training. If training fails, the application includes pertinent information related to the failure.
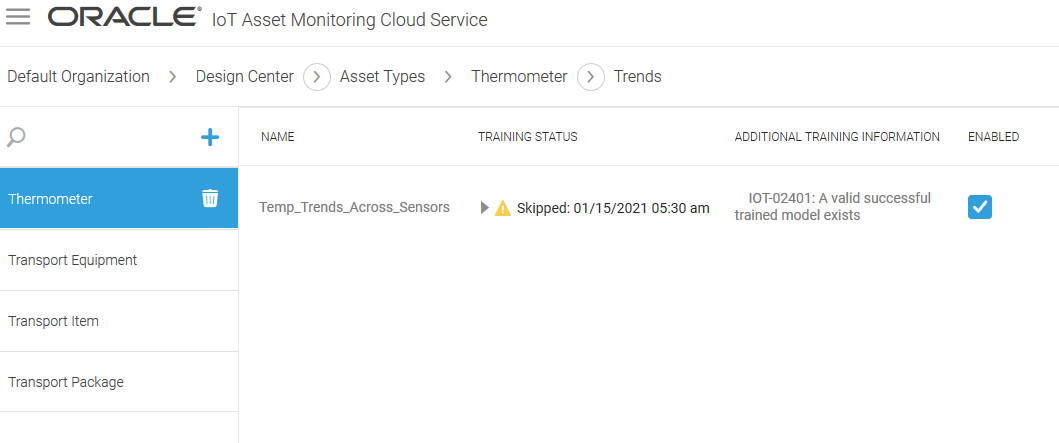

Trends showing skipped training with time stamp.

View Trends

Trends are available from the Operations Center and Asset Details page. You must have previously defined trends for your asset type.

Click Trends Trends iconin the Operations Center toolbar. Use the breadcrumbs to navigate to a group, subgroup, or asset. You can choose between the following time periods:
  • Last 1 Hour
  • Last 24 Hours
  • Last 7 Days
  • Last 30 Days

To view trends for a single asset, click Trends Trends iconin the Asset Details page toolbar.