Create Machine Clusters Based on Attribute Behavior

The IoT application can automatically cluster entities based on attribute behavior. You can choose to create a clustering configuration for a machine type. This lets IoT group entities with similar attribute behavior over the specified data window.

For example, say you have a temperature sensor entity-type, but different sensors have different normal temperature ranges, depending on whether the sensor is being used to measure ambient temperature or furnace temperature. A cluster is able to separate the ambient sensor entities from the furnace sensor entities.

The Clustering tab in Operations Center shows you the details on the clusters, including sensor values and the cluster memberships that the application creates. You can also visualize the tightness of each cluster, and the distances between individual clusters.

Create Clustering Configuration for a Machine Type

Create a clustering configuration to automatically group machines into clusters based on machine attribute behavior. You can specify a static or rolling data window to train the system for machine grouping.

  1. Click Menu (Menu icon), and then click Design Center.
  2. Select Machine Types from the Design Center sub-menu.
  3. Select a machine type from the Machine Types list.
    You can also search for a machine type.
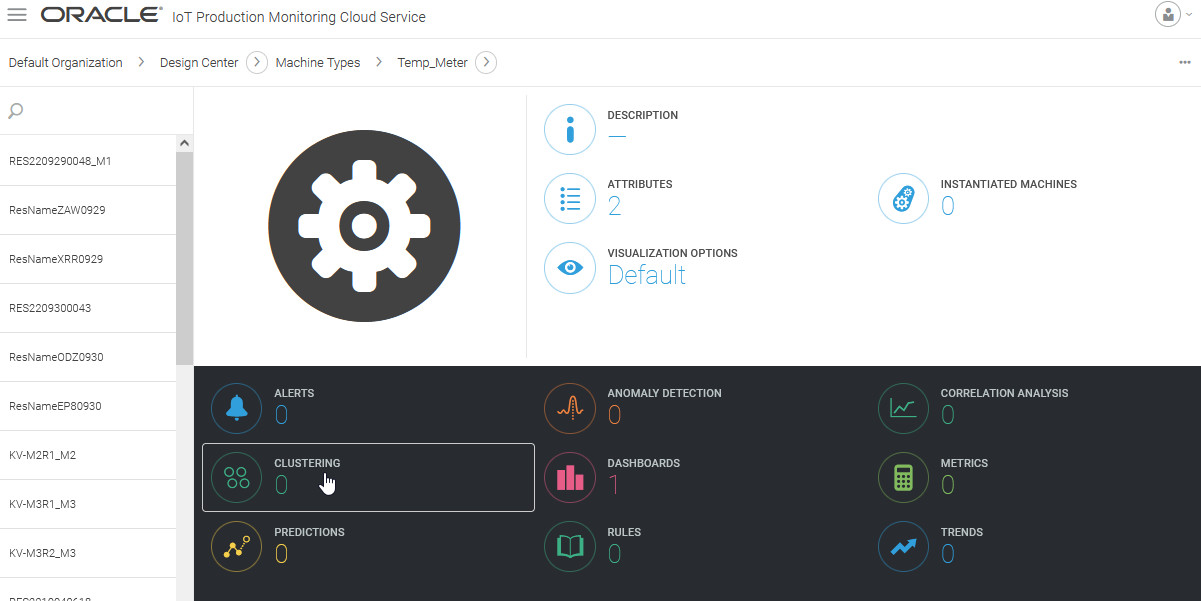
  4. Click Clustering.

    Machine Types Page: Clustering

  5. Select Create Clustering Configuration from the page menuPage Menu Icon.
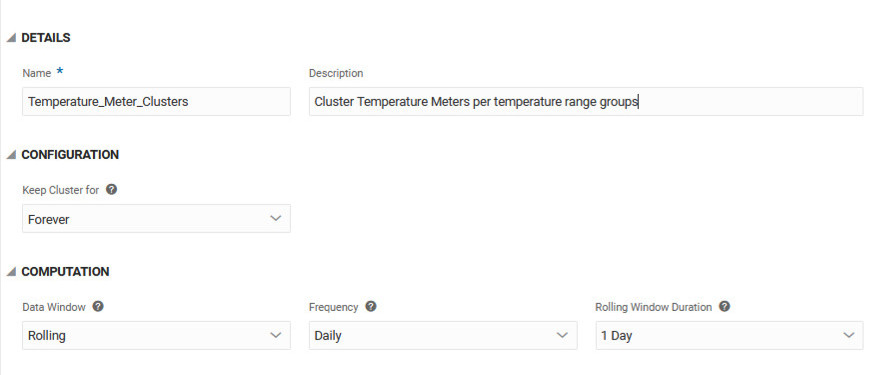
  6. Under the Details section, provide a Name and Description for the clustering configuration.

    Cluster Configuration Editor

  7. Under Configuration, specify the duration for which to keep the cluster configuration.
    The default setting Last Value Only stores only the last known configuration.
    If you have unique storage requirements for historical data related to this cluster, you can select an option that is different from the default setting.
  8. Under Computation, specify a Data Window for training the cluster configuration.
    The Data Window identifies the historical data that is used to train the system for creating clusters. Machine data collected over the data window is used to determine the clusters.
    • Rolling: A rolling data window uses data from a rolling time window to pick the most recent data for training. For example, you can choose to train your cluster configuration with a rolling data window of the last 7 days, and choose to perform the training daily.

      When you use a rolling window, the training model is re-created periodically, as determined by the frequency that you choose.

      • Frequency: You can optionally change the frequency of the cluster configuration training. For example, if you choose Daily, then the training happens every day at 00:00 hours (midnight), UTC time by default.
      • Rolling Window Duration: The duration of the rolling window going back from the model training time. For example, if you select 7 Days, then the last 7 days of target attribute data is used to train the cluster configuration.
    • Static: Uses a static data window to train your cluster configuration. Select the Window Start Time and Window End Time for your static window period.

      The static data window provides data for a one-time training of your cluster configuration. If your cluster accuracy changes in the future, you should edit the cluster configuration to choose a different static window.

  9. Click Save to create the cluster configuration.

    The system now schedules analysis for the new cluster configuration.


    Clustering Analysis Scheduled

    The clusters start appearing in Operations Center once the analysis is complete.

View Machine Clusters in Operations Center

The Clustering tab in Operations Center shows you the details on the clusters, including sensor values and the cluster memberships that the application creates. You can also visualize the tightness of each cluster, and the distances between individual clusters.

The clusters are shown at the organizational level in Operations Center.
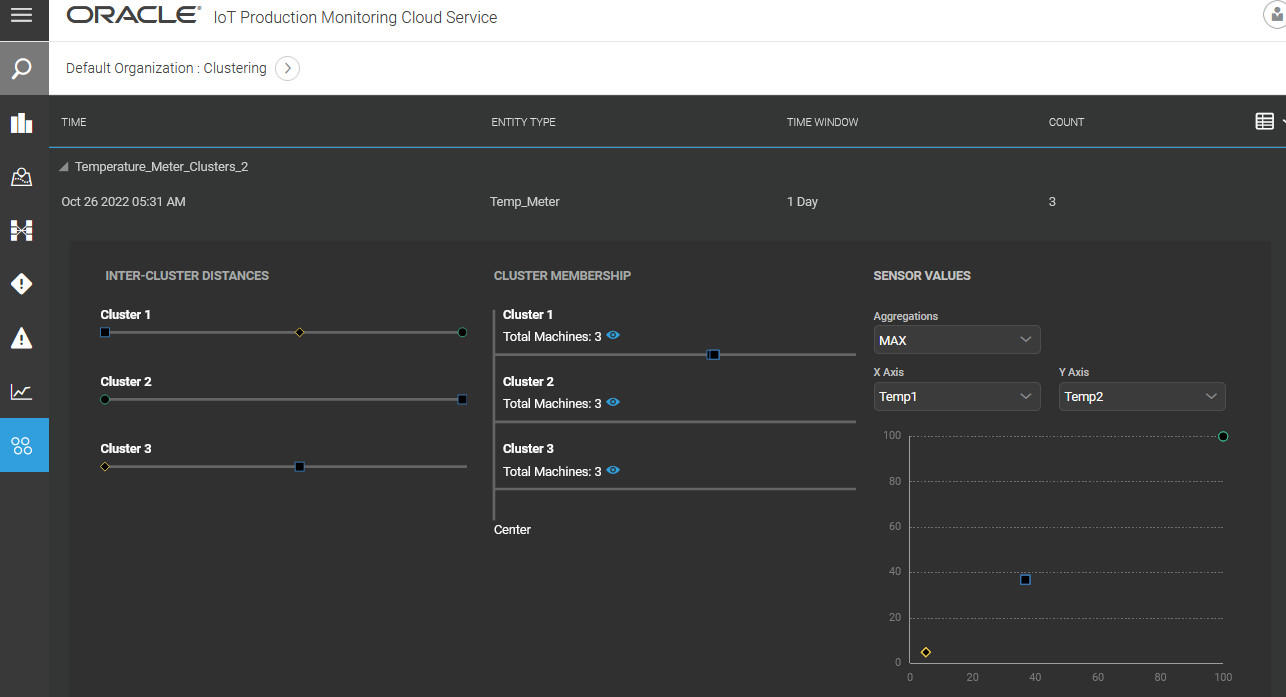

Clustering Tab in Operations Center

The cluster membership rows are ordered by cluster size.

An Inter-Cluster Distances pane appears if there are three or more clusters

You can also plot and compare aggregated values (Max, Min, Sum, Average) of sensor attributes for each cluster.