Use Correlation Analysis for Your IoT Sensor Attributes

Use correlation analysis for your machine sensor attributes to visualize and understand the relationships between the various attributes. Correlation analysis can help determine optimal operating and maintenance parameters for your machine. Correlation analysis can also help determine the variables that correlate with unexpected machine failure.

Correlation analysis lets you explore the relationships between the available IoT data measurements and get insights into machine behavior. Correlation analysis also helps perform what-if scenario analyses and root cause diagnostics. Use correlation analysis to help set up your control systems, set up multivariate anomaly detection, and state-aware anomalies.

Create a Correlation Analysis for a Machine Type

Create a correlation analysis for a machine type to study the correlation between a target sensor attribute and one or more influencing sensor attributes.

You can apply the correlation analysis to all machines of the machine type, or apply it to specific machines that you wish to study. Use the Machine Types page in Design Center to create the correlation analysis.
  1. Click Menu (Menu icon), and then click Design Center.
  2. Select Machine Types from the Design Center sub-menu.
  3. Select a machine type from the Machine Types list.
    You can also search for a machine type.
  4. Click Correlation Analysis.
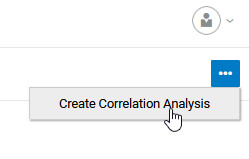
  5. On the Correlation Analysis page, select Create Correlation Analysis from the Correlation Analysis menu.


    Correlation Analysis menu

    The Correlation Analysis editor appears.

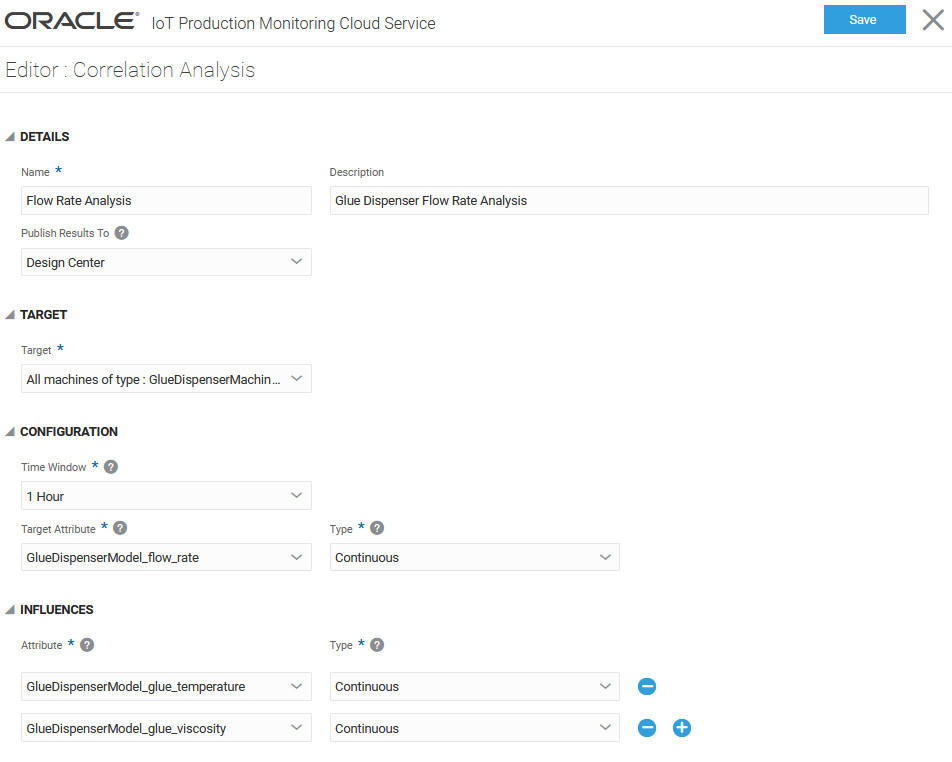
  6. In the Correlation Analysis editor, specify a Name and Description for the correlation analysis under the Details section.
  7. Select a value for the Publish Results To field.
    When first creating a correlation analysis, you may want to publish it to Design Center only. After you have viewed and analyzed the results, you may want to edit the value to Operations Center, so that the results appear in the Operations Center view as well.
  8. Under Target, choose whether you want the analysis to apply to all machines or specific machines of the machine type.
    Select All machines of type: MachineType to apply the analysis to all machines. Alternatively, select Specific machines of type: MachineType to choose the specific machines to analyze.
  9. Under Time Window in the Configuration section, choose the time duration for which to analyze the data.
    For example, choosing One Hour will analyze the last hour's data for the chosen machines when you run the analysis.
  10. Under Target Attribute, select the sensor attribute that you wish to analyze.
  11. Choose the data Type for the target attribute.
    Choose Continuous if the attribute can take continuous real numbered values. For example, 10.6. Choose Categorical if the attribute can take only discrete values. For example, values such as 'High', or '100'.
  12. Under the Influences section, select one or more sensor attributes that can influence the target attribute.
    After selecting each Attribute, select the corresponding type, continuous or categorical, before adding another influencing attribute.
    You can add both continuous and categorical influencing attributes.

    The following correlation analysis editor shows a correlation analysis created to observe the effects of change in viscosity and temperature on the flow-rate for a glue dispenser machine.


    Correlation Analysis Editor

  13. Click Save to create the correlation analysis.
The correlation analysis appears as a new row on the Correlation Analysis page for the machine type.

Run and View a Correlation Analysis

Run a correlation analysis in Design Center to study the correlation between the selected target and influencing attributes. Depending on your correlation settings, the results of the analysis can also be viewed in the Operations Center.
You can run a previously created correlation analysis from the Correlation Analysis page for the machine type.
  1. Navigate to the Correlation Analysis page for your machine type.
    Click Menu > Design Center > Machine Types > Machine Type Name > Correlation Analysis to navigate to the correct page.
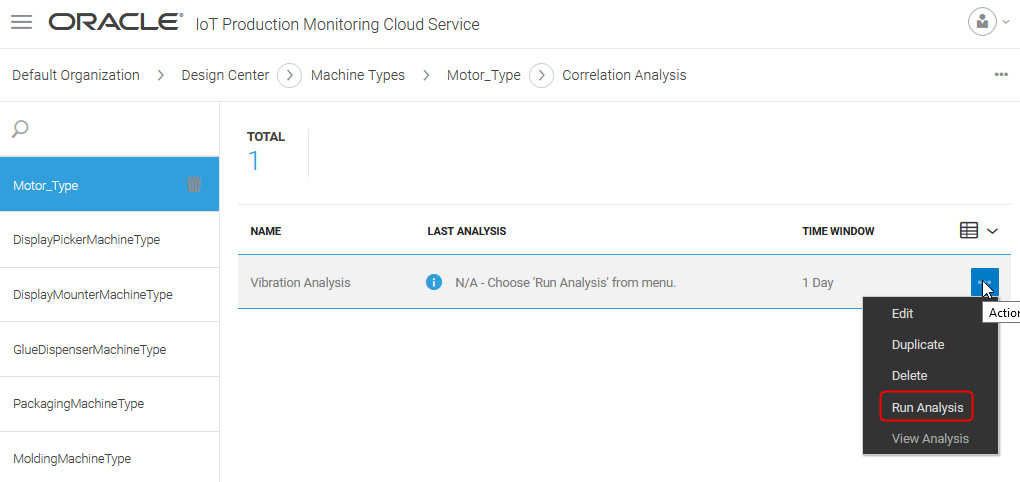
  2. Select Run Analysis from the Actions menu for the correlation analysis row.


    Run Correlation Analysis

    Note:

    You can also Edit the correlation analysis settings from the Actions menu.
    The Last Analysis column status changes to Computation in Progress.
    The computation takes between a few seconds to a few minutes. If you navigate away from the page and navigate back to it, you should see the last analysis status as complete along with the timestamp when the analysis completed.
  3. To view a completed analysis, click the Actions menu against the correlation analysis row, and select View Analysis.
    The results of the correlation analysis between the target attribute and each influencing attribute appears. For each pair of target and influencing attribute, a correlation value between 0 (no observable correlation) and 1 (close correlation) is returned.

    For each pair of target and influencing attribute, a chart of correlation data is returned. You can also perform additional range analysis by manually selecting the range of values of interest.

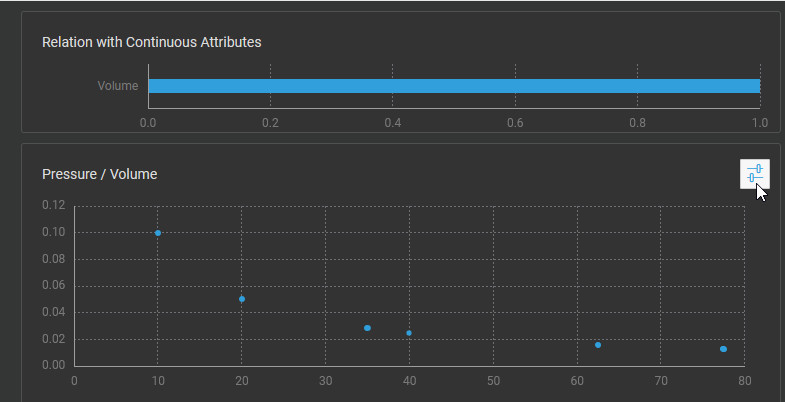
    The following example shows a correlation analysis between the Pressure and Volume sensor attributes.


    Correlation analysis between pressure and volume attributes

    A close correlation can be seen between the attributes, as the pressure decreases with increasing volume.

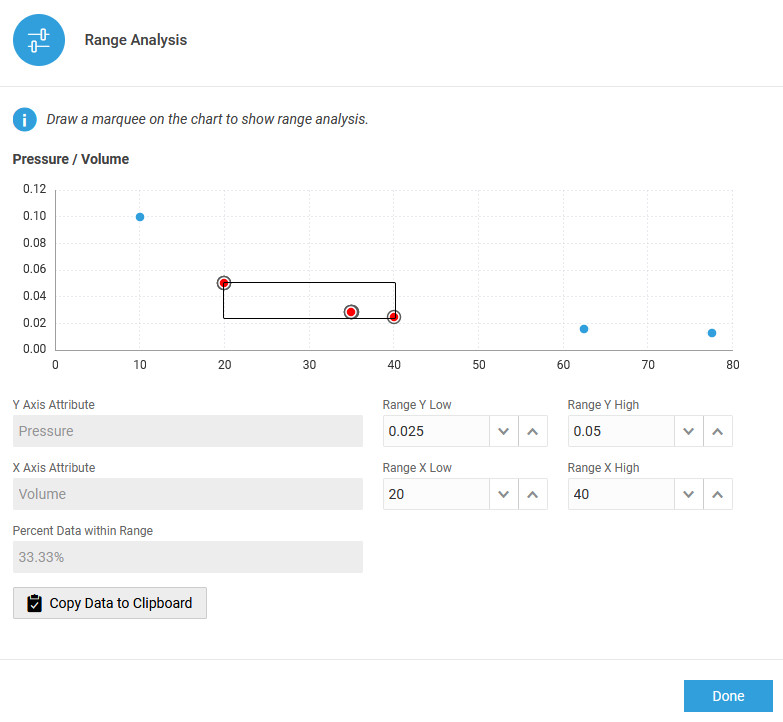
    Selecting the Range Analysis button lets you manually select the values of interest.


    Range Analysis

    The following example shows the correlation analysis for a glue dispenser. The correlation of the flow rate attribute is studied against the temperature attribute.


    Correlate Glue Flow Rate and Temperature

    As evident from the correlation chart, there is a strong correlation between flow-rate and temperature: The flow rate increases, almost linearly, with temperature. If the ideal flow rate is between 0.9 and 0.14, then the temperature should be maintained between 150 and 160.

  4. To view the correlations in Operations Center, click Correlations in the Operations Center menu bar.
    To navigate to Operations Center, click Menu > Operations Center.

    Note:

    The Correlations button appears in the Operations Center menu bar if you have chosen to publish the results of the correlation analysis to the Operations Center in the correlation analysis settings.


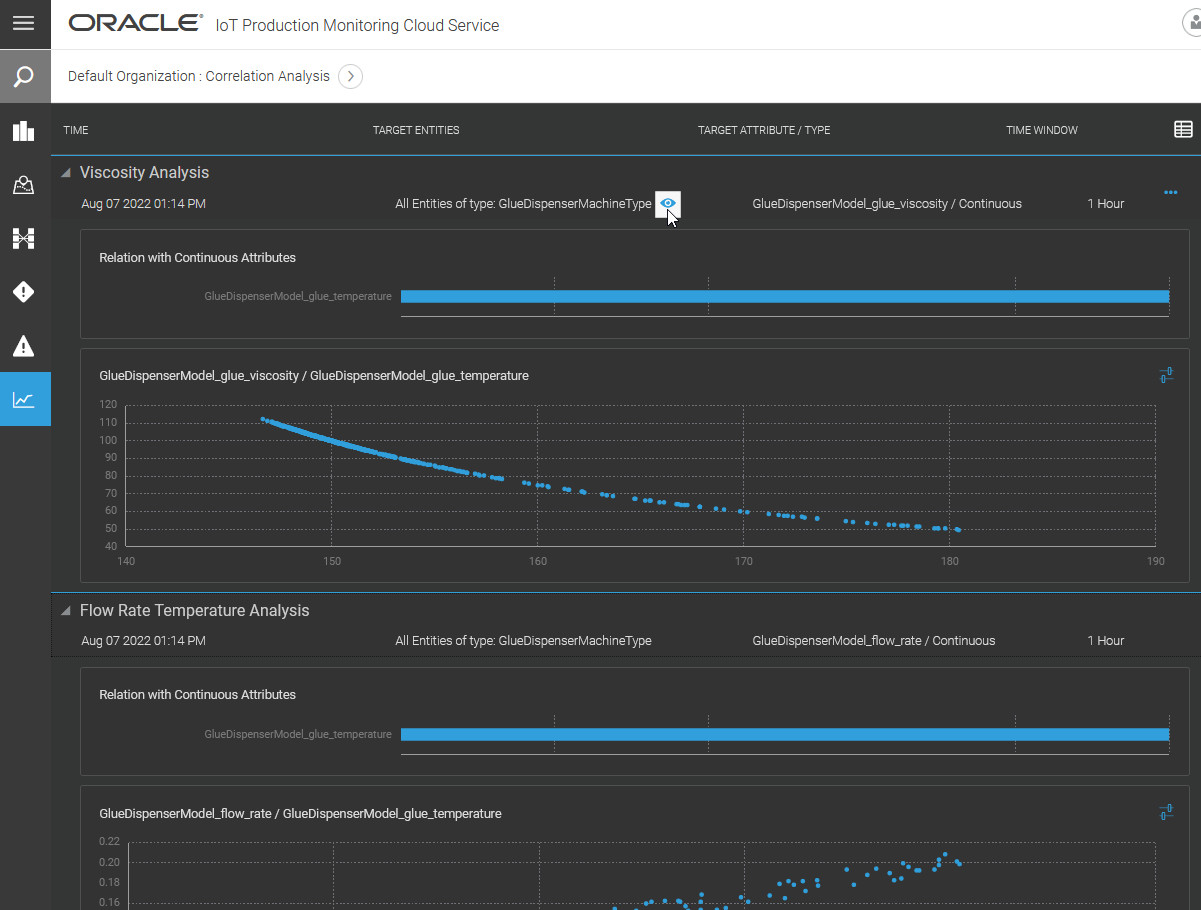
    Correlations in Operations Center

    Click the View Show Details icon icon under Target Entities to select and view the correlation analysis for a specific machine.