Use Anomalies to Track Deviations in Machines and Factories

When the set parameters of a machine or factory do not conform to a regular pattern, an anomaly occurs. An anomaly can help you identify and resolve potential problems with your machines and factories.

Use anomalies to detect deviations from normal behavior, and to flag and address issues in time. As a factory manager, you can also detect anomalies for data streams where the data is not normally distributed (non-Gaussian distribution).

You can define the following types of anomalies:

  • Automatic Anomaly: Use an automatic anomaly to automatically look for deviations in a sensor or metric (KPI) value. For example, automatic anomalies can help detect a machine that is overheating.

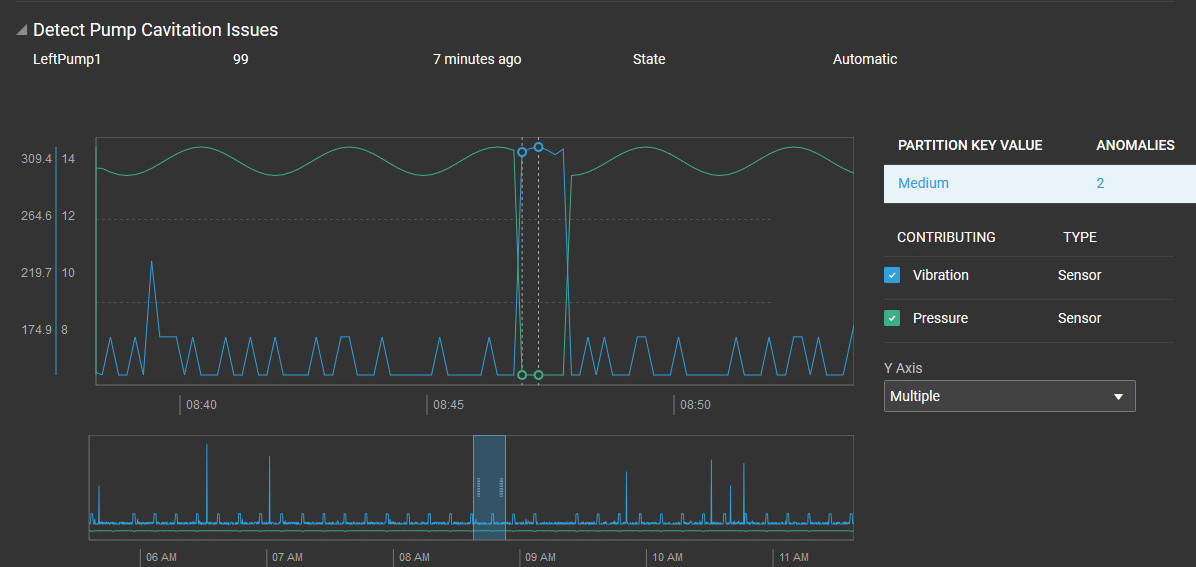
    Sometimes, a set of correlated sensor signals can help identify issues with your machine. For example, a drop in pressure readings coupled with an increase in vibration may indicate cavitation issues in a pump. You can use multivariate automatic anomalies to monitor multiple sensor attributes and metrics simultaneously. Use the Operations Center to view the reported anomalies on the timeline, together with the key signals from your chosen sensor and metric attributes.

    Machine sensor values can depend on the machine state. For example, an idling motor has different vibration measurements from a motor running with load. Machine sensor values may also vary with the current process, product being produced, or environmental attributes. For example, the baseline fuel consumption may depend on the ambient temperature. The injection pressure of a molding machine may depend on whether it is currently molding steel or aluminum bottles.

    If the current machine state determines the threshold sensor values for your anomalies, you can use partition key attributes to partition your anomalies. For example, you can create partitions to look at vibration anomalies when the motor is working, and ignore states where the motor is idling, or under maintenance.

    See Define an Automatic Anomaly for more information on defining automatic anomalies.

  • User-Defined Anomaly: Create a user-defined anomaly to look for telltale patterns in sensor or metric data generated by a machine. For example, you may create anomalies to look for vibration anomalies in a packaging machine. User-defined anomalies are based on acceptable or anomalous data patterns. You train the system by providing it with samples of acceptable data or anomalous data. These samples can come from sensor or metric data.

    For acceptable data, you specify a time window containing acceptable patterns of sensor or metric data. The time window is a period of typical operations during which your machines, and associated sensors, behaved normally. The system uses the data pattern that you select to train itself. During day-to-day operations, the system looks out for deviations in data patterns that are beyond the specified deviation percentage, and flags these as anomalies.

    For anomalous data, you train the system by providing it with samples of anomalous data patterns from existing sensor or metric data.

    See Create a User-Defined Anomaly for more information on defining user-defined anomalies.

View Anomalies

View the anomalies for a machine or factory to identify any unusual behavior that might affect the performance of your machine or factory.

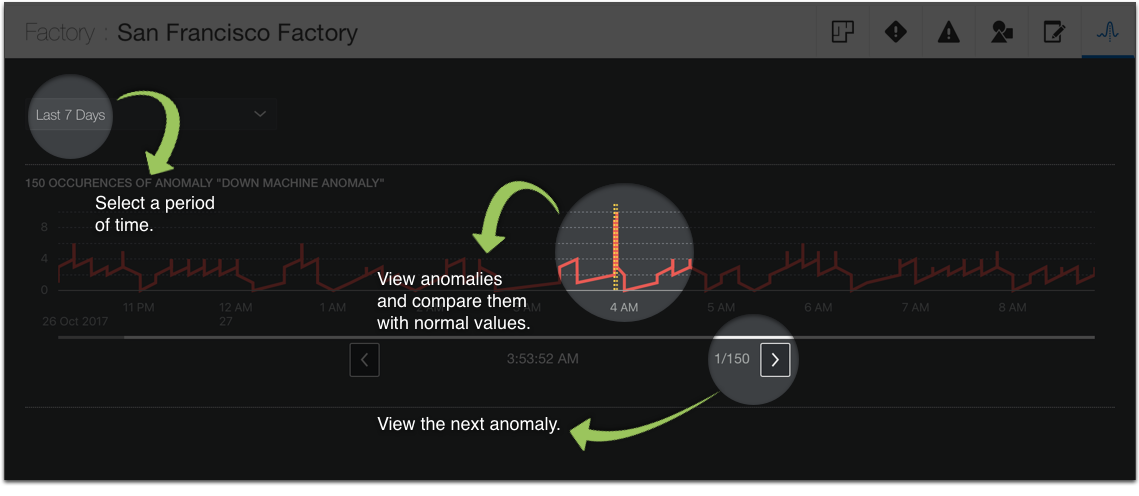
In the Factory view, select the Anomalies Anomalies icon tab. Then select a period to view, you can view the anomalies for the last hour, the last day, the last week, or the last month. Use the arrows to view the next or the previous anomaly.

Anomalies are displayed with a different color and a dotted line. The solid lines shows the normal values. Use the normal values to understand the importance of the anomalies you are viewing.

The horizontal axis shows the time so that you can identify the time at which the anomaly occurred. Browsing through the different anomalies you can also find out their frequency.

This image shows you the available actions in the Anomalies view:
This image is described in the surrounding text.

The following Operations Center view shows multivariate anomalies for a pump device. Notice that you can select the sensor signals that you wish to view in the chart. If you are using partition key values corresponding to asset states, then you can select the relevant partition key as well.

Note:

To view anomalies for a specific factory or machine in Operations Center, use the breadcrumbs to navigate to your factory or machine, and click the Anomalies Anomalies Icontab.

If the sensor values are disparate, you can choose multiple y-axes, so that you can see each signal using the correct scale.

Anomalies page, described in text.

Define an Automatic Anomaly

Define an automatic anomaly to automatically identify deviations in sensor attributes or metrics.

  1. Click Menu Menu icon and then click Design Center.
  2. Select Organization from the Design Center menu.
  3. Click Anomaly Detection Anomaly Detection icon.
  4. Click Create Anomaly Create Anomaly icon.
    The Anomaly Detection Editor appears.
  5. Enter a name for the anomaly in the Name field.
  6. (Optional) Specify an optional Description text for the anomaly.
  7. (Optional) Select a value under Keep Metric Data For.
    If you have unique storage requirements for historical data related to this anomaly, you can select an option that is different from the global settings defined under Storage Management on the application Settings page.
    For example, if you are calculating anomalies across a large number of machines, and the anomaly data is not required beyond a month, then you can select 30 Days under Keep Metric Data For to optimize storage.
  8. Select the Machine Type for your anomaly.

    The anomaly applies to all machines of the chosen machine type.

    Note that you can also select All Factories if you wish to choose a pre-defined factory metric as the attribute.

  9. Under Detection, select Automatic Anomaly as the Detection Method.

    Use an automatic anomaly to automatically look for deviations in a sensor or metric (KPI) value. For example, automatic anomalies can help detect a machine that is overheating intermittently.

  10. Under Detection, select one or more available Target Attributes/Metrics to monitor.
    The list of attributes includes sensor attributes and query-type (computed) metrics.

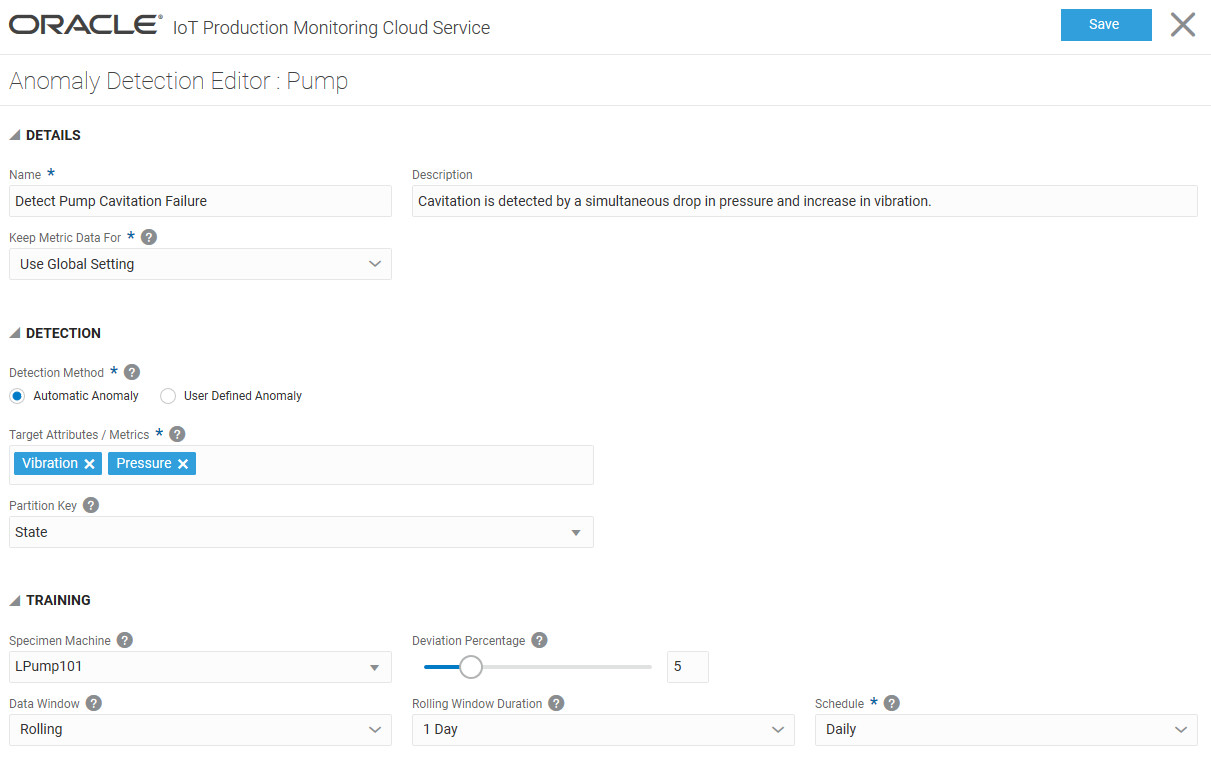
    The following example uses the Vibration and Pressure sensor attributes:


    Anomaly Detection Editor: Described in text.

    In case you selected All Factories under Machine Type, then the following list of pre-defined factory metric attributes is available:
    • Total Machines Down: Number of unavailable machines in the factory.

    • Total Idle Machines: Number of machines in idle state in the factory.

    • Machines in Use Percentage: Percentage of machines in use in the factory.

    • Machines Idle Percentage: Percentage of machines in idle state in the factory.

    • Machines Down Percentage: Percentage of unavailable machines in the factory.

    • Total In Use Machines: Number of machines in use in the factory.

  11. (Optional) If you have defined sensor attributes that can be used as partition keys to determine the machine state, then you can choose the Partition Key.
    For example, you may have defined a sensor attribute called State to determine whether the machine is currently running, idling, or under maintenance.

    Note:

    The machine type must have at least one sensor attribute that can be used as the partition key. See Create Machine Types for more information on sensor attributes.
  12. Under Training, select a Specimen Machine that provides the training data for anomaly detection.

    Note:

    If you selected All Factories under Machine Type, then the Specimen Factory field appears in place of Specimen Machine.

    A list of all machines with the selected machine type appears. The machine with the most data is chosen by default. You can choose a different machine if required.

  13. Under Training, select a Deviation Percentage.

    The deviation percentage is the threshold deviation percentage in attribute value that triggers the anomaly.

    If you are using multiple Target Attributes and/or Partition Key, then the deviation percentage refers to the percentage of anomalous data that triggers the anomaly.

    Use the slider to set a value, or enter a value manually.

  14. Under Training, select the Data Window.

    The Data Window identifies the data set that is used to train the system for anomaly detection.

    • Static: Uses a static data window to train your anomaly model. If you have golden data from a period when your machine worked normally, you can use the same to specify a static window. Select the Window Start Time and Window End Time for your static window period.

      The static data window provides data for a one-time training of your anomaly model. If your definition of normal data changes in the future, you should edit the Data Window for the automatic anomaly, so that the model can be re-trained.

    • Rolling: A rolling data window uses data from a rolling time window to pick the most recent data for training. For example, you can choose to train your anomaly model with a rolling data window of the last 7 days, and choose to perform the anomaly training daily.

      When you use a rolling window, the training model is re-created periodically, as determined by the schedule frequency that you choose.

      • Rolling Window Duration: The duration of the rolling window going back from the model training time. For example, if you select 7 Days, then the last 7 days of specimen machine data is used to train the anomaly model.
      • Schedule: The frequency of the anomaly model training. For example, if you choose Daily, then the training happens every day at 00:00 hours (midnight), UTC time by default.
  15. Click Save.
  16. Close the Anomaly Detection Editor window.

The anomaly is added to the Anomaly Detection page. The Training Status column shows the latest training status for the anomaly model. Once training is complete, the application starts detecting and reporting anomalies.
Create a User-Defined Anomaly

Create a user-defined anomaly to look for patterns in sensor data generated by a machine.

  1. Click Menu Menu icon and then click Design Center.
  2. Select Organization from the Design Center menu.
  3. Click Anomalies Anomalies icon.
  4. Click Add Add icon.
  5. Enter a name for the anomaly in the Name field.
  6. (Optional) Specify an optional Description text for the anomaly.
  7. (Optional) Under Configuration, select a value under Keep Metric Data For.
    If you have unique storage requirements for historical data related to this anomaly, you can select an option that is different from the global settings defined under Storage Management on the application Settings page.
    For example, if you are calculating anomalies across a large number of machines, and the anomaly data is not required beyond a month, then you can select 30 Days under Keep Metric Data For to optimize storage.
  8. Under Configuration, select the Machine Type for your anomaly.

    The anomaly applies to all machines of the chosen machine type.

    Note that you can also select All Factories if you wish to choose a pre-defined factory metric as the attribute.

  9. Select an available Attribute to monitor.

    The list of attributes includes sensor attributes and query-type (computed) metrics.

    If you selected All Factories under Machine Type, then the following list of pre-defined factory metric attributes is available:
    • Total Machines Down: Number of unavailable machines in the factory.

    • Total Idle Machines: Number of machines in idle state in the factory.

    • Machines in Use Percentage: Percentage of machines in use in the factory.

    • Machines Idle Percentage: Percentage of machines in idle state in the factory.

    • Machines Down Percentage: Percentage of unavailable machines in the factory.

    • Total In Use Machines: Number of machines in use in the factory.

  10. Under Method, select User Defined Anomaly.

    Create a user-defined anomaly to look for telltale patterns in sensor or metric data generated by a machine. For example, you may use manual anomalies to look for vibration anomalies in a packaging machine. User-defined anomalies are based on acceptable or anomalous data patterns. You train the system by providing it with samples of acceptable data or anomalous data. These samples can come from sensor or metric data.

  11. Select a Specimen Machine that provides the data pattern for anomaly detection.

    A list of all machines with the selected machine type appears. The machine with the most data is chosen by default. You can choose a different machine if required.

  12. Under Training, choose a Selection Type, and complete the corresponding steps.
    • Choose Anomalous Data to select an anomalous data pattern from existing sensor or metric data.

      1. (Optional) Change the Data End Time for the chart, if required. The current date and time are automatically populated.

      2. Click Generate Chart to display the sensor or metric data for the selected attribute and asset.

        The data plot for the selected machine attribute appears.

      3. Use the mouse to select the anomaly pattern in the data plot.


        Anomaly selection

        You can zoom in and zoom out in the data plot area. You can also navigate along the time axis using the Next and Previous buttons.

        If you wish to change the selected pattern, you can select another pattern in the data plot and the first pattern is deselected.

      4. Click Save to save the anomaly.

    • Choose Acceptable Data to select acceptable or non-anomalous data from existing sensor or metric data.

      1. Select a Deviation Percentage.

        This is the percentage of deviation required to trigger an anomaly.

      2. Specify a Data Start Time and Data End Time to plot the chart.

        This is the broad time period that contains acceptable, or non-anomalous, attribute data.

      3. Click Generate Chart to display the sensor or metric data for the selected attribute and time period.

        The data plot for the selected asset attribute appears.

      4. Click within the left-half chart to select the start time.

        This marks the beginning of acceptable, or non-anomalous, data.

      5. Click within the right-half chart to select the end time.

        This marks the end of the sample (acceptable) data.


        Selecting acceptable data

      6. Click Save to save the anomaly.