View and Contextualize Sensor Data for a Specific Machine

Analyze the sensor data to identify the cause the production issues in a specific machine. You can also compare the sensor data to other data to understand the values gathered by that sensor.

  1. In the Factory view, select the Floor Plan Floor Plan icon or Production Production icon tab, then select a metric, and then click Sensors Sensors icon.
    The graphic will remain empty until you select a sensor attribute.
  2. From the Time Period list, select the the period of time that you want to monitor.
    You can view live data, or the historical data for the last day, the last week, or the last month.
  3. From the Sensor Attributes list, select one or more sensor attributes to monitor.
  4. From Add Comparative Data select one or more options to contextualize the sensor data:
    • Behind Plan
    • State Changes
    • Products Manufactured

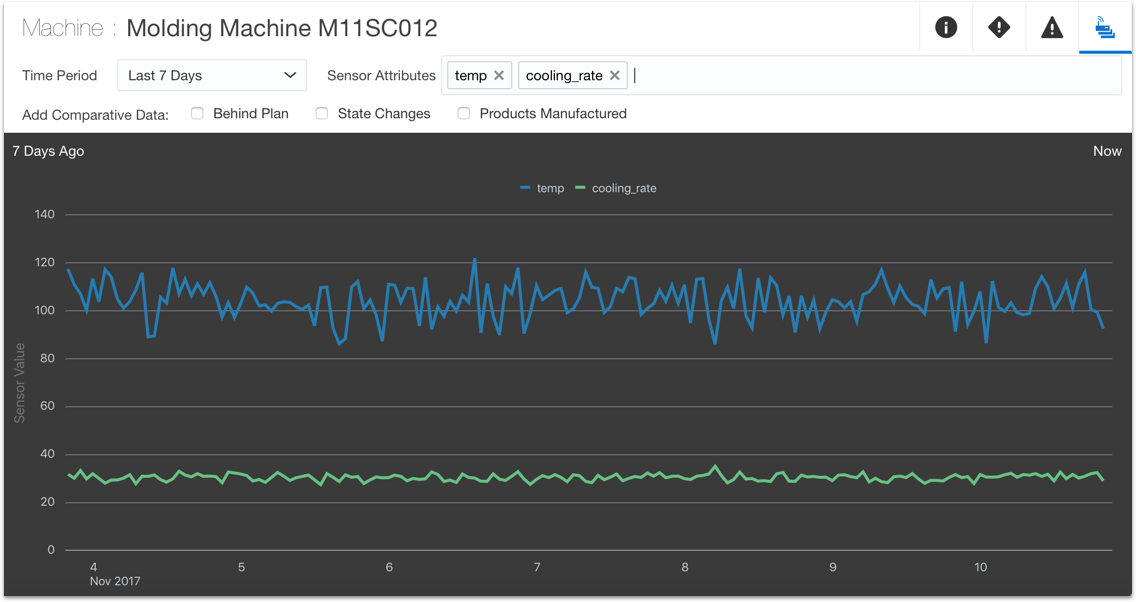
The following image shows a graphic of the temperature and cooling rate values for the sensors in the Molding Machine M11SC012 for the last week. You can use these values to understand why this machine is currently unavailable.
This image is described in the surrounding text.