View Machine Info and Sensor Data for a Machine

View the real-time and historic sensor data for a specific machine. You can compare different sensor attribute values to study correlation. You can also analyze the effects of sensor data variations on machine state changes and production quantities.
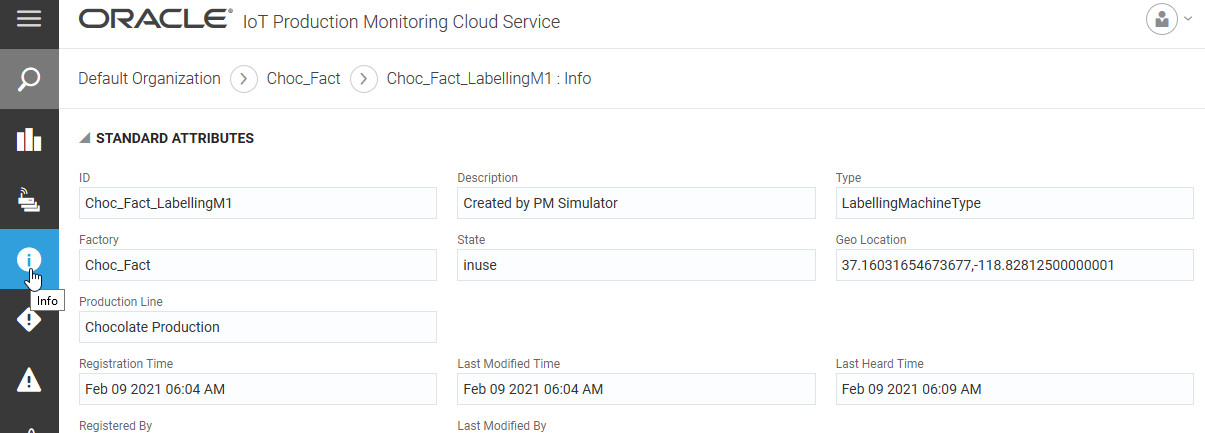
  1. Click the Info tab Info Icon from the machine view.
    In Operations Center, use the breadcrumbs to navigate to a specific machine in the factory. You can also click the machine in the factory Floor Plan Floor Plan icon view or the Production Product icon view.

    Machine Info Page with standard attributes.

    The Info page lets you view the standard machine attribute values, such as registration time-stamp and production line name, at a glance. You can also view any custom attribute values that may be present.

  2. To view sensors for the machine, click the Sensors tab Sensors iconfrom the machine view.
  3. From the Time Period list, select the time period for which you want to view the performance of your machine.
    The following options are available:
    • Live
    • Last 1 Hour
    • Last 24 Hours
    • Last 7 Days
    • Last 30 Days

    Note:

    When selecting time periods for your sensor and metric charts, the values available depend on the data life spans for your sensor and metric data. You can view data up to a maximum of six months if the data life span for your sensor and metric data exceeds six months.
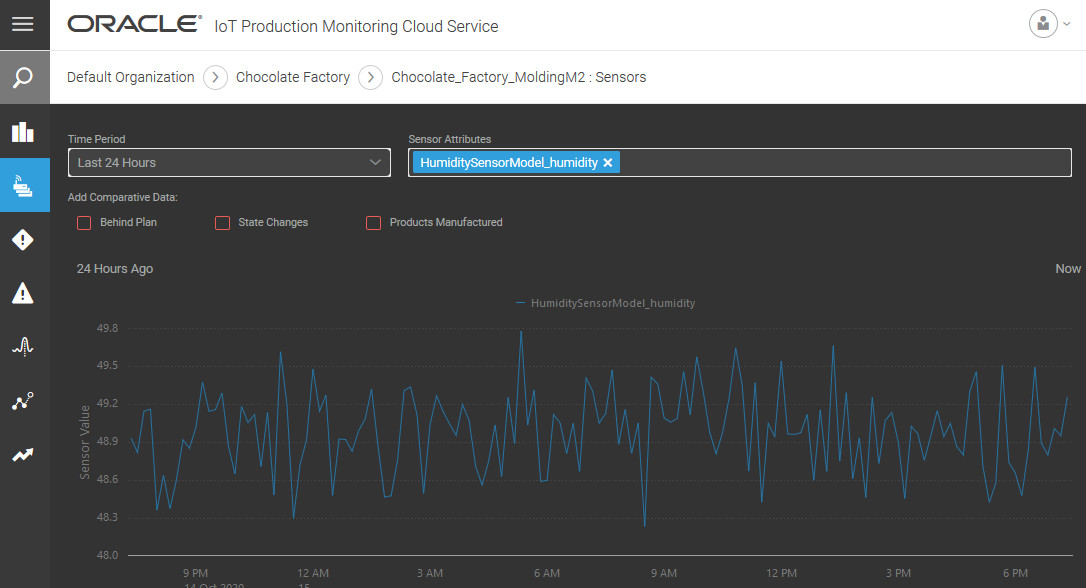
  4. From the Sensor Attributes list, select the sensor attribute name.

    Sample sensor data for humidity over 24 hours.

    You can select more than one attribute if you wish to compare two or more attributes. For example, you may wish to compare the effect of temperature changes on the humidity values.
  5. (Optional) Add optional comparative data to study the effects of sensor data variations on machine state changes and production quantities.
    • Behind Plan: Superimposes Behind Plan system metric data on the sensor chart. Lets you see the effects of sensor data on production.

      For example, you may see a flattening of the Behind Plan curve with rising engine vibrations. This may indicate that engine performance is affecting the rate of production.

    • Stage Changes: Superimposes State Changes system metric data on the sensor chart. Lets you see the effects of sensor data on machine state.

      For example, you may notice that rising engine temperature is leading to the machine going down.

    • Products Manufactured: Superimposes Products Manufactured system metric data on the sensor chart. Lets you see the effects of sensor data on production.

      For example, you may notice that increased glue viscosity values are leading to a reduction in the number of units produced.