Monitor a Specific Machine
For each of your machines, you can view the machine metrics on the main dashboard. You can also look at sensor data, incidents, warnings, predictions, anomalies, and trends for the machine.
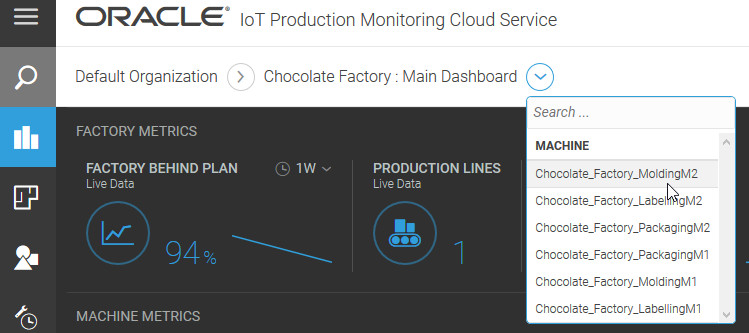
In the Operations Center factory view, use the breadcrumbs to navigate to a specific machine in the factory. You can also click the machine in the factory Floor Plan ![]() view or the Production
view or the Production ![]() view.
view.
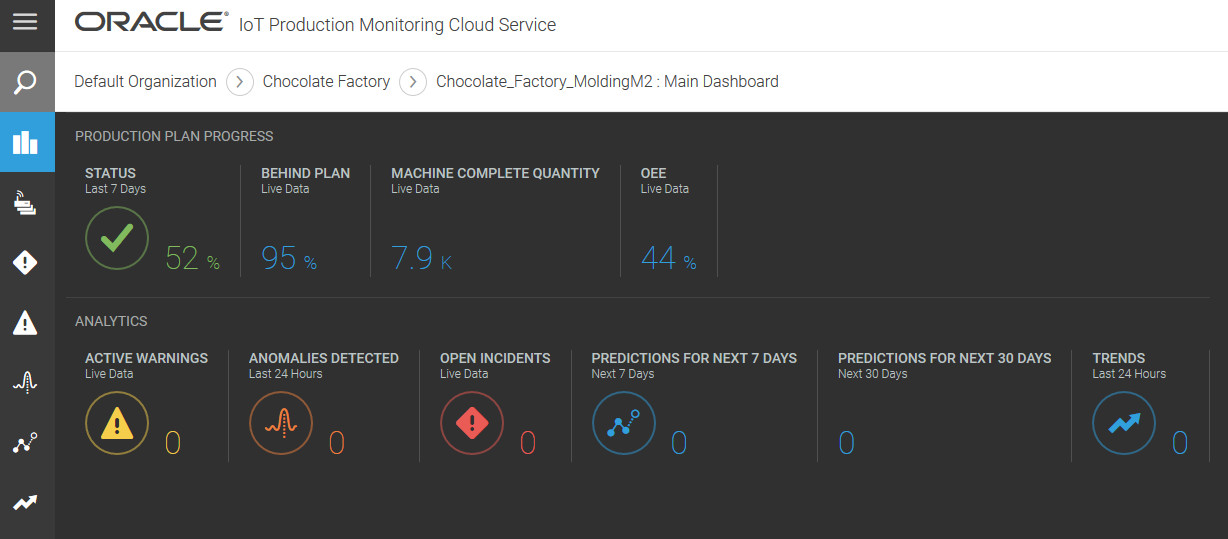
The main dashboard for the machine appears by default. The dashboard shows the real-time and historic performance data for the machine.

The ready-to-use dashboard includes common machine metrics. The following table describes the default metrics that appear.
| Metric | Description |
|---|---|
| Behind Plan |
The percentage of the production plan that remains to be completed. When production first starts, all machines are 100% behind plan. A machine reaches 0% when all product units assigned to it have been produced. Click the metric to see a chart of Behind Plan statistics over time. You can select the desired time Period. You can also filter the chart by product if a machine produces multiple product types. |
| Status |
The percentage of time that this machine has been in use during the specified period of time. Click the metric to see the Status over time. You can select the desired time Period. You can choose to see the percentage of time that the machine was idle or down. |
| Machine Complete Quantity |
Shows the number of product units produced by the machine Click the metric to see a chart of completed units over time. You can select the desired time Period. You can also filter the chart by product if a machine produces multiple product types. |
| OEE |
This value specifies the overall equipment effectiveness. Click the metric to see a chart of OEE values over time. The OEE values include the availability, quality, and performance percentages for the machine. You can select the desired time Period. You can also filter the chart by product if a machine produces multiple product types. |
You can include other system metrics by editing the dashboard for the machine type in Design Center. For example, you can add system metrics for the number of scrap or reject product quantities produced by the machine. You can also add custom metrics to the dashboard.
Note:
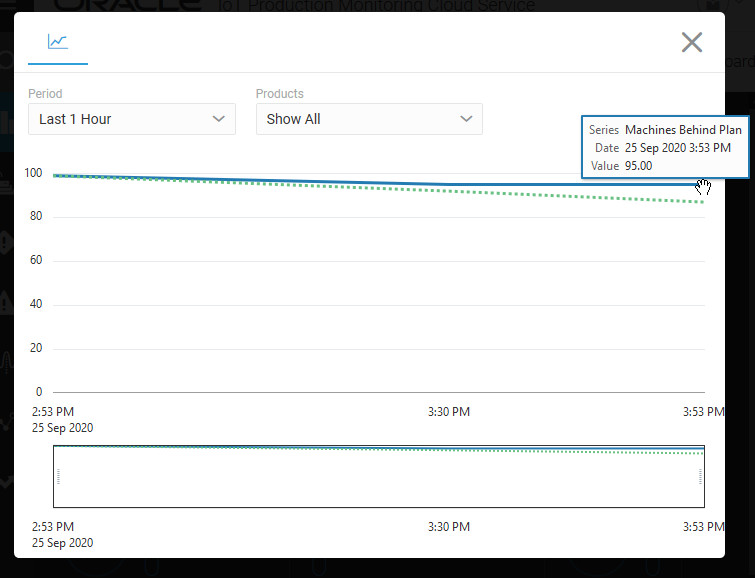
You can create additional custom dashboards for a machine type in Design Center.Click a metric to open its corresponding chart. You can choose predefined or custom time periods for your charts. If a machine manufactures more than one product, you can also filter the chart by product. The following chart shows the Behind Plan percentage and compares it with the best machine in the factory.

Note:
When selecting time periods for your sensor and metric charts, the values available depend on the data life spans for your sensor and metric data. You can view data up to a maximum of six months if the storage life span for your sensor and metric data exceeds six months.Close the chart window to return to the main dashboard.
The main dashboard also shows the count of active warnings and open incidents for the machine. If you have configured anomalies for the machine, then any detected anomaly count is displayed. If you have configured predictions and trends, then the existing prediction and trend count is displayed.
Click an item to see more details on it. For example, click the trend count to go to the Trends page.
In addition to the main dashboard, there are several tabs, or views, available for your factory. The following table summarizes these tabs.
| Tab Name | Icon | Description |
|---|---|---|
| Main Dashboard |
View the machine metrics at a glance. Click a metric to see details. You can customize the factory dashboard in the Design Center to add or remove metrics. |
|
| Sensors | View sensor data and charts for the sensors associated with the machine. | |
| Info | View the standard machine attribute values, such as registration time-stamp and production line name, at a glance. You can also view the custom attribute values. | |
| Incidents |
View the incidents report for this machine. You can filter the list of incidents by specifying one or more search parameters. |
|
| Warnings |
View the warnings report for this factory. You can filter the list of warnings by specifying one or more search parameters. |
|
| Anomalies |
View the anomalies report for the machine. |
|
| Predictions | View the predictions for the machines. | |
| Trends | View sensor data trends for the machine. | |
| Search | Lets you search for other machines, factories, and locations. |