2Work with Loyalty Subject Areas
This chapter contains the following:
Manage Analytics in BI for Loyalty Cloud
As a Loyalty administrator, your main work area for analytics is Business Intelligence (BI). To create new Loyalty analytics, and to edit prebuilt Loyalty analytics, you navigate from the Home Page to BI.
To navigate to BI:
-
Open Tools, and select Reports and Analytics.
-
In the Reports and Analytics pane, select Browse Catalog.
Create Analytics with Loyalty Subject Areas
You create analytics for Loyalty in Oracle Business Intelligence (BI) Answers using the default ready-to-use subject areas. You can build your own analyses, as well as your own subject areas.
For detailed descriptions of the Oracle Loyalty Cloud subject areas, how to use those subject areas to answer business questions, and for information on the security roles associated with the subject areas, see Oracle Loyalty Cloud Subject Areas for Transactional Business Intelligence in Loyalty.
Understand Loyalty Subject Areas
Creating an analysis begins with subject areas. A subject area is a grouping of information pieces, or more technically, a grouping of data objects, that relate to each other in a particular context. Examples of such context are member, member status, referral status, transactions, and so on.
Data objects for a subject area are pulled from your transactional database and then grouped together in a way that answers a specific set of questions about your loyalty program. Every time someone adds loyalty information, and saves the information, you can use that information to build real-time and historical analyses. You can group anything that involves a loyalty transaction into a subject area, and then build analytics that expose key metrics for your loyalty program.
Work with Loyalty Subject Areas
BI builds standard subject areas from loyalty objects such as member or transaction. The attributes of these objects are available in the Dimension folders and you can add them to your analyses as columns. An attribute could be member type, member status, or program, and so on. The Fact folders contain filters to count or measure the information.
Explore the Subject Area Context
A context for a subject area defines what column details the analysis displays. Adding a Member column doesn't mean that all members show in the analysis. It depends on the context you're using to create the analysis. If you build an analysis, and it doesn't show what you're expecting, be sure that you're adding your columns and facts in context.
The dimension folders for subject areas contain the columns and the facts folders that define the relationship of the columns. For example, if you add the Program column to your analysis, and then add the Number of Active Members fact to the same analysis, then only the active members within each program show on this analysis in this context. If there are many members that are part of the program, but if their status isn't active, then they aren't included in your analysis.
To further explore this concept, you can build a loyalty member analysis, add an additional subject area, and then explore some different scenarios:
-
In BI, from the New field, select Analysis to build a new analysis.
-
From the Select Subject Area window, select the Loyalty - Members Real Time subject area.
Note: To make use of the loyalty analytics functionality, use only the subject areas that are relevant to loyalty, even if there are other subject areas available. The loyalty subject areas begin with the term "Loyalty". -
Expand Loyalty - Members Real Time, expand Program, and then select Program and Program Description so they appear on the palette.
-
Expand Tier, and then select Tier Name so it appears on the palette.
-
Expand Facts, then expand Member Facts, and then select # of Active Members so they appear on the palette.
This fact is key to this analysis because the relationship of Program to this subject area is dependent on Membership Status. If there aren't any active members in the loyalty program, then BI doesn't generate the report. Because the context of this subject area has to do with loyalty members, only active members of the loyalty program are included, and further categorized by member tier.
-
Select the Results tab to see the number of active members in the loyalty program, categorized by Tier Name.
-
Select the Criteria tab, and in Subject Areas, expand Facts and select # of Primary Points so that it appears on the palette.
In the Results tab, you can find the total number of primary points for all the active members in the loyalty program.
-
Go back to the Criteria tab and remove Program, Program Description, and Tier Name.
In the Results tab, you can find all the number of active members across all loyalty programs, and the total number of primary points they have.
Create a Member Analysis
You can create a member analysis from subject areas in Oracle Business Intelligence (BI) using the New Analysis wizard.
When you're planning to build an analysis from a subject area, consider the objectives for the analysis. For example, consider what metrics you want to include. Subject areas answer business questions, for example, you can get answers to the following business questions by using the Loyalty- Members Real Time Subject Area:
-
How many members are enrolled in my loyalty program?
-
How many members are active?
-
What is the number of primary points that members own?
-
What is the total liability of the loyalty program?
-
How are members spread across different tiers?
-
How are members spread across different member groups and classifications?
If you're a loyalty marketing manager or program manager, and you're interested in how your members are spread across different tiers, then you might want to get a quick snapshot of how the members are distributed. You can build an analysis to look at this information.
To build a simple activity analysis from a subject area:
-
In BI, from the New field, select Analysis.
-
From the Select Subject Area window, select Loyalty- Members Real Time Subject Area, and then complete the following:
-
From the Program dimension, add Program and Program Description.
-
From the Tier dimension, add Tier Name.
-
From the Facts folder, expand Member facts, and add # of Active Members.
-
Select the Results tab to view the results of the analysis.
-
-
If you want to know the member names, from the Criteria tab, remove the # of Active Members fact, add Member Name from the Member dimension to the analysis.
-
Select the Results tab to see the distribution of members over all loyalty programs categorized by the program tier.
You can move back and forth between the Criteria tab and the Results tab at any time to see your analysis.
-
Name and save your analysis.
Loyalty Cross Subject Area Queries
Each subject area contains a collection of dimensional attributes and measures relating to a one-dimensional STAR model, which groups them into individual folders. The term STAR refers to the semantic model where a single fact is joined to multiple dimensions. You can create an analysis that combines data from more than one subject area. This type of analysis is a cross-subject area query. Cross-subject area queries are classified into three broad categories:
-
Combining queries from multiple subject areas.
-
Using common (conformed) dimensions.
-
Using local and common (confirmed) dimensions.
-
-
Using a "set" operation (Union or Union All for example) to combine more than one result set from different subject areas.
-
Combining Logical SQL using the Advanced tab.
A common dimension is a dimension that exists in all subject areas that are joined in an analysis. For example, Member dimension is the common dimension for the Member Real-Time and Transaction Real-Time subject areas.
A local dimension is a dimension that exists only in one subject area. For example, Product and Partner are local dimensions for the Transaction Real-Time subject area.
The following are some general guidelines to follow when working with multiple subject areas:
-
If all the metrics and attributes required for the analysis are available in a single subject area and fact metrics, use only that subject area, and don't create a query for the cross subject area. Performance is better with such an analysis and the analysis is easier to maintain.
-
When joining two subject areas in an analysis, make sure to use at least one attribute from a common dimension in the analysis.
-
When using common dimensions, always choose the attributes from the common dimension from a single subject area. For example, if you're using the Member dimension to build a query between the Member Real-Time Subject Area and the Transaction Real-Time Subject Area, then select all Member dimensions from both the subject areas. In some scenarios, the common dimension might have more attributes in one subject area than in the other subject area. In this situation, you can only use the subset of common attributes for a cross-subject area query.
-
Always include a measure from each subject area that's being used in your analysis. You don't have to display measures or use them, but it's recommended that you include them. You can hide a measure if you don't need it in the analysis.
-
When using common and local dimensions use SET VARIABLE ENABLE_DIMENSIONALITY=1; in the Advanced SQL tab.
Combine Queries from Multiple Subject Areas
The simplest and fastest way to generate an analysis is to use a single subject area. If the dimension attributes and fact metrics that you're interested in are all available from a single subject area, then you should use that subject area to build the analysis. Such an analysis results in better performance and is much easier to maintain.
If your analysis requirements can't be met by any single subject area because you require metrics from more than one subject area, you can build a cross-subject area query using common dimensions. In this case, build a cross-subject area query using only common dimensions.
In addition, if you use three subject areas for an analysis, then common dimensions must exist in all three subject areas. Joining common dimensions gives you the benefit of including any metric from any of the subject areas in a single analysis.
While you can create an analysis by joining any subject area to which you have access, only a cross-subject area query that uses common dimensions returns data that's at the same dimension grain. This query results in a clean merge of the data, and the analysis returns exactly the data you want to see.
Knowing how BI executes cross-subject area queries helps you to understand the importance of using common dimensions when building such an analysis. When BI generates a cross-subject area analysis, it executes separate queries for each subject area in the analysis and merges the results to generate the final analysis. BI merges the data from the different subject areas using the common dimensions and returns it. When you use common dimensions, the result set returned by each subject area query is at the same dimensional grain, so BI can cleanly merge and render the analysis.
Use Common Dimensions for an Analysis
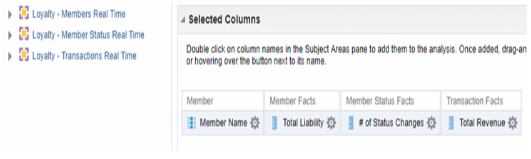
This example shows how you can bring together the Total Liability, # of Status Changes, and the Total Revenue metrics in a combined report.
This example analysis uses the following subject areas:
-
Subject area 1: Loyalty - Members Real Time
-
Subject area 2: Loyalty - Member Status Real Time
-
Subject area 3: Loyalty - Transactions Real Time
The example uses Member as a common dimension to relate the information from the multiple subject areas. Instances of the Member dimension exist in each one of these subject areas.
The metrics used from the three subjects areas are:
-
Loyalty - Members Real Time: Member Facts and Total Liability
-
Loyalty - Member Status Real Time: Member Status Facts and # of Status Changes
-
Loyalty - Transactions Real Time. Transaction Facts and Total Revenue
The following figure shows an illustration of the answer created on the BI composer interface.
For this example, you can see the following SQL on the Advanced tab of the answer:
SELECT
   0 s_0,
   "Loyalty - Members Real Time"."Member"."Member Name" s_1,
   "Loyalty - Member Status Real Time"."Member Status Facts"."# of Status Changes" s_2,
   "Loyalty - Members Real Time"."Member Facts"."Total Liability" s_3,
   "Loyalty - Transactions Real Time"."Transaction Facts"."Total Revenue" s_4
FROM "Loyalty - Members Real Time"
ORDER BY 1, 2 ASC NULLS LAST
FETCH FIRST 150001 ROWS ONLY
Use Set Operations to Combine Result Sets from a Subject Area
This example illustrates a compound analysis query that's a union of the result subsets from two subject areas.
The objective in this example is to build a combined list of high value members who have either:
-
Referred more than 3 new member (result-set 1)
-
Generated revenues exceeding 15,000 during their lifetime (result-set 2)
The Logical SQLs corresponding to the two result-sets are as follows:
-
Result-set 1:
SELECT 0 s_0, "Loyalty - Members Real Time"."Referral Source"."Referral Source Name" s_1, "Loyalty - Members Real Time"."Referral Source"."Referral Source Number" s_2 FROM "Loyalty - Members Real Time" WHERE ("Member Facts"."# of Members" > 3) -
Result-set 2:
SELECT
   0 s_0,
   "Loyalty - Transactions Real Time"."Member"."Member Name" s_1,
   "Loyalty - Transactions Real Time"."Member"."Member Number" s_2
FROM "Loyalty - Members Real Time"
WHERE ("Loyalty - Transactions Real Time"."Transaction Facts"."Total Revenue" >= 15000)
You can combine the two Logical SQLs using the UNION ALL set operator as follows:
SELECT "Loyalty - Members Real Time"."Referral Source"."Referral Source Name" s_1,
       "Loyalty - Members Real Time"."Referral Source"."Referral Source Number" s_2
FROM "Loyalty - Members Real Time"
WHERE ("Member Facts"."# of Members" > 3)
UNION ALL
SELECT "Loyalty - Transactions Real Time"."Member"."Member Name" s_1,
       "Loyalty - Transactions Real Time"."Member"."Member Number" s_2
FROM   "Loyalty - Members Real Time"
WHERE ("Loyalty - Transactions Real Time"."Transaction Facts"."Total Revenue" >= 15000)
Extract the Data Store for the Loyalty Offering
Use the Oracle BI Cloud Connector Console to extract the data store offering. A list of all available Oracle Loyalty Cloud data store offerings are listed in the R13.x CX BI Cloud Adapter BI View Object to Database Lineage Mapping Spreadsheet. This spreadsheet is available in the BI Cloud Connector Console Overview Page topic in the Creating a Business Intelligence Cloud Extract guide.
To extract the data store offering:
-
Log in to the Oracle BI Cloud Connector.
-
View a list of enabled data stores for an offering by clicking the Manage Offerings and Data Stores link in the panel tab.
-
Select the Loyalty offering and verify that the data store you're extracting from is available.
If a data store you require isn't available by default for extraction, the instructions below describe how to manually add it.
-
To extract Business Intelligence data from the data store, click Manage Extract Schedules in the panel tab.
-
Click the + (plus) button to create a schedule for a one-time or a recurring data extraction, and to monitor the last scheduled run and to verify completion.
Manually Add A Data Store
Let's say you want to extract the data store: CrmAnalyticsAM.LoyaltyExtractAM.PointSubtypePVO. However, it's not available by default in the Manage Offerings and Data Stores link. You can manually add this data store so you can extract it.
-
Click the + (plus) button to add the data store.
In this example, select the following values:
-
Data Store Key: CrmAnalyticsAM.LoyaltyExtractAM.PointSubtypePVO
-
Selected Offerings: Loyalty
-
-
Click Save.
-
Click Select Columns.
The Data Store Column Selection pane opens.
-
Click Select, and then Select All to include all columns.
-
In the Column Name column, locate LoyPtsubtypeId and select the Primary Key check box.
-
Click Save.
The data store called CrmAnalyticsAM.LoyaltyExtractAM.PointSubtypePVO is displayed, and can be extracted.
Repository and Session Variables for Business Intelligence
This table shows repository and session variables available for use in your analyses.
| Variable Name | Type | Usage | Offering |
|---|---|---|---|
|
CURRENT_DAY |
Session Variable |
Returns the value of Current Date. |
All |
|
CURRENT_MONTH |
Repository Variable |
Returns the value of Current Month in the YYYY/MM format. |
All |
|
CURRENT_WEEK |
Repository Variable |
Returns the value of the current week in YYYY Weeknnn format. |
All |
|
CURRENT_QUARTER |
Repository Variable |
Returns the value of Current Quarter in YYYY Q n format. |
All |
|
CURRENT_YEAR |
Repository Variable |
Returns the value of Current Year in the YYYY format. |
All |
|
NEXT_MONTH |
Repository Variable |
Returns the value of Next Month in the YYYY / MM format. |
All |
|
NEXT_WEEK |
Repository Variable |
Returns the value of Next Week in the YYYY Week nn format. |
All |
|
NEXT_QUARTER |
Repository Variable |
Returns the value of Next Calendar Quarter in the YYYY Q nn format. |
All |
|
NEXT_YEAR |
Repository Variable |
Returns the value of Next Year in the YYYY format. |
All |
|
PREVIOUS_MONTH |
Repository Variable |
Returns the value of Previous Month in the YYYY/MM format. |
All |
|
PREVIOUS_WEEK |
Repository Variable |
Returns the value of Previous Week in the YYYY Week nn format. |
All |
|
PREVIOUS_QUARTER |
Repository Variable |
Returns the value of Previous Quarter in the YYYY Q nn format. |
All |