SMS Analysis dashboard
The SMS Analysis dashboard provides a comprehensive overview of the performance of SMS messages sent within the specified time frame. The dashboard uses metrics such as SMS deliveries, failures, clickthroughs, and more so that you can easily compare the performance of your SMS messages.
By default, the dashboard shows information for SMS messages sent within the last two weeks and groups information on the dashboard by SMS sender code.
Click a link below to find out more about this dashboard:
Good to know
- When you view this dashboard, you specify the time frame based on when the SMS message was sent. The performance metrics included in the dashboard are not limited to the same time frame. The metrics reflect the activity that happened because of an SMS message being sent. For example, you want to chart on the performance of SMS messages sent last month. If a contact received the SMS message yesterday and followed a link, the dashboard for last month includes the contact's activity from yesterday.
- Unless otherwise noted below, forwarded messages count toward the metrics in this dashboard. For example, if a contact forwarded an SMS message, and the recipient clicked a link, the recipient's clickthrough would count towards the clickthrough metrics in this dashboard.
Dashboard filters
Use the Filter results section of the dashboard to change the time frame and SMS sender codes shown on the dashboard.
- Send Date Range: The time frame the SMS messages were sent.
- Code: The SMS sender code that the SMS message is associated to.
Dashboard metrics
This dashboard captures the following metrics.
| Metric | Description |
|---|---|
| Sends |
The total number of sent messages. |
| Delivered | The total number of successfully delivered messages. |
| Failed | The total number of failed messages. Failed messages were not sent at all. A message failure could be a skipped message (no code available for the country) or an error with the SMS service such as an authentication or any partner API related error. |
| Clickthroughs | The total clickthroughs. This includes multiple clicks by the same recipient. |
| Bounce % | The total bouncebacks divided by the total sends. (Total Bouncebacks / Total Sends). |
| Soft Bounce | The total soft bouncebacks. |
| Hard Bounce | The total hard bouncebacks. |
| Received | The total received messages. |
| Total Opt-Ins (Keywords) | The total opt-in responses received. |
| Total Opt-Outs (Keywords) | The total opt-out responses received. |
Understanding the charts on the dashboard
Top SMS sends by code
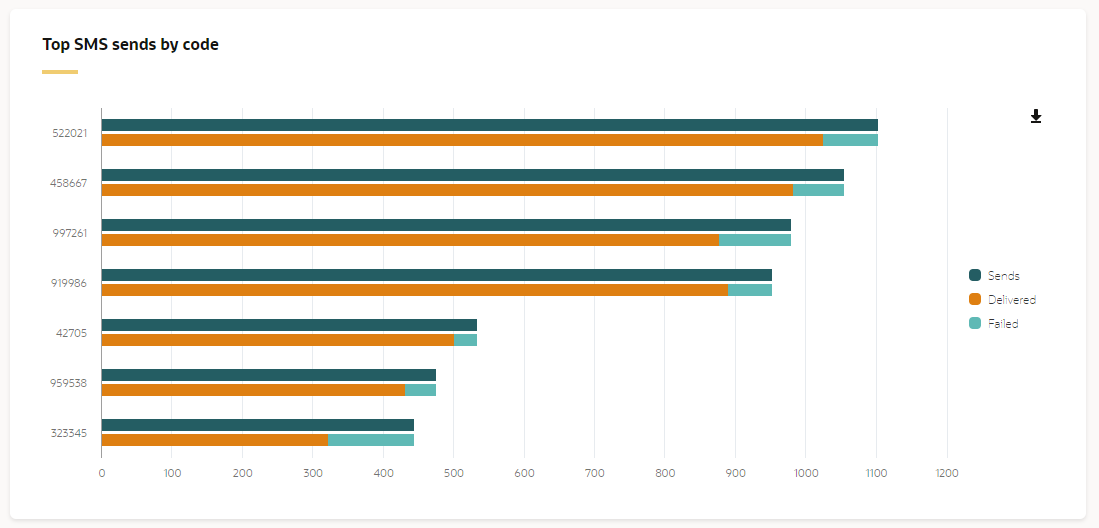
This chart measures the number of SMS messages sent within the time frame specified. SMS sends are categorized by SMS sender codes.
SMS Code Activity
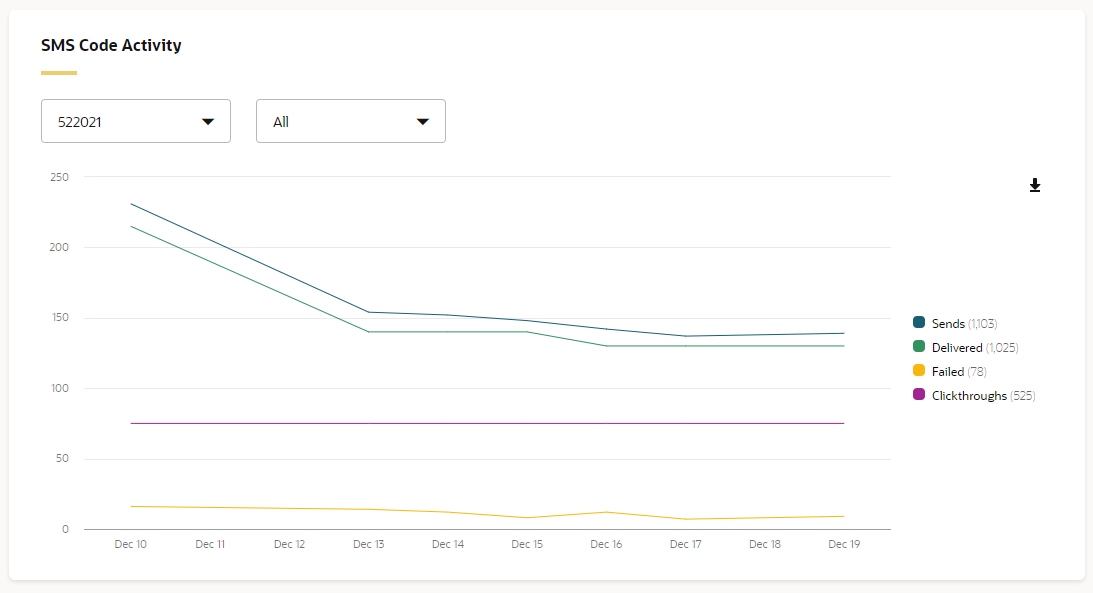
This chart shows the performance for the selected SMS sender code.
SMS Activity Timeline
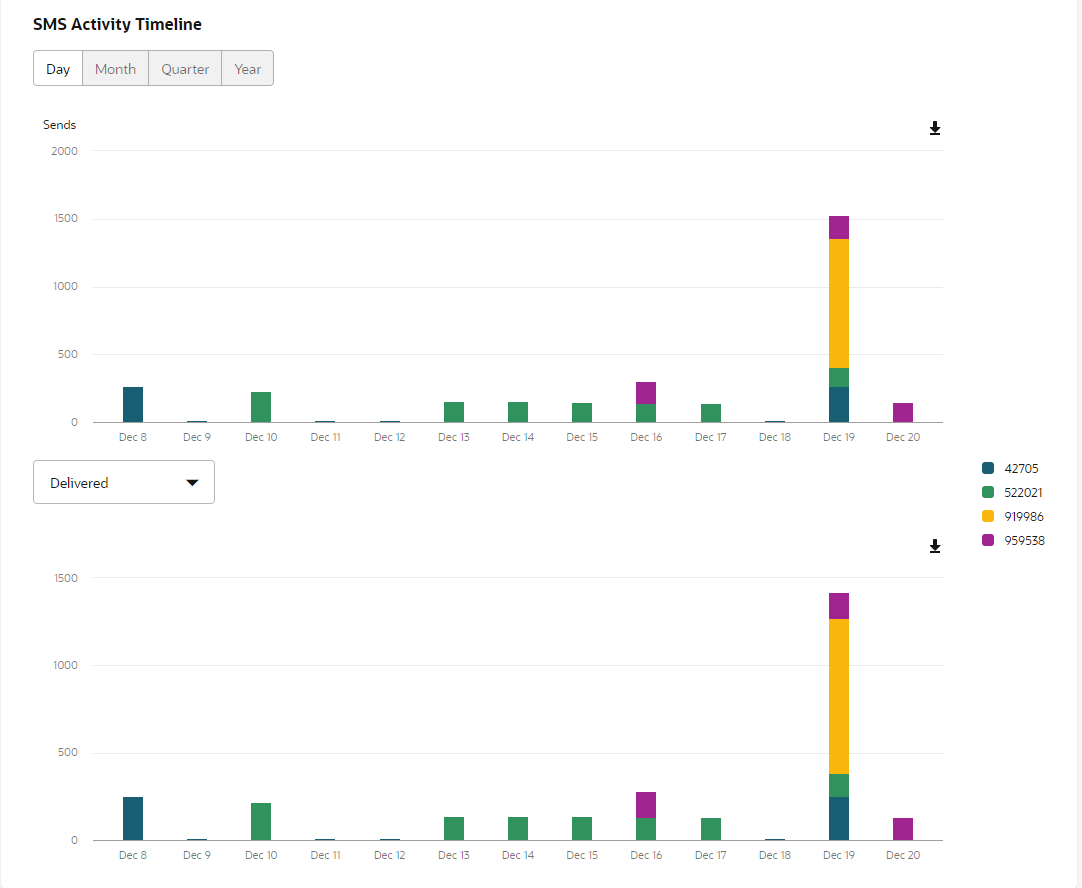
This chart shows all SMS message activity that occurred after the SMS message was sent. The first chart in this section shows the sends. The second chart shows other activity. You can use the drop-down list at the top of the chart to filter by activity type (delivered, failed, or clickthroughs).
Since the chart reflects all SMS message activity regardless of the time frame you specified for the dashboard, you can use the buttons at the top of the chart to view the daily, monthly, quarterly, or yearly activity.
SMS Activity Summary
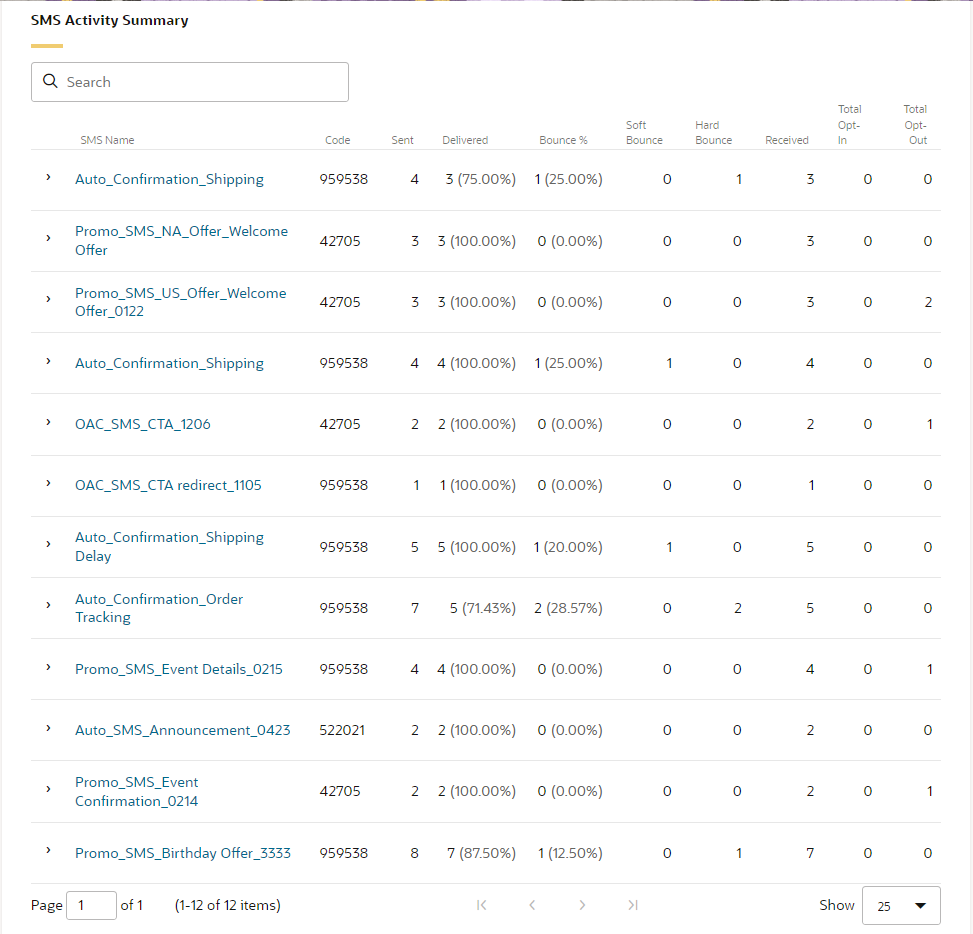
This chart lists more details about individual SMS messages included on the dashboard such as bounceback rate, total received, clickthroughs, opt-ins and opt-outs.