Creating analysis with a pivot table
This tutorial shows you how to create a new analysis with hierarchical columns and apply selection steps. Because hierarchical columns imply pivot tables, you'll be able to drill into the table data.
What you'll learn
In this tutorial, we'll show you how to:
- Create a new analysis with hierarchical columns
- Work with a pivot table view
- Apply selection steps to the analysis
What you'll need
- Access to Insight
- Analyzer license
Step 1: Creating a new analysis
First, create a new analysis with hierarchical columns.
To create the new analysis:
- In Insight, click New >
 Analysis and choose the Campaign Revenue Analysis subject area.
The analysis editor appears.
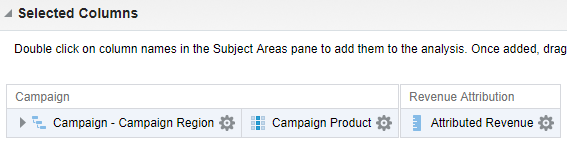
- Add the following to the analysis:
Folder Columns Campaign Campaign - Campaign Region Campaign Campaign Product Revenue Attribution Attributed Revenue The updated analysis should now look like this:
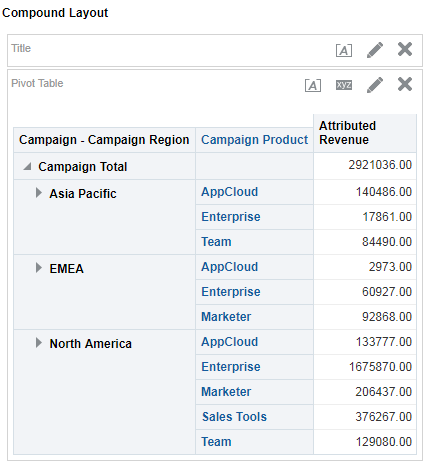
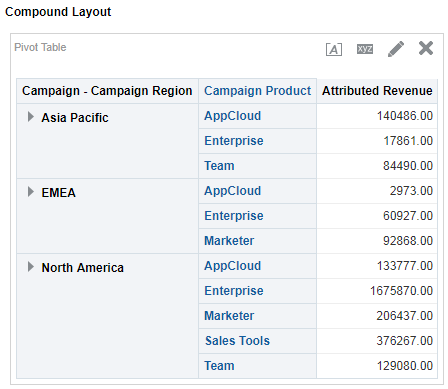
- Click the Results tab.
The default results include a Title view and a Pivot Table view. You can expand and collapse the Campaign Total to drill down to the data.
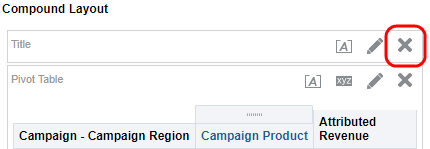
- Delete the Title view.
- Save your analysis.
Step 2: Adding selection steps
Now, we'll add selection steps to the results. Both filters and selection steps allow you to limit the data displayed in your analysis. Unlike filters that are applied before the analysis is aggregated, selection steps are applied after the analysis is aggregated. Selection steps only affect the members displayed, not the resulting aggregate values.
Here is some additional information about selection steps:
- Selection steps are per column and cannot cross columns.
- You cannot create selection steps for measure columns.
- Grand totals and column totals are affected by selections.
- You can create selection steps for both attribute columns and hierarchical columns.
To add selection steps:
- On the Results tab, scroll down to view the Selection Steps pane and expand it. In the Campaign - Campaign Region section, click 2. Then, New Step, then select Select Members based on Hierarchy.
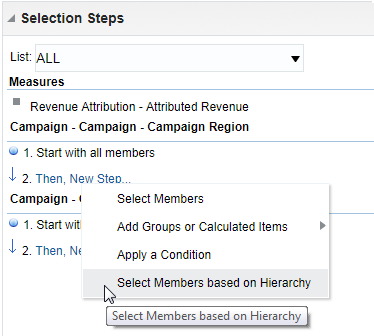
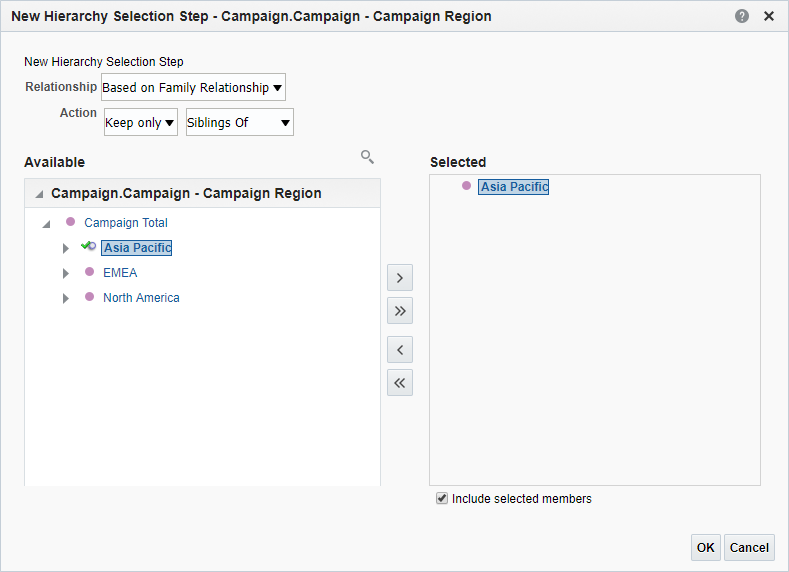
The New Hierarchy Selection step dialog box appears.
- Select Based on Family Relationship from the Relationship drop-down list, and then Keep only, Siblings Of as the action.
The New Hierarchy Selection Step dialog appears.
- In the Available list, expand Campaign Total and select Asia Pacific. Move Asia Pacific to the Selected pane. Select the Include Selected member check box. If you do not select this, Asia Pacific would be excluded from the results.
Here is the updated dialog:
- Click OK.
Notice that the table includes only the regions now, not the Campaign Total.
Now, you will add a group to limit the number of regions.
- In the Campaign - Campaign Region section, click 3. Then, New Step. Select Add Groups or Calculated Items > New Group.
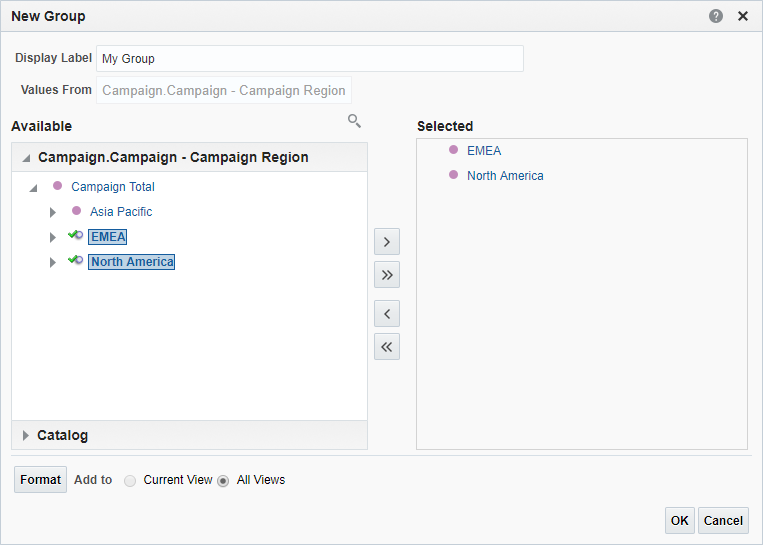
The New Group dialog appears.
- Enter My Group in the Display Label text box, then expand Campaign Total, and select EMEA and North America. Move them to the Selected pane and click OK.
This new group is added to the Pivot Table view. You can drill down into the group to see its members. You can also add the new group to other views in addition to the current pivot table of the analysis.
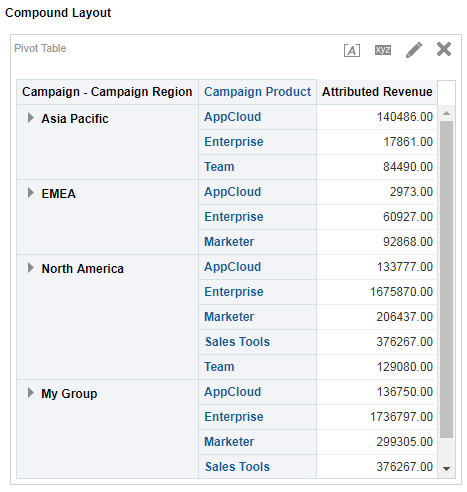
- Save your analysis.
Now that you're done
Now that you have created analysis with pivot table, check out the next tutorial Formatting a pivot table and adding calculations.