Exporting reports
You can use the reporting API to export data from your reports. From the reporting UI, you can export report data in CSV, HTML, JSON, or XML format. The initial export request processes the data and packages the export file and a subsequent request retrieves the exported file.
Note: Only data included in a saved report can be exported.
To export report data:
When a request is made to export data using a REST URL, you will be prompted to enter your user name and password. It is also possible to pass encrypted authorization details as part of the header, depending on the application used to execute the request.
If your user account does not have access to the account or the report, a “404, not found” error results. Any data permissions configured in Settings for the user account will be applied to the API export.
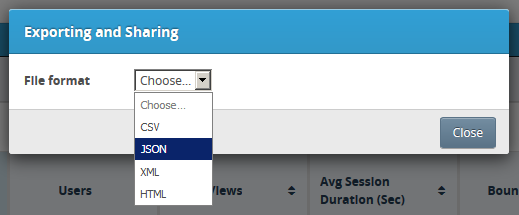
- When viewing a report, click the exporting and sharing icon
 above the chart.
 - Select the file format: CSV, JSON, XML, or HTML.
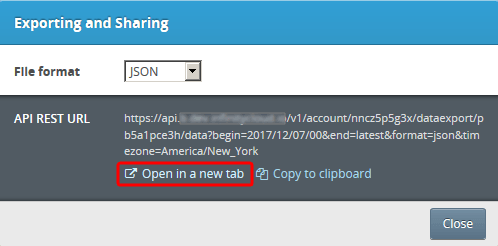
The Exporting and Sharing dialog displays the Infinity API REST URL where you can retrieve your exported data and offers the following options: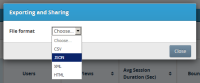
- Copy to clipboard: Choose this option to retrieve the report later or to share the URL with other users who have proper access.
- Open in a new tab: Open the REST URL in a new browser tab, which will prompt you for your user name and password before processing the report.

- Click Open in a new tab.
- In the new browser tab, enter your user name and password. If your credentials provide you access, a message indicates that the report is being processed. Export processing time depends on the amount of data requested. Once the processing is completed, refreshing the browser will download the exported file.
- Submit the request again (or refresh) to download the export file.
Tip: The date range of the exported file is the same date range as seen when viewing the report in the user interface. You can edit the API REST URL to change the date range parameters.
Authorization
To export report data, you must at a minimum have “View Only” access rights for Infinity and you must have access to the account, the collection, and the report. When a request is made to export data using a REST URL, you will be prompted to enter your username and password. If your user account does not have access to the account or the report, a “404, not found” error results. Any data permissions configured in Settings for the user account will be applied to the API export. It is also possible to pass encrypted authorization details as part of the header, depending on the application used to execute the request.
Exported values may differ from the reporting UI
Exported reports for current or today date ranges will include any open sessions available at the time when the export request is initiated. Open sessions are continuously streaming into the Infinity platform and these open sessions are visible both in the reporting UI and report exports, so it is possible for exported files to have slight differences when compared to the reporting UI. For example:
- At 8:05, I view a report for “This Week”. The reporting UI shows a session value of 12,814.
- At 8:05, I click to initiate an export of this report including all open sessions up to 8:05.
- At 8:08, the export file has completed processing and is ready to be retrieved. I click to open the file and see a session value of 12,814. This value matches sessions from 8:05 when the export was initially requested.
- At 8:10, I compare the export file’s session value of 12,814 to the reporting UI, which now shows 13,007 sessions. The difference is the result of new sessions streaming into Infinity.
For two hours after the initial export request, any requests of the same report by the same user will result in the same export file, unless the refresh parameter is set to true. In the example above, export requests at 9:00 and 10:00 will return the same export file as the 8:05 request. Export files are available for users to retrieve for up to two hours. After two hours, subsequent export requests will reprocess and retrieve the most up to date data. This two hour buffer is in place to allow sufficient time for longer running queries to complete and for you to retrieve the export file.
If refresh=true is added to the request, any previous request made less than two hours ago will be canceled and a new request will be initiated to retrieve the most up to date data including any new open sessions since the previous request.
Settings and parameters
You can filter your report data by specifying the following optional settings and parameters.
| Type | Description | Parameter syntax |
|---|---|---|
| Auto Download | Automatically download your export file once processed. When set to true, the request will retry every 30 seconds until a status code is returned indicating processing is complete and then the export file automatically begins downloading.
|
autoDownload=[true|false]
To automatically download your export file when processing is complete:
|
| Date Range | Specify the range of days to be exported.
Alternatively, specify a relative date range. |
begin=yyyy/mm/dd/hh
To export data for January 20, 2016:
To export data for the 8:00 hour only on January 20, 2016:
|
| Download | Specify whether exported data is saved to a file and downloaded or displayed directly in the browser.
|
download=[true|false]
To save exported data to file and download:
To display exported data directly in the browser (for JSON and XML when using Chrome):
|
| Format | Specify the data export format: CSV, HTML, JSON, or XML. |
|
| Limit | Specify the number of rows to be exported for each dimensional level.
For more details, see dimensional row distribution. |
limit=[1-3000000],[1-3000000],[1-3000000],...
Comma separated values may be applied for each dimension in your report. |
| Refresh | Cancel an existing request that is less than two hours old and refresh the request with the latest data, including any new open sessions.
|
refresh=[true|false]
To refresh the REST request to retrieve the latest data:
If the previous request is more than two hours old, this optional parameter is not needed. |
| Relative Date Ranges | Specify a date range relative to today.
|
|
| Suppress Error Codes | Suppress error codes when importing into Excel. This is needed for Excel imports, because requests that return any HTTP status code other than 200 causes Excel to disable the connection. Adding this parameter ensures that all errors return a 200 status code to Excel, but the message text associated with the error still appears.
|
suppressErrorCodes=[true|false]
To import data into Excel:
|
| Time Zone | Specify the time zone. Data is stored in UTC in the Infinity platform, and specifying a time zone will offset the data from UTC. | timezone=canonical_time_zone_ID
Examples If you are located in Los Angeles, CA, USA (UTC -8:00):
If you are located in Paris, France (UTC +1:00):
If you are located in Melbourne, Australia (UTC +10:00):
|
| Totals | Specify whether to include or exclude measure totals in your export.
|
totals=[true|false]
To include measure totals:
To exclude measure totals:
|
Parameterizing values in Excel
To link a parameterized cell in Excel to a parameter in the API request:
- In the Infinity reporting UI, export your report and select Copy to clipboard.
- Open Microsoft Excel and select the Data > From Web option. The New Web Query dialog is displayed.
- Paste the REST URL you copied to your clipboard into the Address and then modify the URL to include the following parameters:
- Add
suppresserrorcodes=true. - Change the
formatparameter tohtml. - Change or add
download=false. - Add
autoDownload=true.
- Add
- Click Save Query. The Save Query dialog is displayed, which allows you to browse for a location.
- Enter a path where you want to save the IQY file and click Save.
- Open the IQY file and modify the REST URL to include the parameterized values you want. For example:
https://api.infinitycloud.io/v1/account/mv0nfs6p/dataexport/dtov3huh/data?begin=2017/12/26/00&end=latest&format=html&suppresserrorcodes=true&download=false&autoDownload=true
- In Excel, choose Data > Connections > Add and choose your modified IQY file.
- In Excel, choose Existing Connections and point to the connection you just created.
- You are then prompted to enter a value for the parameters you added to the IQY file (for example, enter a
beginvalue) and your report data populates Excel.
Dimensional row distribution
If you want to change the distribution of exported rows across dimensions, use the limit parameter, which allows you to specify the number of rows exported for at each dimensional level. If the first dimension in the report has low cardinality and the second dimension has high cardinality (such as Device Type > Page Titles), consider using the limit parameter with a lower value for the first dimension to allow a greater distribution on sub-dimensions.
A maximum of 3,000,000 dimensional rows of data can be exported. The first dimension will default to 1,000 rows and the remaining rows are distributed across the sub-dimensions in your report. You can change the distribution of how many rows are exported per dimension by using the limit parameter. Exported data is distributed across dimensions in your report using the following default logic:
| Number of report dimensions | Limit | Equation |
|---|---|---|
| One | First dimension: limit to 1,000 rows | Limit to 1,000 rows |
| Two |
|
Equation for two dimension report:
[max rows] / [1st dimension limit]
Example: 3,000,000 / 1,000 = 3,000 |
| Three |
|
Square root of the equation for the two dimension report [max rows] / [1st dimension limit]3,000,000 / 1,000 = 3,000 Square root of 3,000 = 54 |
| Four |
|
Cube root of the equation for three dimension report [max rows] / [1st dimension limit] 3,000,000 / 1,000 = 3,000 Cube root of 3,000 = 14 |
Additional examples
limit=100: 100 rows are exported for the first dimension.
- 2D reports: Sub-dimensions will export 30,000 rows
- 3D reports: Sub-dimensions will export 173 rows
- 4D reports: Sub-dimensions will export 31 rows
limit=5000: 5,000 rows are exported for the first dimension.
- 2D reports: Sub-dimensions will export 600 rows
- 3D reports: Sub-dimensions will export 24 rows
- 4D reports: Sub-dimensions will export 8 rows
limit=3000000: 3,000,000 rows are exported for the first dimension.
- 2D reports: Sub-dimensions will export 1 row
- 3D reports: Sub-dimensions will export 1 row
- 4D reports: Sub-dimensions will export 1 row
limit=100,100
- 2D reports: first dimension exports 100 rows, second exports 100 rows
- 3D reports: First dimension exports 100 rows, second exports 100 rows, third exports 300 rows
- 4D reports: First dimension exports 100 rows, second exports 100 rows, third and fourth export 17 rows
limit=-,100
- 2D reports: First dimension exports 30,000 rows, second exports 100 rows
- 3D reports: First dimension exports 173 rows, second exports 100 rows, third exports 173 rows
- 4D reports: First dimension exports 31 rows, second exports 100 rows, third and fourth export 31 rows
limit=100,-,100
- 2D reports: First dimension exports 100 rows, second exports 30,000 rows
- 3D reports: First dimension exports 100 rows, second exports 300 rows, third exports 100 rows
- 4D reports: First dimension exports 100 rows, second exports 17 rows, third exports 100 rows, fourth exports 17 rows
limit=100,-,30,100
- 2D reports: First dimension exports 100 rows, second exports 30,000 rows
- 3D reports: First dimension exports 100 rows, second exports 1,000 rows, third exports 30 rows
- 4D reports: First dimension exports 100 rows, second exports 10 rows, third exports 30 rows, fourth exports 100 rows
limit=100,-,-,100
- 2D reports: First dimension exports 100 rows, second exports 30,000 rows
- 3D reports: First dimension exports 100 rows, second exports 173 rows, third exports 173 rows
- 4D reports: First dimension exports 100 rows, second exports 17 rows, third exports 17 rows, fourth exports 100 rows
And so on with additional dimensions.