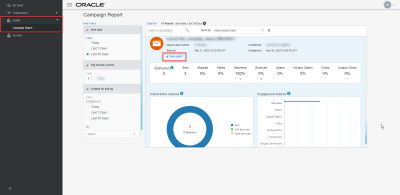
Viewing Campaign Reports for local marketers
For accounts enabled with Collaboration, campaign performance reports offer local marketers the ability to view metrics of the campaigns that were launched by their organization in last 30 days. Previously, this information was only available to corporate-level marketers. These reports give you insight into how your organization's campaigns performed.
Note: To view the campaign performance report, you must have the Express Email Campaign Manager role.
To view campaign performance reports:
- Click Insight
 on the side navigation bar, and then select Campaign Report.
 - Optionally, use the filters on left side of the page to filter the campaign reports. For example, the default is to show reports for campaigns sent during the Last 7 Days. You can select Last 30 Days to view more campaign reports, or select Today to view only the campaigns sent today.
- From the list of campaign reports, locate the report you want to view and click View report.
Understanding the campaign report
Key engagement metrics
The key engagement metrics section at the top of the report provides a quick summary how your campaign performed, as determined by the following metrics:
- Distribution: Number of email addresses on the distribution list at time of launch.
- Sent: Number of sent messages.
- Skipped: Shows both the skip rate ((Number of Skipped / Distribution) * 100)% and the number of undeliverable messages because of domain suppression, address suppression, invalid email address, missing data in $replacementField$, or personalization errors.
- Failed: Shows both the failed rate ((Number of Failed / Distribution) * 100)% and the number of emails undeliverable to email server because of SMTP/server errors, invalid communications settings, and invalid domain names.
- Delivered: Shows both the delivered rate ((Number of Delivered / Sent) * 100)% and number of successfully delivered messages (that is, Sent minus Bounced).
- Bounced: Shows both the bounced rate ((Number of Bounced / Sent) * 100)% and the number of unique bounced email addresses.
- Opens: Shows both the open rate ((Number of Opens / Number of Delivered) * 100)% and the number of email messages opened, including multiple opens .
- Unique Opens: Shows both the unique open rate ((Unique Opens /Number of Delivered) * 100)% and number of unique email opens (that is, only includes first time message was opened by a responder).
- Clicks: Shows both the click-through rate ((Total Clicks, excluding unsubscribes/ Delivered) * 100)%, and count of total clicks; that is, clicks on all links, including multiple clicks on the same link(s). Unsubscribes do not register as clicks.
- Unique Clicks: Shows both the unique click-through rate ((Unique Clicks / Delivered) * 100)% and the number of unique clicks (that is, only includes first time a responder clicked on each link per launch).
Deliverability analysis chart
The Deliverability analysis chart shows the percent of Sent vs. Hard Bounced vs. Soft Bounced for the total Distribution.
- Sent: Percent of messages sent ((Sent/Sent+Hard Bounced+Soft Bounced) * 100)%.
- Hard bounced: Percent of messages hard bounced ((Hard Bounced/Sent+Hard Bounced+Soft Bounced) * 100)%. Hard Bounces are the number of emails classified as "hard bounces" (that is, email addresses that are not deliverable and will never become deliverable including messages that return codes stating "user does not exist" and "domain does not exist").
- Soft bounced: Percent of messages soft bounced ((Soft Bounced/Sent+Hard Bounced+Soft Bounced) * 100)%. Soft Bounces are the number of emails classified as "soft bounces" (that is, emails that are not deliverable, but might become deliverable if retried in the future). Retries on soft bounces by mail transfer agents (MTAs) are not recorded as additional sends; however, the soft bounces metric do include the additional soft bounces that may result from the retries.
Engagement analysis chart
The Engagement analysis chart shows key engagement metrics in horizontal bar chart form. It shows the metrics from the Key engagement metrics section, plus the following metrics:
- Conversions: Number of conversion actions. Conversions are particular post-clickthrough actions, such as making a purchase, signing up for a newsletter, and the like.
- Unique Conversions: Number of unique conversion actions. Responsys counts the first time a recipient converts on a message (that is, a launch) as a unique conversion.
