Identifying Performance Issues
The following processes can help you identify the kind of performance issue you are experiencing:
Using Page Build and Load Times
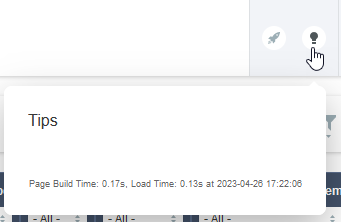
The first step in identifying performance issues is to find out how long it takes a page to build and load. To find this information, click the Tips button on the page which is loading slowly, and note the Page Build Time and Load Time at the bottom of the window.
-
The Page Build Time measures the time taken for SuiteProjects Pro to process the request. A long page build time indicate extensive application processing and / or database activity. See Amount of processing required.
-
Load Time - Measures the time taken for data to travel across the Internet and be displayed in the browser. A long load time indicate a large page size, a slow network or a slow browser. See Using a Trace Route, Identifying Client Performance Issues, and Volume of data transferred.
-
at - Shows the exact time the request was processed by SuiteProjects Pro. This is an important detail required should you need to report the problem to SuiteProjects Pro Support.
Excessively long build times indicate an issue with the SuiteProjects Pro application itself. If this is the case, see Performance Issue Scenarios and Best Practice Guidelines for ways to potentially improve build times.
Due to asynchronous components, the page build time and load time for certain pages may not reflect the time it takes for all the page content to load. If this occurs, please make a note of the time it took to load all page content (roughly) and report the discrepancy to SuiteProjects Pro Support.
Using a Trace Route
The next piece of information you should gather comes from running a trace route. You can run a TCP traceroute to determine if the performance issues you are experiencing are due to your Internet connection. See Running a TCP Traceroute on Windows or Running a TCP Traceroute on macOS.
The TCP traceroute command line output shows every step taken to reach SuiteProjects Pro from your computer. If a line reads 'Request timed out' or a value over 100 ms indicates that there may be a connection problem.
-
If the first problematic line is within the first three lines, this usually indicates a connectivity issue within your own network. Contact your network administrator, and provide the results of your trace route.
-
If the first problematic line appears after the first three lines and before the last three result lines, this indicates there may be a problem with a router you travel through prior to reaching SuiteProjects Pro servers. Contact your Internet Service Provider (ISP) with the results of the trace route so they can further investigate any connection problems.
-
If you are getting timed out within the last three result lines, this may point to a performance problem with SuiteProjects Pro network providers. Contact SuiteProjects Pro Support for assistance.
ICMP-based traceroute is not supported on the SuiteProjects Pro network. You must use a third-party TCP-based traceroute utility instead of the native tracert command on Windows and macOS.
Running a TCP Traceroute on Windows
Windows does not have a native utility to run TCP traceroute. To run it on Windows, you will need to install third-party software. The following steps use the Npcap library and the tracetcp utility.
The following steps require that you install Third Party Software, and are provided for illustration purposes only. Check your company's policies or with your IT department for instructions and advice before you install Third Party Software. SuiteProjects Pro|Oracle makes no representation or warranty concerning Third Party Software and shall have no obligation or liability with respect to Third Party Software.
To run a TCP traceroute on Windows:
-
Download the latest supported version of the Npcap library installer.
-
Double-click the downloaded executable file to launch the installation wizard and follow the on-screen instructions.
-
Download the latest supported version of the tracetcp utility.
-
Extract the files from the downloaded .zip archive and move the extracted files to
C:\Windows\System32\. Do not move the folder, open the folder and move the files instead. -
Press Win + R, then type
cmdand click OK. The Command prompt window appears. -
In the Command prompt, enter the following command.
tracetcp <company-id>.app.netsuitesuiteprojectspro.comNote:Replace
<company-id>with the unique identifier for your account, typically based on your SuiteProjects Pro Company ID.If you are running a TCP traceroute for a sandbox account, use
<company-id>.app.sandbox.netsuitesuiteprojectspro.com.The TCP traceroute output will be displayed in the command prompt.
Running a TCP Traceroute on macOS
macOS does not have a native utility to run TCP traceroute. To run it on macOS, you will need to install third-party software. The following steps use the Homebrew library and the tcptraceroute utility.
The following steps require that you install Third Party Software, and are provided for illustration purposes only. Check your company's policies or with your IT department for instructions and advice before you install Third Party Software. SuiteProjects Pro|Oracle makes no representation or warranty concerning Third Party Software and shall have no obligation or liability with respect to Third Party Software.
To run a TCP traceroute on macOS:
-
Press Cmd + Space, then enter
Terminal. The Terminal window appears. -
Enter the following command.
ruby -e "$(curl -fsSL https://raw.githubusercontent.com/Homebrew/install/master/install)" < /dev/null 2> /dev/nullThis will install the Homebrew package manager on your computer. Let the installation complete.
-
Enter the following command.
brew install tcptracerouteThis will install the Homebrew package manager on your computer. Let the installation complete.
-
Enter the following command.
sudo tracetcp <company-id>.app.netsuitesuiteprojectspro.comNote:Replace
<company-id>with the unique identifier for your account, typically based on your SuiteProjects Pro Company ID.If you are running a TCP traceroute for a sandbox account, use
<company-id>.app.sandbox.netsuitesuiteprojectspro.com.The TCP traceroute output will be displayed in the terminal.
Identifying Client Performance Issues
There are no universal requirements for the amount of Random Access Memory (RAM) or how fast a computer must be to run SuiteProjects Pro. The requirements depend on the way your computer is being used and on the other applications running on your computer.
To troubleshoot client performance issues:
-
Close all the applications you are not using. If you need to run more than one application consider increasing your computer resources.
-
Check your firewall application. Some of these applications check the page before loading it in your browser, which can cause a delay.
-
Update and run your anti-virus and anti-malware software to ensure that your computer is free of viruses, malware, or spyware.
-
Test on different browsers. You can install the Mozilla Firefox browser on your computer for free. Load the page using Mozilla Firefox, then load the page using Google Chrome. Use the browser which displays the page faster.
-
Determine whether there are add-ons running on your browser, like anti-virus or anti-phishing software, or anti-spam filters. Eliminate browser add-ons, one by one, to identify the cause of the issue.