KPI Settings
The KPI Settings control the graphs and meters shown in the Key Performance Indicators portlet.
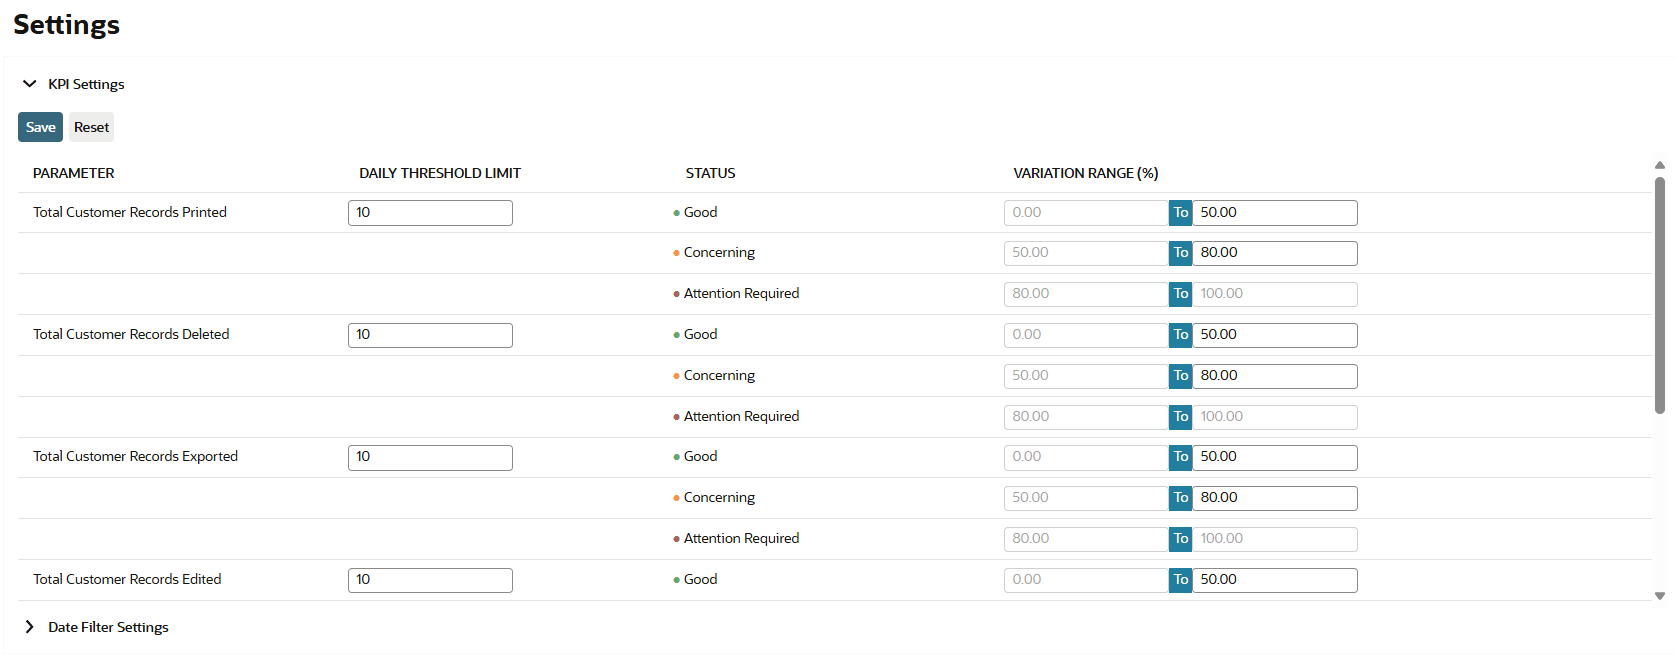
Modify the KPI Settings to set daily thresholds and variation ranges for the dashboard's KPI meter tiles.
The following screenshot shows how the KPI Settings screen look like:
To modify the KPI Settings:
-
Go to Compliance 360 > Settings > View.
-
Click the KPI Settings subtab.
-
In the Daily Threshold Limit fields, enter your preferred threshold limits for each KPI meter tiles.
For guidelines in setting threshold limits, see Daily Threshold Limits.
-
In the Variation Range fields, set your preferred variation ranges for the following statuses of each KPI meter:
-
Good
-
Concerning
-
Attention required
For guidelines and validations on setting variation range for KPI meters, see Variation Range.
-
Daily Threshold Limits
Daily thresholds control the colors and stats displayed in the KPI meter's gauges.
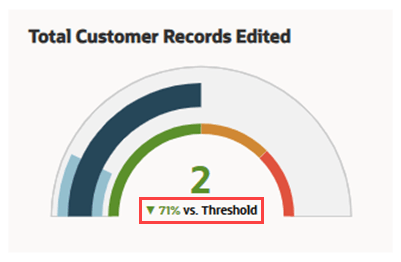
Threshold limits also affect the percentage change from the threshold value in KPI meter tiles.
The following screenshot highlights the percentage vs threshold value in the KPI meter tile, boxed in red:
When setting a daily threshold limit for KPI meter tile, consider the following:
-
You must only enter numbers, as non-numeric characters are not allowed.
-
Zero (0) is considered as a valid value.
-
If the Daily Threshold Limit field of a KPI meter is left blank, its KPI meter tile will be dimmed in the dashboard.
-
You must first set a threshold limit for a KPI meter tile before you can set its variation ranges. If the KPI meter's Daily Threshold Limit field is left blank, you cannot set a variation range for it.
-
The daily threshold limit in the KPI meter tile updates based on the time period filter applied in the Key Performance Indicators portlet.
For example, a daily threshold limit of 5 becomes 35 when applying the Week filter to the Key Performance Indicators portlet.
Variation Range
Variation ranges control the gauge meter colors and percentage displays in KPI meter tiles.
The Variation Range (%) column displays two sets of fields. The left set of fields are for the minimum range value and the right set of fields are for the maximum range value.
Set variation ranges for each status of a KPI meter tile. The following table outlines the color and range validations for each status:
|
Status |
Color |
Range Validations |
|---|---|---|
|
Good |
Green |
|
|
Concerning |
Orange |
|
|
Attention Required |
Red |
|
When setting variation ranges for KPI meter tiles, consider the following factors:
-
The total value of each range must be 100.
-
You can enter numbers with up to two decimals. (Example: 50.25 and 75.90)
-
You must enter a number not bigger than 100.
-
If the KPI meter count is below threshold limit, the gauge meter will be shown as green.
-
If the KPI meter count exceeds the 100% threshold limit, the gauge meter will be shown as red.
-
You cannot set a variation range for KPI meter statuses if the daily threshold limit for that particular KPI meter is left blank.