Headcount Analysis Trends
There are two headcount analysis trends: headcount trend, and hires and turnover trend. These trends show your year-to-date headcount, hiring, and turnover for each month of the selected year. Headcount includes all active and inactive employees with a hire date. It also includes employees whose termination or release date was before their hire date.
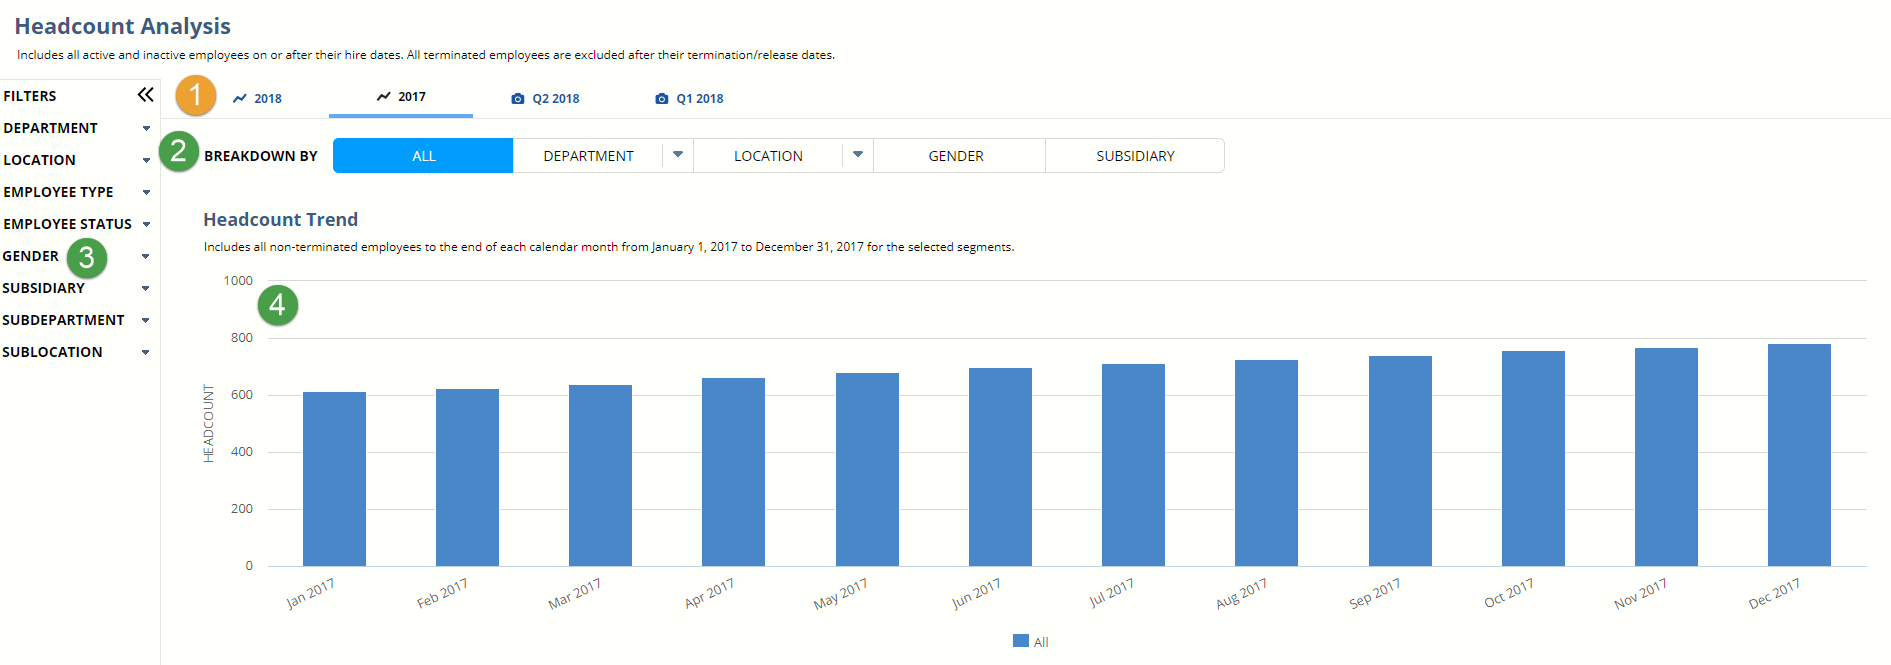
To access the headcount analysis trends, go to Reports > Employees/HR > Headcount Analysis. At the top of the page, click the year that you want to view.


|
1 |
Select the year that you want to view. |
|
2 |
Segment data by department, location, gender, or (with NetSuite OneWorld) subsidiary. You can also break down department and location by subdepartment and sublocation if needed. |
|
3 |
Choose how you'd like to filter the data. |
|
4 |
The Headcount Trend includes all non-terminated employees to the end of each month for the selected year and segments. Hover over each bar to see the total headcount for each month. |
|
5 |
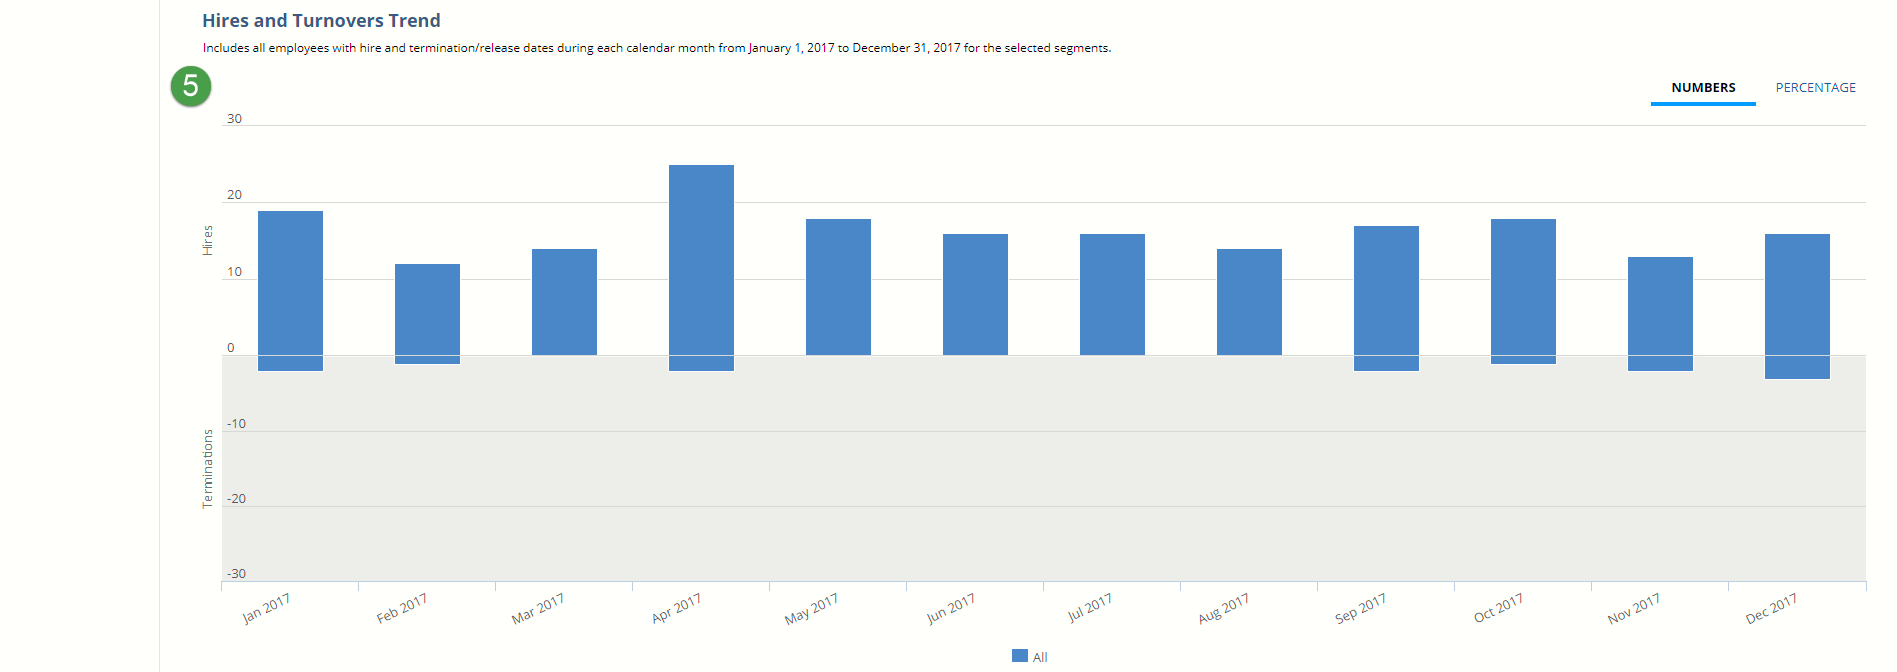
The Hires and Turnovers Trend shows all employees hired or terminated each month in the selected year and segments. Hover over each bar to see the total hires and terminations for that month. |
|
6 |
This table shows the data from the trends. The left side shows the total employee headcount at the end of each month, plus the number and percentage of hires and terminations. The right side shows the headcount data for the selected segments and filters. For example, if you select Location (All), you'll see the total headcount for each location. To copy and paste the data into other analysis tools, click Copy to Clipboard. |