Set Up Maps For Dashboards and Analyses

As the administrator, you define how data columns that you've modeled are displayed on maps. You configure the map data, then users can analyze the data in map views.

Map views allow users to display data on maps in different formats and to interact with data. As the administrator, you must configure the metadata that defines the mapping between business intelligence data and spatial data.

Spatial features such as shape definitions are managed by database administrators for your instance. If a shape geometry definition doesn’t exist for a particular column value, then the shape can't be shown on the map and might affect user interactions on the map.

  1. On the Layers tab, click Import Layers from the toolbar.
  2. In the Import Layers dialog, select the layers you want to use and click OK.
  3. Back on the Layers tab, select a layer and click the Edit Layers button.
  4. In the Edit Layer dialog, associate layers with columns so that users can display data in the map view.
    1. In Name, specify the layer name to display to users who work with map views.
    2. In Location, specify which background map the layer originates from. Click Location to select a different layer.
    3. In Description, specify information to help users when they hover over the layer name in the Map Formats area.
    4. In Layer Key, specifiy the column of spatial data that you can associate with data. Each column value corresponds to a "shape" that originates from the background map. For example, a MY_CITIES layer might have a layer key called CITY. The default value is a "best guess". Select the appropriate column from the list.

      There are various reasons why a country such as Mexico might be drawn as a white area on a map:

      • The column has a null value for the country of Mexico, but a shape exists for Mexico in the spatial column.

      • The column has a value for the country of Mexico, but no shape exists for Mexico in the spatial column.

      • The column has a value for the country of Mexico and the shape exists for Mexico in the spatial column, but the names are mismatched. The data columns might have the value MEX and the spatial column might have MXC.

    5. In BI Key Delimiter, Review the single ASCII character (such as a comma or underscore) to function as a delimiter for combining the data columns that form a key. This value is available only when multiple columns are specified for one key.
    6. In Geometry Type, specify whether the layer is a polygon, point, or line geometry layer. The type that you select affects the formatting that users can apply to the layer.
    7. In BI Key Columns Area, secifies the columns of data that you want to associate with the layer. You can have multiple columns associated with a single layer. You can select multiple columns from one subject area or from multiple subject areas. The columns and delimiter that you select must exactly match the name of the Layer Key value. Suppose the Layer Key value is STATE_CITY. You must select the STATE and CITY BI data columns and specify the underscore character in the BI Key Delimiter field.

      Use the various options in this area:

      • Add — Displays the list of available subject areas. Select a subject area and select all the data columns that you want to associate with the layer.

      • Delete — Deletes the selected key column.

      • Edit — Lets you edit the data columns associated with a layer.

      When a content designer creates a map view, a default main map is selected as the basis for that map view. If at least one data column from the analysis is associated with a layer that's associated with a main map, then that main map is selected by default.

    8. In Show Qualified Names, specifies whether to display the fully qualified name of the column in the BI Key Columns Area or simply the column name.
  5. Click OK to close the dialog.
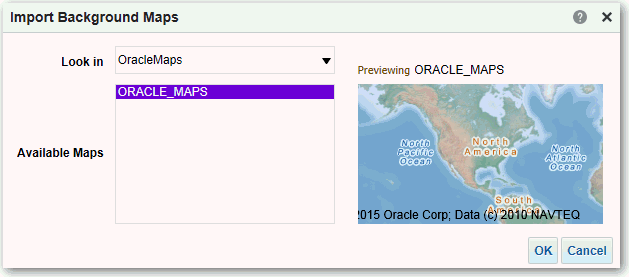
  6. Click the Background Maps tab, then click the Import Background Maps button.
  7. In the Import Background Maps dialog, select the connection in the Look in field and the main maps to use, then click OK.

    The connection that you select for the main map can be different from the connection for the layers or images.


    Description of map_layers2.gif follows
    Description of the illustration map_layers2.gif
  8. See Editing Background Maps for the steps required to prepare the background maps.
After you've added background maps and map layers, you can use the information to create a static image for a map. The static image is displayed to content designers and users who work with map views.