Choose Columns for Report Layouts
The layout that you select on the Select Layout page drives the remaining pages that you must complete to create the report.
For example, if you select the Table layout, Create Table is the next page displayed.
After you select a layout, select the data source columns to include in the report. As you select columns, sample data for the columns displays on the page. The selected columns display in the order selected.
Keep the following points in mind about sample data:
-
For data models: The Create Report process uses the sample data that is saved to the data model. If sample data isn't attached to the data model, the selected column headings display without data.
-
For uploaded spreadsheets: Sample data is displayed from the selected spreadsheet.
-
For subject areas: Sample data is displayed directly from the columns in the subject area.
Table Layout
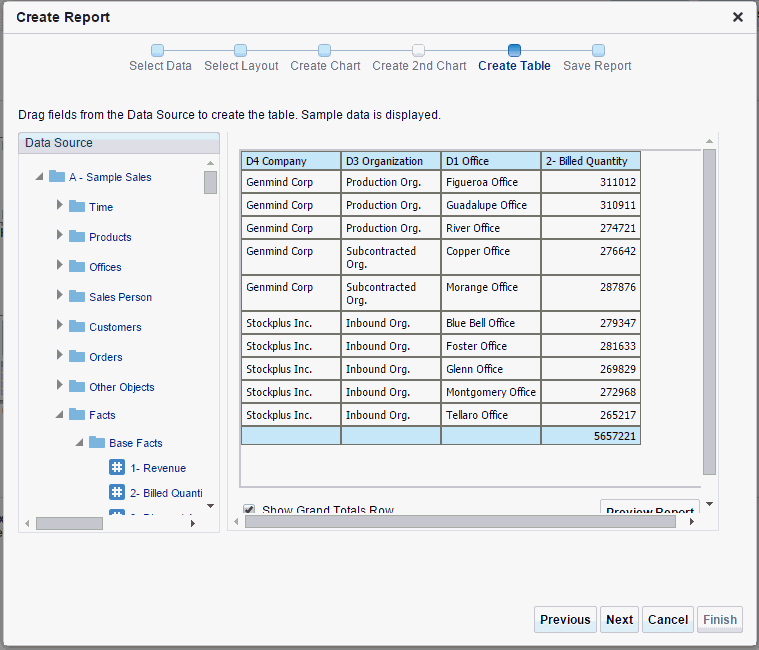
On the Create Table page you add columns to the layout by dragging and dropping them from the Data Source pane to the table area.
The columns are displayed in a simple tabular format and the column widths are automatically adjusted based on the number of selected columns as shown in the following illustration.
To remove a column from the table, hover your mouse over the upper-right hand corner of the column header and click Delete.
The Show Grand Totals Row option is selected by default to automatically display an aggregated summary row for all columns. Deselect this option to remove the row from the table.
Click Preview Report to display the report in the report viewer.
Click Next to proceed to save the report.
Chart Layout
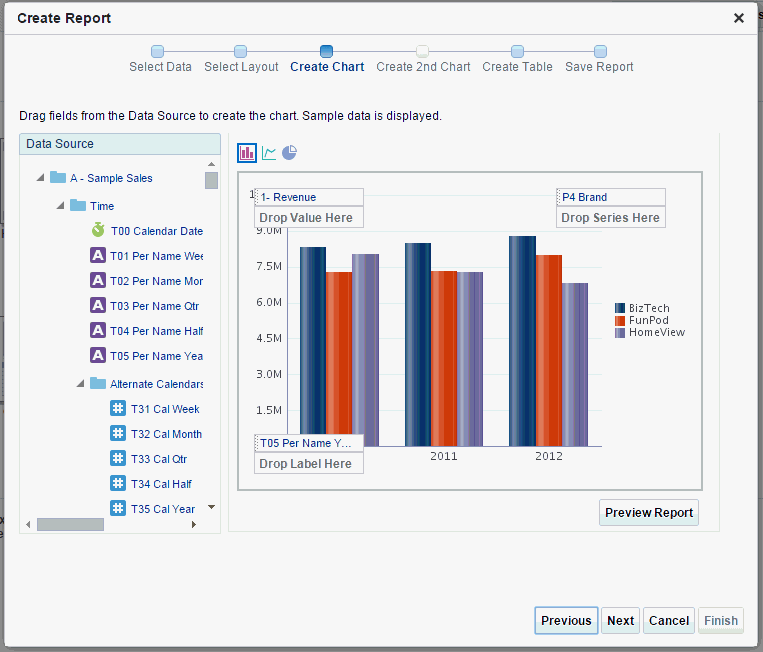
The Chart Layout page supports three types of charts. Choose the chart type by clicking its icon: Bar, Line, or Pie. Add columns to the chart by dragging and dropping them from the Data Source pane to the chart area.
The following figure shows the create chart layout. You can specify two values each to display for the chart Value, Series, and Label.
The layout editor supports a variety of more complex charts. To add more values to this chart or create another chart type, edit this layout in the layout editor after saving the report.
To remove a value from the chart, hover your mouse over the upper-right hand corner of the item label and click Delete.
Click Preview Report to display the report in the report viewer.
Click Next to proceed to save the report.
Chart and Table Layout
When you select the chart and table layout, you add columns to the Create Chart page first, click Next, and then the Create Table page displays with the columns that you previously selected for the chart.
You can also add additional columns and remove columns on this page.
Click Next to proceed to save the report.
Pivot Table Layout
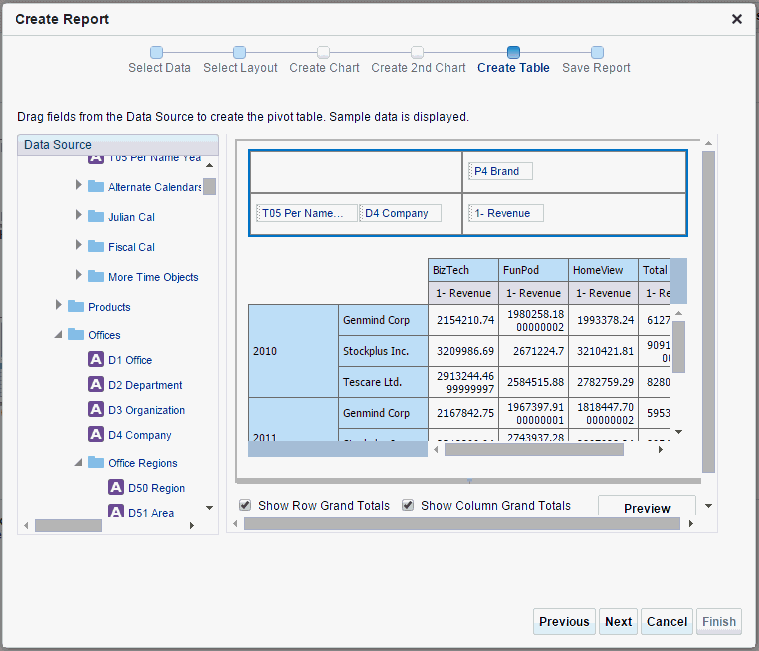
When you select columns for the pivot table layout, the columns display on the Create Table page.
The figure below shows the columns displayed.
The Show Row Grand Totals option is selected by default. Deselect this option to hide the row in the table that includes the grand total for each column.
The Show Column Grand Totals option is selected by default. Deselect this option to hide the column in the table that includes the grand total for each row.
Click Switch Rows and Columns to flip the rows and columns axes.
Click Preview Report to display the report in the report viewer.
Click Next to proceed to save the report.
Chart and Pivot Table Layout
When you select the chart and pivot table layout, you add columns to the Create Chart page first, click Next, and then the Create Table page displays with the columns that you previously selected for the chart. You can also add additional columns and remove columns on this page.
Click Next to proceed to save the report.
Two Charts and Table Layout
When you select the two charts and table layout, you add columns to the Create Chart page first, click Next, and then Create 2nd Chart.
Once you add columns to the Create 2nd Chart page, click Next to display the Create Table page. The Create Table page displays with the columns that you already selected for the first chart. You can also add additional columns and remove columns on this page.
Click Next to proceed to save the report.


