Insert Components to the Template
This section includes topics that give more information on inserting components to the template.
Insert a Field
This dialog enables you to select data elements from the data source and insert them into the template.
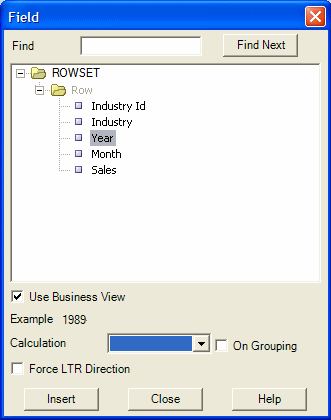
In the Insert group select Field to open the Field dialog. The dialog shows the structure of the loaded data source in a tree view, as shown in the following figure:
Select a field that represents a single data field (a leaf node of the tree) and select Insert (you can also insert the field by dragging and dropping it into the document, or by double-clicking the field). A text form field with hidden Publisher commands is inserted at the cursor position in the template. You may either select and insert additional data fields or close the dialog by clicking the Close button.
About the Insert Field Dialog
The fields in the Field dialog are explained in these sections.
The Insert Field dialog fields are described in the following sections:
Find
For an XML document with a large and complicated structure, use the find functionality to find a specific field. Enter a partial string of the field name you are searching into the Find field and click Find Next.
The next occurrence of a data element that includes the search expression is selected. Click the Find Next button again to see the next occurrence.
Force LTR (Left-to-Right) Direction
Force LTR Direction check box is only needed if you are using the template in a language that prints the characters from right to left, such as Arabic or Hebrew.
Use this feature to force left-to-right printing for fields such as phone numbers, addresses, postal codes, or bank account numbers.
Calculation
Calculation feature enables you to perform aggregation functions on data fields, such as sum, average, count, minimum, and maximum.
For example, if you select sum for a data field, then the field shows the sum of all occurring values for this data field, depending on the grouping.
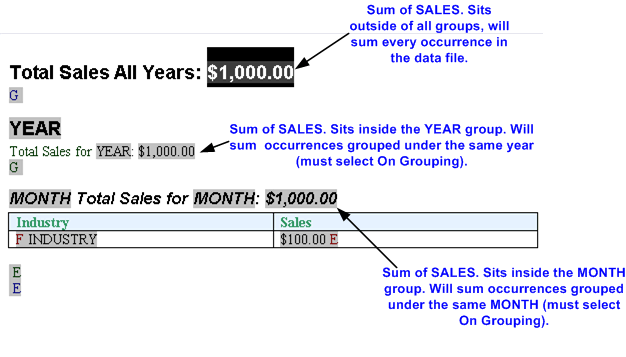
It's important to understand the grouping context (marked by G and E form fields) to know exactly which fields are accumulated. If you insert a data field with an accumulation function into a repeating section (marked by G and E processing instruction form fields), you must select On Grouping to accumulate the data for the occurrences within the group. If you do not want the accumulation to be restricted to the group, you must place the accumulation field outside the group.
The following figure shows a grouping context example:
Also note that the data field must be a valid XSL number for the accumulation functions to work. Formatted numbers cannot be processed by Publisher (for example a number using a thousands separator: 10,000,000.00 cannot be processed).
For more information on groups in a template using the Template Builder, see Insert a Repeating Group and Define Groups.
Insert a Table Using the Table Wizard
The Insert Table Wizard enables you to create standard reports. On the Insert menu select Table Wizard and complete these steps.
Step 1: Select Report Format
Start by selecting the basic report format.
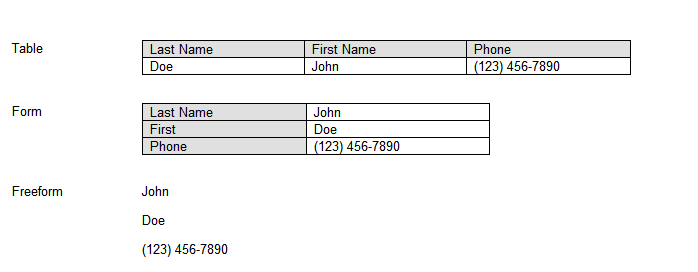
Choose from Table, Form, or Free Form. The following illustration shows examples of each format.
Step 2: Select Table Data
An XML document can include multiple grouped datasets.
For example, a purchase order XML document may contain header level information, lines, shipments and contacts.
In this step, select the data group that contains the data that is required for the table.
For example, in the Balance Letter sample RTF template (found in the Template Builder installed files under Oracle\Oracle Analytics Publisher\Oracle Analytics Publisher Desktop\samples\RTF Templates), the sample XML file contains three data groups as follows:
-
ARXCOBLX/G_CUSTOMER
-
ARXCOBLX/G_CUSTOMER/G_CURRENCY
-
ARXCOBLX/G_CUSTOMER/G_CURRENCY/G_INVOICES
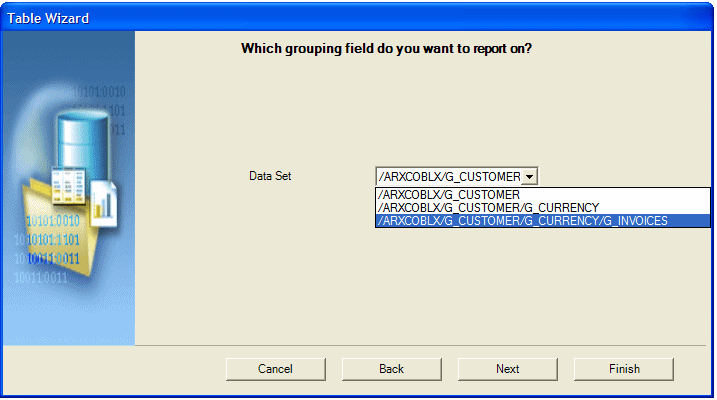
The Table Wizard presents a list of the available data groups in the XML data file. Select the group that contains the data fields for the table.
The following illustration shows the Table Wizard Step 2: Selecting Table Data.
To build a table to list the invoices contained in the data, select:
ARXCOBLX/G_CUSTOMER/G_CURRENCY/G_INVOICES
as the dataset.
Step 3: Select Data Fields
The Table Wizard presents the data fields from the selected dataset.
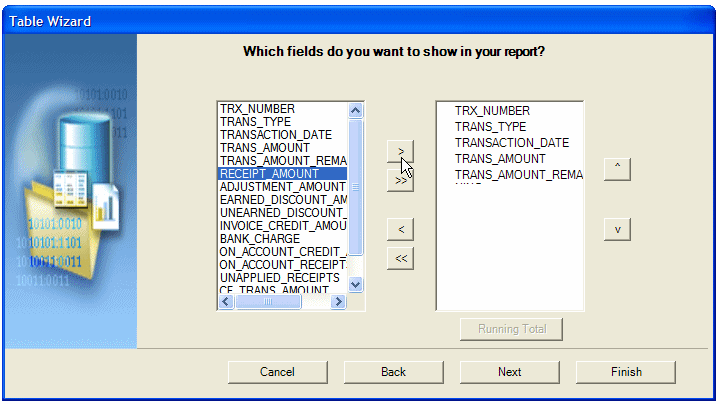
The following illustration shows the Table Wizard Step 3: Selecting Data Fields.
Use the shuttle buttons to select the data fields to show in the table. Use the up and down arrows to reorder the fields after selecting them.
Step 4: Group the Table
This step enables you to regroup the data by a particular field.
This is optional.
For example, if you are building a table of invoices, you may want to group all invoices of a particular type or date to be grouped together in the report.
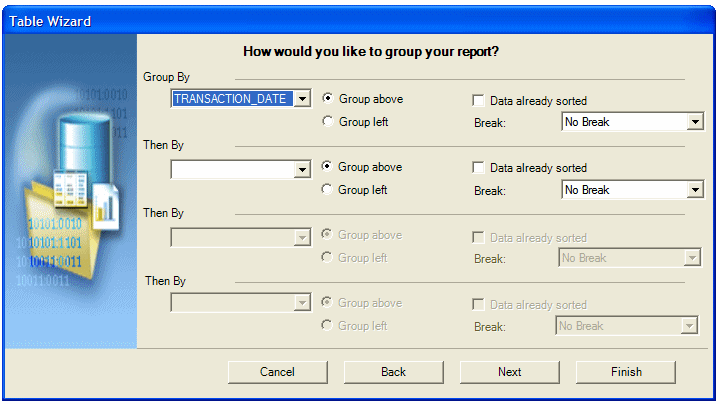
The following illustration shows the Table Wizard Step 4: Grouping the Table.
There're two options for grouping: Group Left or Group Above. Group Left creates a nested table. The Group By field displays to the left in the outer table. Group Above creates a new table for each new value of the group by field, displaying the value of the group by field as a table title.
Examples follow:
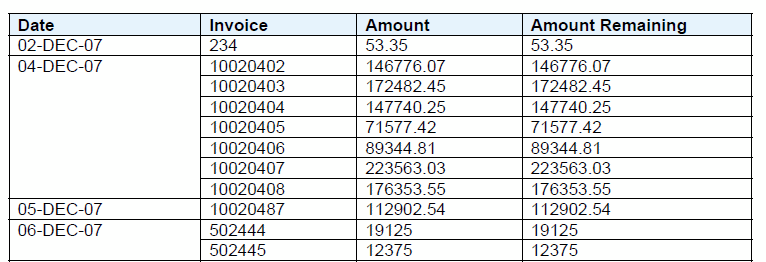
Group Left groups the group by element occurrences together, as shown in the following illustration.
Group Above shows the result as a table with a header, as shown in the following illustration.

Description of the illustration xdo11g_tb_tbwiz_grpab.gif
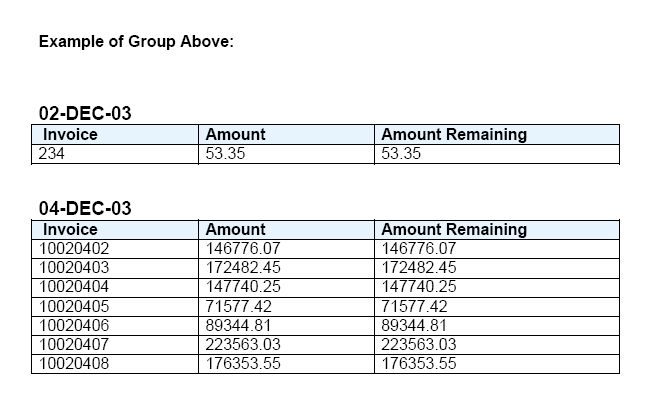
Description of the illustration groupabove.gif
When you select an element to group by, Publisher sorts the data by the grouping element. If the data is already sorted by the grouping element, then select the Data already sorted check box. This selection improves performance.
Step 5: Insert a Break for the Group
Use the Break option to insert either a Page break or Section break after each occurrence of this group.
Note that a Section break can only be created on the top-level group. The subsequent grouping options only display the Page break option.
A page break starts the next group on a new page; a section break starts the next group on a new page, reset page numbering, reset headers and footers, and reset any running calculations for each occurrence of the group.
Step 6: Sort the Table
You can sort the data in the table by up to four different fields.
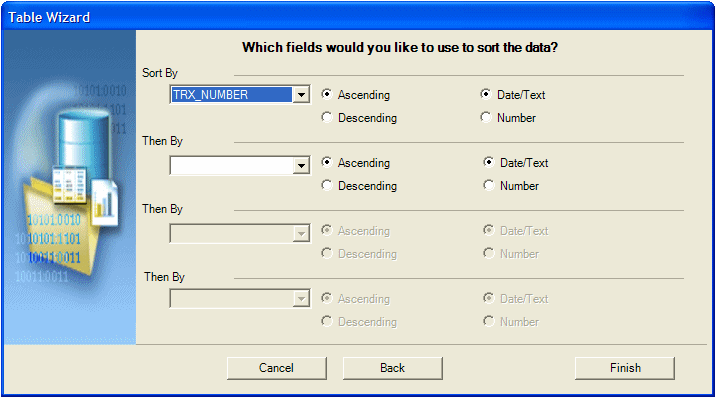
Select a field and then define the sorting order (ascending or descending), and select the correct data type for the field. For example, if text is selected, "12" comes before "2" (alphanumerical order). If number is selected, "2" comes before "12".
The following illustration shows the Table Wizard Step 6: Sorting the Table.
Insert a Table or Form Using the Insert Table/Form Dialog
The Insert Table/Form dialog is the most flexible tool of the template builder. It allows you to perform these tasks.
-
Create a simple or nested table with a variable number of rows.
-
Associate a group of data elements, such as a complete invoice or a purchase order line, with a form in the document that is repeated for each occurrence of the data element.
-
Select and define a layout for all the data fields in the template.
-
Group or re-group the data.
The Insert Table/Form dialog shows you two tree view panes. The left pane shows the data source structure, while the right pane shows the elements that are copied to the template when you click the Insert button.
Select Data Fields
First select the data fields to insert in the template and then define how to format them.
Drag an XML element from the left Data Source pane to the right Template pane. If the XML element has children, you see a pop-up menu with the following options:
- Drop Single Node
- Drop All Nodes
- Cancel
Select Drop Single Node if you want to move only the selected node or Drop All Nodes if you want to move the node and all its children.
If you drag an additional data field from the left Data Source pane to the right Template pane, it's either inserted at the same level (Same Level) or below the node (Child) where you release the node. The Insert Position box defines where the node is inserted.
If you use the left mouse button for drag and drop, then the node and all children are copied. However, if you use the right mouse button for dragging, a dialog is displayed when you release the mouse button. The dialog gives you the option to copy either only the selected node or the selected node and all children.
Define the Layout
When you select an element in the right Template pane, you see its properties as well as a preview of how the node is rendered.
There're two kinds of nodes:
-
Data Fields
-
Data Groups
Data Field nodes (leaf nodes) do not have any child nodes. They represent simple attributes such as the total amount for an invoice or the subtotal for a purchase order line.
Data Group nodes (parent nodes) are nodes that do have child nodes. Typically, they don't represent data attributes, but groups of data - such as an invoice, a purchase order, a purchase order line, or a shipment.
Data Field Properties
If a Data Field node is selected, its properties are shown in the Properties pane. Use these options to describe how the Template Builder should display the field.
-
Calculation
You can select one of the aggregation functions for the data fields. These functions (besides count) only have an effect when there's more than one of the data fields in the context where you use the function.
-
Force LTR (Left-to-Right) Direction
This option is only needed if you are using the template in a language that displays characters from right to left, such as Arabic or Hebrew. Use this option to force left-to-right printing for fields such as phone numbers, addresses, postal codes, or bank account numbers.
Data Group Properties
The order in which the data elements are shown reflects the order of the columns in the table. If you want to reorder the columns, change the Insert Position box from Child to Same Level. Then drag the elements into the correct order.
If a Data Group node is selected, its properties are shown in the Properties pane. Use these options to describe how the Template Builder should render the group:
-
Style
To display the data as a horizontal table with a header, select Table. To display the fields below each other with labels in a table, use Form. If you want to insert the fields into a free-form text section that should be repeated for this element, select Free Form.
-
Grouping
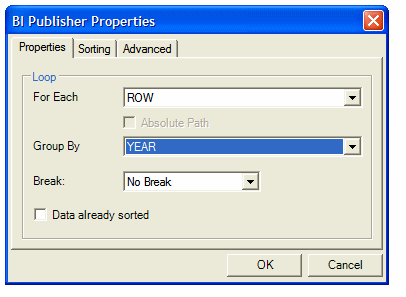
Grouping is an advanced operation that allows you to group the data by a specific element in the data. For example, you might want to group all invoices by customer. You can select a child element of the selected element as a grouping criterion. See Group Nodes.
-
Show Grouping Value
This property is shown only if you selected a node created by the Grouping functionality. By default, the field you've selected to group the data by is displayed in the report. If you don't want the grouping data field displayed, then select No.
-
Sort By
Select an element by which the data groups are sorted.
-
Sort Order
If you selected an element for Sort By you can select if the data should be sorted either ascending or descending.
-
Sort Data Type
If you selected an element for Sort By the data is by default sorted as text. That means that 12 is shown after 111. If the data is numeric, select Number as the sort data type.
-
Break
This property allows you to insert a page break or a section break between every data group. If you select New Page per Element, then a page break is inserted between each element after the first occurrence.
Tip:
To insert a page break before the first occurrence of an element, use Microsoft Word's page break command.
If you select New Section per Element, then a section break is created for each data group. A section break has the following effects: it inserts page break, it resets the page numbers and new data can be displayed in the header and footer. You typically use this option to print multiple documents (for example invoices or purchase orders) to a single PDF file.
Insert Tables and Forms
Once you've dragged all data fields over and defined the layout, select the Insert button to place the tables and forms at the cursor position in the document.
Group Nodes
You can group any Data Group node by any of its child Data Field Nodes. For example if you've sales data for multiple quarters, you may want to show the sales data organized by quarter. In this case you would group the sales data rows by the quarter element.
Assume the following structure:
Sales Transaction
       Quarter
       Customer
       Amount
To group the child nodes of a node (Sales Transaction), you select one of the child nodes (Quarter) as the grouping property of the parent node (Sales Transaction). The Template Builder makes this node (e.g. quarter) the parent of the other child nodes (Customer and Amount).
The new structure looks like the following:
Sales Transaction
       Quarter
            Customer
            Amount
The grouping criterion (Quarter) now behaves like any other Data Group Node with children. That means that you can define the layout of its children using the Create As Table, Style, Label, Grouping, and Show Grouping Value properties.
Understand the Fields Inserted to the Template
There're distinct differences between the types of fields in templates.
The Insert Table/Form Dialog creates two kinds of form fields:
- Form fields representing data elements.
- Form fields with processing instructions for repeating table rows or document sections.
Form fields representing data elements are replaced with the data when the template is processed. Form fields indicating repeating sections are shown as for-each and end for-each in the document.
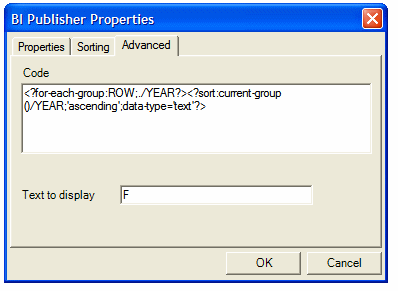
If you have selected the Abbreviated form field display option, then the for-each and end for-each form fields are displayed as F and E. The section of the document encapsulated by these two elements is repeated, if the associated data element is repeated in the data.
Insert a Chart
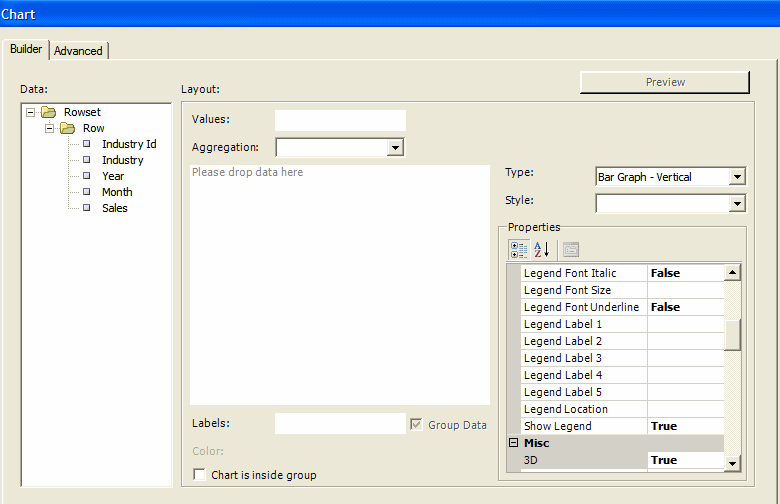
Use the Chart dialog to insert a chart into a template.
The following figure shows the Chart dialog.
Chart Type
Publisher supports a large variety of chart types. Expand the Type list to select the chart type for this template.
Values
Drag and drop the data value you want to measure to the Values field (for example, SALES).
You can select multiple Value elements (measures).
The Values field changes depending on the Chart Type that you select:
-
Combination Graph - Enables three fields for the Value selections.
-
Scatter Graph - Compares pairs of values. Drag and drop the X and Y data elements to compare.
-
Bubble Graph - Compares sets of three values. Similar to the scatter graph, the third value is displayed as the size of the bubble.
-
Stock Graph - Drag and drop the elements that represent the Open, High, Low, Close, and Volume values for the stock graph.
Aggregation
Use the Aggregation option in the Properties pane to do functions such as sum, count, and average.
You can choose to aggregate the Values data as a sum, a count, or an average.
Labels
Drag and drop the data element for which you want to see the Value charted (for example, Year).
Select Group Data to group the occurrences of the label element before rendering it in the chart. For example, if you are charting Sales by Year, then selecting Group Data accumulates the values for Year, so that only one occurrence of each year is displayed in the chart. If you do not select Group Data, then the value for every occurrence of Year in the data is plotted separately.
Color
If you want to add a series element to the chart, then drag and drop the element to display as a series. Each value is displayed as a new color in the graph.
Chart is Inside Group
Select this box if the chart is inside a grouping and you want the chart to display data only for the occurrences of the data elements within the group.
Properties
The properties region enables you to change value and label display names, select color, font, and other display options for the chart.
The properties list changes depending on the chart selection.
Insert a Repeating Group
Follow these steps to insert a repeating group.
Create Grouping Fields Around an Existing Block
Follow these steps to create a group around an existing block of text or elements in a template.
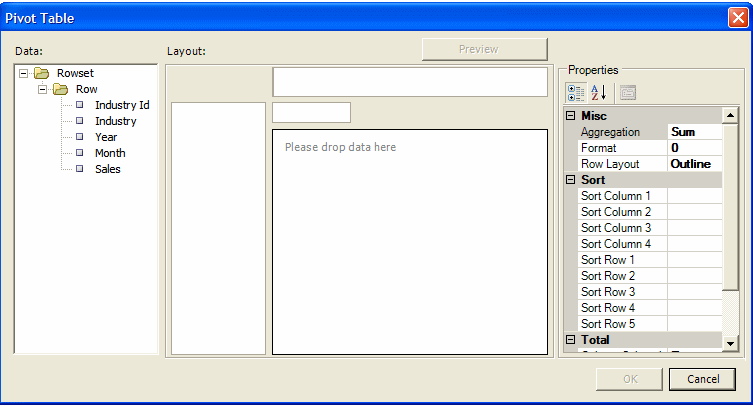
Manually Edit a Pivot Table
This section describes the code inserted by the pivot table builder.
When the Template Builder inserts the pivot table, it inserts a Publisher command of the following structure:
<?crosstab: ctvarname; "data-element"; "rows"; "columns"; "measures"; "aggregation"?>| Parameter | Description | Example |
|---|---|---|
|
Ctvarname |
Crosstab variable name. This is automatically generated by the Add-in. |
C123 |
|
data-element |
This is the XML data element that contains the data elements to include in the pivot table. If the pivot table is inside a repeating group, this field must be manually edited to achieve the expected results. See the table following this section. |
"//ROW" |
|
rows |
This parameter defines the XML elements for row headers. The ordering information is specified within "{" and "}". The first attribute is the sort element. If not specified, the row header element is used as the sort element. Supported attributes are:
You can specify more than one sort element, for example: "emp-full-name {emp-lastname,o=a,t=n}{emp-firstname,o=a,t=n}" sorts employee by last name and first name. Note that the sort element can be any element in the dataset, and doesn't have to be included in the pivot table. In the preceding example, |
In the example, the first row header is "REGION". It's sorted by "REGION", order is ascending, and type is text. The second row header is "DISTRICT". It's sorted by "DISTRICT", order is ascending, and type is text. |
|
columns |
This parameter defines the XML elements for column headers. The ordering information is specified within "{" and "}". The first attribute is the sort element. If not specified, the column header element is used as the sort element. Supported attributes are:
You can specify more than one sort element, for example: "emp-full-name {emp-lastname,o=a,t=n}{emp-firstname,o=a,t=n}" sorts employee by last name and first name. Note that the sort element can be any element in the dataset, and doesn't have to be included in the pivot table. In the preceding example, |
In the example, the first column header is "ProductsBrand". It's sorted by "ProductsBrand"; the order is ascending, and type is text. The second column header is "PeriodYear". It's sorted by "PeriodYear"; the order is ascending, and type is text. |
|
measures |
This parameter defines the XML elements used as measures. |
|
|
aggregation |
This parameter specifies the aggregation function. Currently, the only supported value is "sum". |
|
Example
This example uses the following XML data:
- <ROWSET>
- <ROW>
  <ProductsType>COATINGS</ProductsType>
  <ProductsBrand>Enterprise</ProductsBrand>   <Region>CENTRAL REGION</Region>
  <District>CHICAGO DISTRICT</District>
  <PeriodYear>1998</PeriodYear>
  <Revenue>1555548.0</Revenue>
  <PrevRevenue>125968</PrevRevenue>
  <Units>11</Units>
  </ROW>
...
</ROWSET>
The full dataset includes four values for ProductsBrand, four values for Region, and two values for PeriodYear to be displayed in the pivot table.
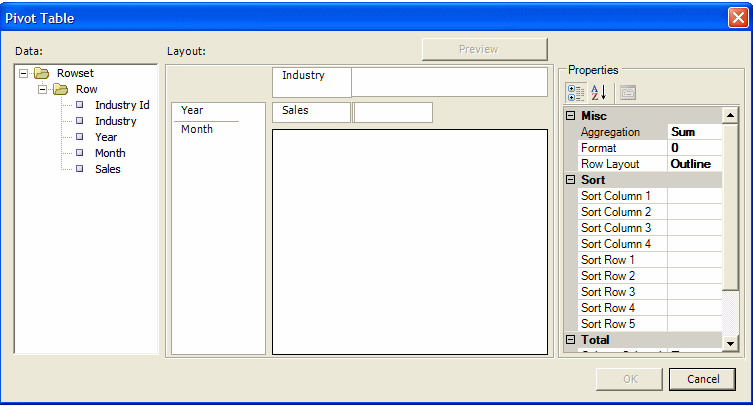
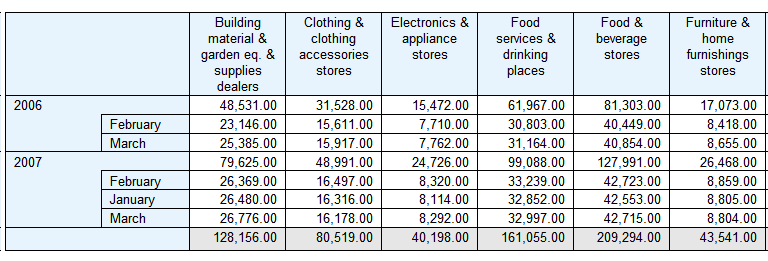
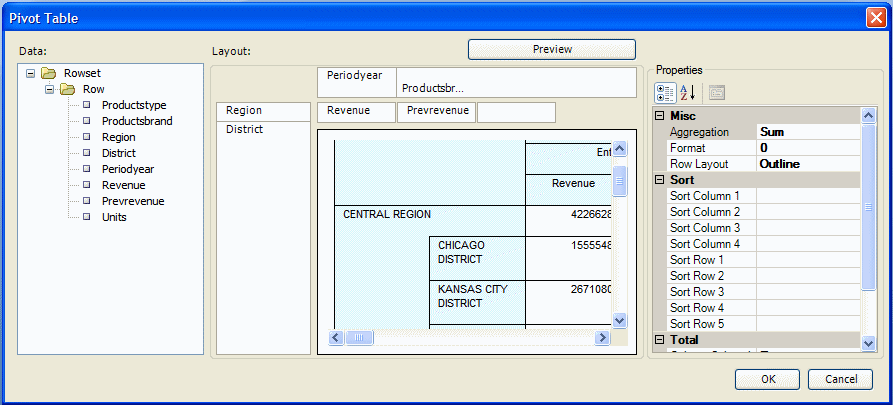
Using the Template Builder for Word and the sample XML file you can create a pivot table as shown in the following illustration.
The generated XDO command for this pivot tables is as follows:
<?crosstab:c4536;"//ROW";"Region{,o=a,t=t},District{,o=a,t=t}";"PeriodYear{,o=a,t=t},ProductsBrand{,o=a,t=t}";"Revenue,PrevRevenue";"sum"?>
Running the command on the given XML data files generates this XML file "cttree.xml". Each XPath in the "cttree.xml" is described in the following table. The information in the table is to help you understand how Publisher constructs the pivot table. The generated cttree.xml file isn't accessible for viewing or updating.
| Element | XPath | Count | Description |
|---|---|---|---|
|
C0 |
/cttree/C0 |
1 |
This contains elements which are related to column. |
|
C1 |
/cttree/C0/C1 |
4 |
The first level column "ProductsBrand". There're four distinct values, shown in the label H element. |
|
CS |
/cttree/C0/C1/CS |
4 |
The column-span value. It's used to format the pivot table. |
|
H |
/cttree/C0/C1/H |
4 |
The column header label. There're four distinct values "Enterprise", "Magicolor", "McCloskey" and "Valspar". |
|
T1 |
/cttree/C0/C1/T1 |
4 |
The sum for measure 1, which is Revenue. |
|
T2 |
/cttree/C0/C1/T2 |
4 |
The sum for measure 2, which is PrevRevenue. |
|
C2 |
/cttree/C0/C1/C2 |
8 |
The first level column "PeriodYear", which is the second group-by key. There're two distinct values "2001" and "2002". |
|
H |
/cttree/C0/C1/C2/H |
8 |
The column header label. There're two distinct values "2001" and "2002". Because it's under C1, the total number of entries is 4 x 2 = 8. |
|
T1 |
/cttree/C0/C1/C2/T1 |
8 |
The sum for measure 1 "Revenue". |
|
T2 |
/cttree/C0/C1/C2/T2 |
8 |
The sum for measure 2 "PrevRevenue". |
|
M0 |
/cttree/M0 |
1 |
This contains elements that are related to measures. |
|
M1 |
/cttree/M0/M1 |
1 |
This contains summary for measure 1. |
|
H |
/cttree/M0/M1/H |
1 |
The measure 1 label, which is "Revenue". |
|
T |
/cttree/M0/M1/T |
1 |
The sum of measure 1 for the entire Xpath from "//ROW". |
|
M2 |
/cttree/M0/M2 |
1 |
This contains summary for measure 2. |
|
H |
/cttree/M0/M2/H |
1 |
The measure 2 label, which is "PrevRevenue". |
|
T |
/cttree/M0/M2/T |
1 |
The sum of measure 2 for the entire Xpath from "//ROW". |
|
R0 |
/cttree/R0 |
1 |
This contains elements that are related to row. |
|
R1 |
/cttree/R0/R1 |
4 |
The first level row "Region". There're four distinct values, shown in the label H element. |
|
H |
/cttree/R0/R1/H |
4 |
This is the row header label for "Region". There're four distinct values "CENTRAL REGION", "EASTERN REGION", "SOUTHERN REGION" and "WESTERN REGION". |
|
RS |
/cttree/R0/R1/RS |
4 |
The row-span value. It's used to format the crosstab table. |
|
T1 |
/cttree/R0/R1/T1 |
4 |
The sum of measure 1 "Revenue" for each distinct "Region" value. |
|
T2 |
/cttree/R0/R1/T2 |
4 |
The sum of measure 1 "Revenue" for each distinct "Region" value. |
|
R1C1 |
/cttree/R0/R1/R1C1 |
16 |
This contains elements from combining R1 and C1. There're 4 distinct values for "Region", and four distinct values for "ProductsBrand". Therefore, the combination is 4 X 4 =16. |
|
T1 |
/cttree/R0/R1/R1C1/T1 |
16 |
The sum of measure 1 "Revenue" for each combination of "Region" and "ProductsBrand". |
|
T2 |
/cttree/R0/R1/R1C1/T2 |
16 |
The sum of measure 2 "PrevRevenue" for each combination of "Region" and "ProductsBrand". |
|
R1C2 |
cttree/R0/R1/R1C1/R1C2 |
32 |
This contains elements from combining R1, C1 and C2. There're 4 distinct values for "Region", and four distinct values for "ProductsBrand", and two distinct values of "PeriodYear". Therefore, the combination is 4 X 4 X 2 = 32. |
|
T1 |
/cttree/R0/R1/R1C1/R1C2/T1 |
32 |
The sum of measure 1 "Revenue" for each combination of "Region", "ProductsBrand" and "PeriodYear". |
|
T2 |
/cttree/R0/R1/R1C1/R1C2/T2 |
32 |
The sum of measure 2 "PrevRevenue" for each combination of "Region", "ProductsBrand" and "PeriodYear". |
|
R2 |
/cttree/R0/R1/R2 |
18 |
This contains elements from combining R1 "Region" and R2 "District". Because the list of values in R2 has dependency on R1, the number of entries isn't just a simple multiplication. |
|
H |
/cttree/R0/R1/R2/H |
18 |
The row header label for R2 "District". |
|
R1N |
/cttree/R0/R1/R2/R1N |
18 |
The R2 position number within R1. This is used to check if it's the last row, and draw table border accordingly. |
|
T1 |
/cttree/R0/R1/R2/T1 |
18 |
The sum of measure 1 "Revenue" for each combination "Region" and "District". |
|
T2 |
/cttree/R0/R1/R2/T2 |
18 |
The sum of measure 2 "PrevRevenue" for each combination of "Region" and "District". |
|
R2C1 |
/cttree/R0/R1/R2/R2C1 |
72 |
This contains elements from combining R1, R2 and C1. |
|
T1 |
/cttree/R0/R1/R2/R2C1/T1 |
72 |
The sum of measure 1 "Revenue" for each combination of "Region", "District" and "ProductsBrand". |
|
T2 |
/cttree/R0/R1/R2/R2C1/T2 |
72 |
The sum of measure 2 "PrevRevenue" for each combination of "Region", "District" and "ProductsBrand". |
|
R2C2 |
/cttree/R0/R1/R2/R2C1/R2C2 |
144 |
This contains elements from combining R1, R2, C1 and C2, which gives the finest level of details. |
|
M1 |
/cttree/R0/R1/R2/R2C1/R2C2/M1 |
144 |
The sum of measure 1 "Revenue". |
|
M2 |
/cttree/R0/R1/R2/R2C1/R2C2/M2 |
144 |
The sum of measure 2 "PrevRevenue". |
Insert a Pivot Table in a Repeating Group
When you create a pivot table inside a repeating group you must manually edit the pivot table code so that the elements included in the pivot table respect the grouping context. The edit to the code depends on how you grouped the data.
Procedure When Using the Template Builder "Group by" Feature
If your data is flat and you used the Template Builder's Group By feature to group your data, then use this procedure. After inserting the pivot table, open the Publisher Properties dialog to view the <?crosstab...?> code. In the crosstab command, update the data-element component to current-group().
For example, assume in the preceding example you created a repeating group around the pivot table that is grouped by the <Region> element.
To edit the pivot table code:
Example 13-1 Procedure When the Data is Already Grouped
If the data input to the Template Builder is already grouped, then you must insert the appropriate XPath for the data-element component to ensure that the pivot table only includes the elements in the current group.
For example, assume the data for this report is structured as follows:
<ROWSET> <REGION>
  <RegionName>CENTRAL REGION</RegionName>
  <ProductList>
    <Product>
      <ProductsBrand>Enterprise</ProductsBrand>
      <District>CHICAGO DISTRICT</District>
      <PeriodYear>2001</PeriodYear>
      <Revenue>1555548.0</Revenue>
      <PrevRevenue>125968</PrevRevenue>
      <Units>11</Units>
   </Product>
In your template you insert a repeating group based on the <REGION> element. When you insert the pivot table within the repeating group, the code appears as
<?crosstab:c10959;"//Product";"District{,o=a,t=t},ProductsBrand{,o=a,t=t}";"PeriodYear{,o=a,t=t}";"Revenue,PrevRevenue";"sum"?>In this case, to instruct Publisher to use only the elements under the current REGION grouping, edit the data-element to use the relative XPath as follows: .//Product. The edited code is:
<?crosstab:c10959;".//Product";"District{,o=a,t=t},ProductsBrand{,o=a,t=t}";"PeriodYear{,o=a,t=t}";"Revenue,PrevRevenue";"sum"?>Insert and Edit Conditional Regions
A conditional region is an area that is surrounded by a conditional statement. If the statement tests true, the area is displayed in the report; if the condition tests false, the area is suppressed from the report.
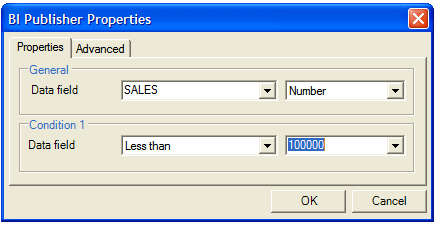
For example, the data contains sales information. The report contains a table that displays sales by industry. You want this table in the report to display information for industries with sales amounts lower than 100,000. Using the insert conditional region functionality, you can select the region that contains the sales table and insert the condition that the sales element must be less than 100,000.
To edit the conditional region, double-click the inserted form field to launch the dialog for editing; or, right-click the form field and select BI Publisher, then Properties.
Insert Conditional Formatting
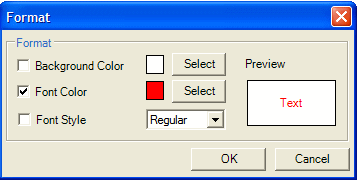
Using the Conditional Format feature you can insert simple conditional formats to apply to table rows or cells. The dialog provides several common options that you can select and the Template Builder inserts the code automatically. The Conditional Format dialog supports two conditions per field.
To edit the conditional format, double-click the inserted form field to launch the dialog for editing; or, right-click the form field and select Publisher, then Properties.
