1 Get Started with Creating Analyses and Dashboards
This chapter describes how to get started with creating analyses and dashboards.
About Oracle Transactional Business Intelligence
Oracle Transactional Business Intelligence helps you quickly uncover business insights and make more informed business decisions.
Oracle Transactional Business Intelligence helps you query your business data and create analyses to answer your business questions. You can present data in easy-to-understand formats (such as tables and graphs), create dashboards, and share the results of analyses.
About Visualizations and Analyses
You use visualizations and analyses to find the answers that you need from key business data displayed in graphical formats.
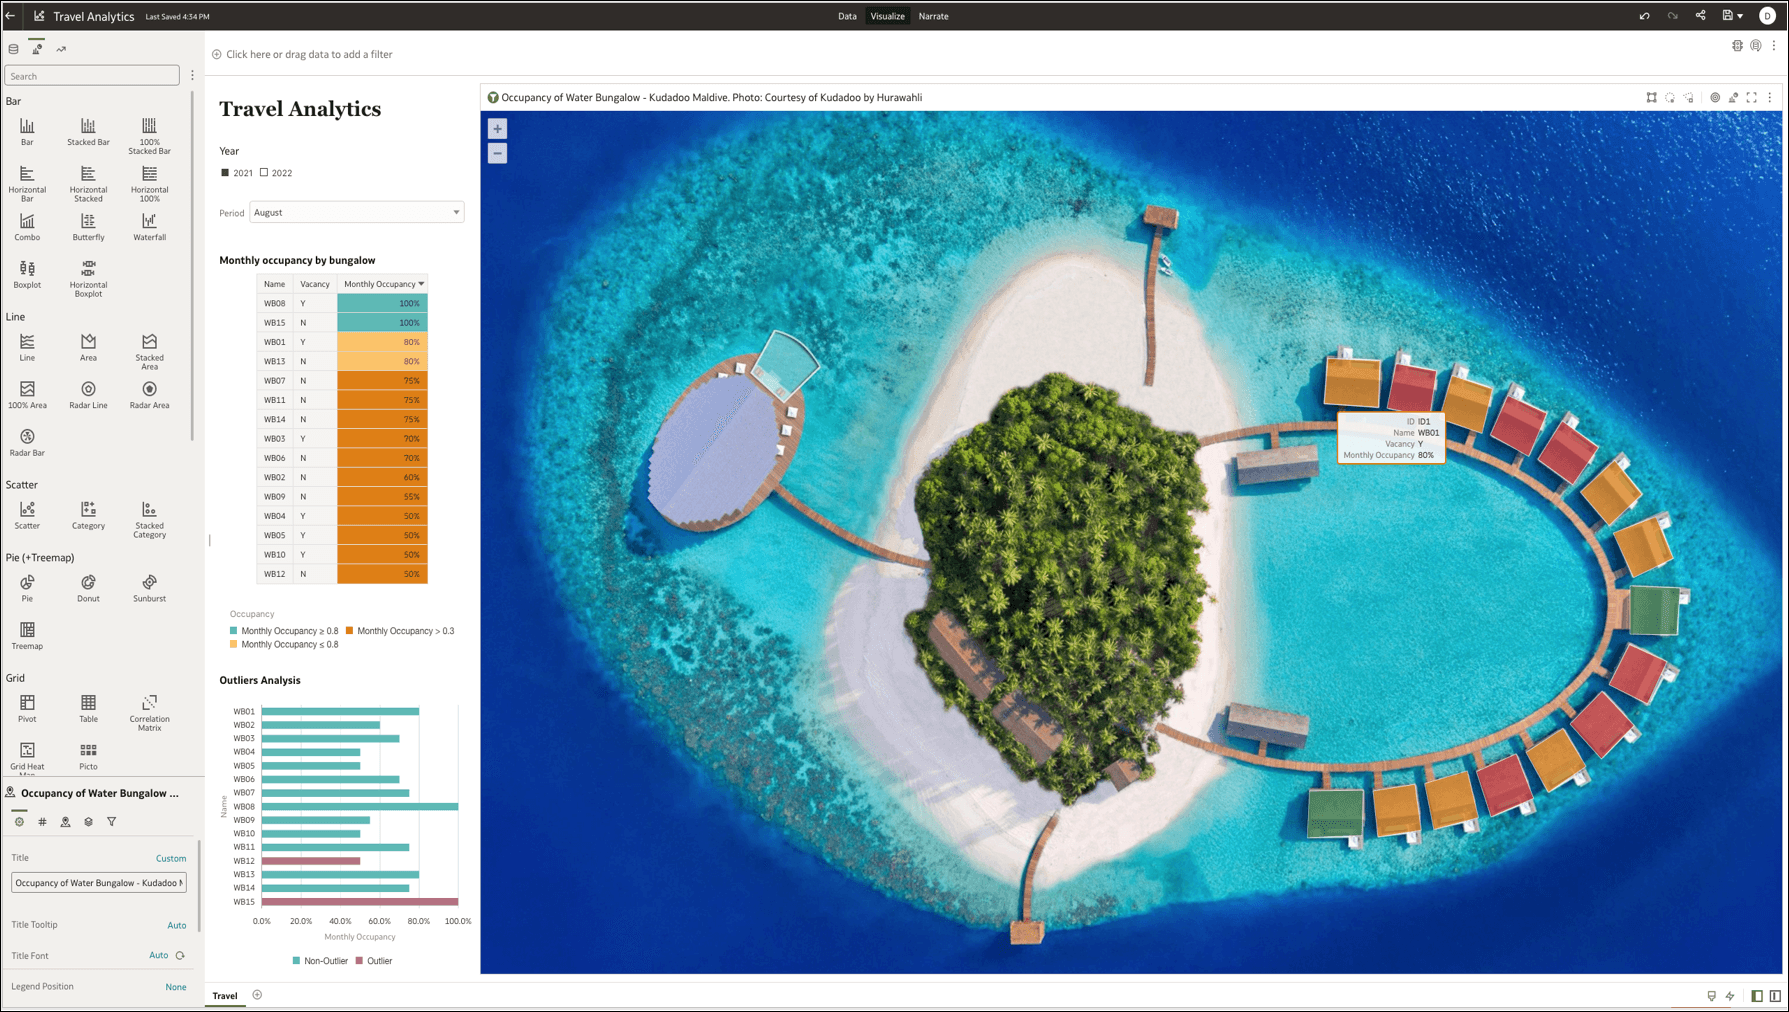
Visualizations
Visualizations enable you to dynamically explore multiple datasets in graphical way, all within a single interface. You can visualize data from many commonly used data sources. Workbooks enable you to organize and share your visualizations.

Description of the illustration visualizationexample71.png
Analyses
Analyses are a queries against your organization's data that provides you with answers to business questions. Analyses enable you to explore and interact with information visually in tables, graphs, pivot tables, and other data views. You can also save, organize, and share the results of analyses with others.

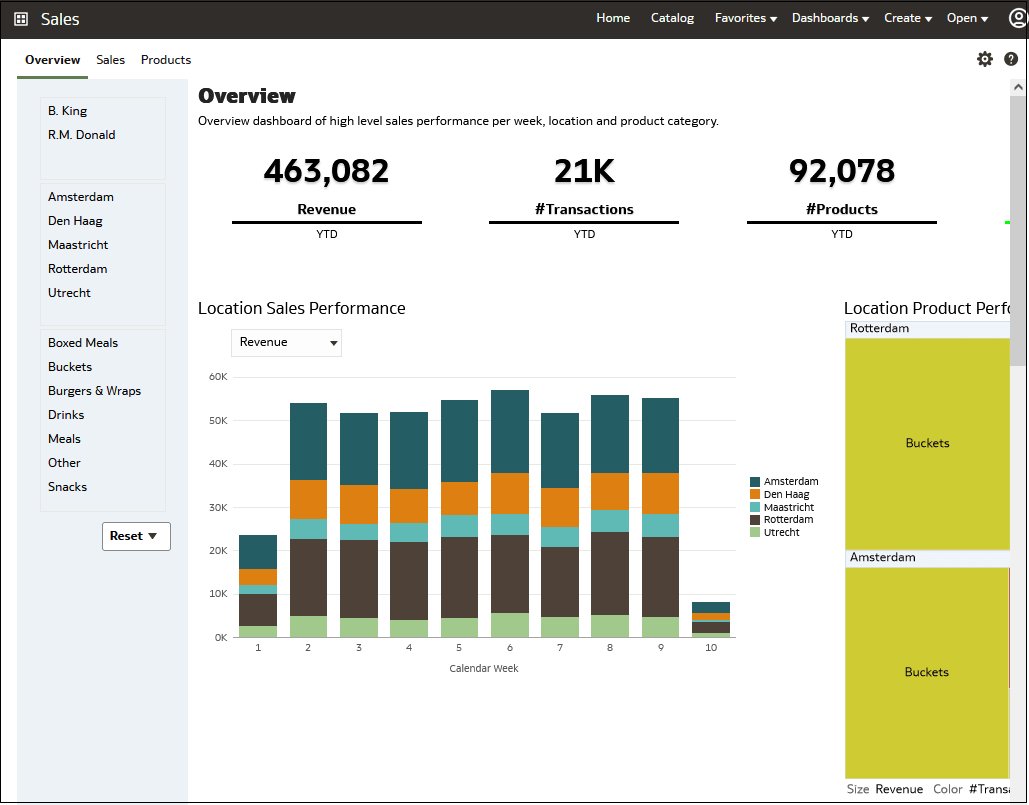
Description of the illustration sampledashboard71.png
Dashboards can include multiple analyses to give you a
complete and consistent view of your company’s information
across all departments and operational data sources. Dashboards
provide you with personalized views of information in the form
of one or more pages, with each page identified with a tab at
the top. Dashboard pages display anything that you have access
to or that you can open with a web browser including analyses
results, images, text, links to websites and documents, and
embedded content such as web pages or documents.
When you embed an analysis in a dashboard, the analysis automatically displays the most current data every time you access the dashboard. For example, if you need to see weekly sales performance over a range of products and locations you can run the dashboard to view the most up to date information.
Certification - Supported Browsers
Oracle Transactional Business Intelligence supports these web browsers:
See System Requirements for Oracle
Fusion Cloud Applications
https://www.oracle.com/system-requirements/.
- Apple Safari: Support for the most current major production release and one prior release.
- Google Chrome: Support for the most current major stable channel release only. Visit the Google Chrome FAQ for a description of the Chrome support policy: https://support.google.com/chrome/a/answer/188447?hl=en.
- Microsoft Edge: Support for the latest major version of Microsoft Edge Chromium. Beginning in Microsoft Edge v77, Microsoft has decoupled Edge from the Windows operating system and shifted to a Chromium-based browser technology and deployment model that follows a continuous 6-week update pattern, similar to Chrome and Firefox. Visit the Microsoft Edge FAQ for a description of the Edge support policy: https://docs.microsoft.com/en-au/deployedge/microsoft-edge-support-lifecycle.
- Mozilla Firefox: Support for the most current major Extended Support Release (ESR) version and above, in production only. Visit the Mozilla FAQ for a description of the Firefox support policy: https://www.mozilla.org/en-US/firefox/organizations/faq/.
- For mobile device operating systems, Oracle provides support for the most recent browser delivered by the device operating system only.