Adjusting Future Series with the Mouse

To adjust future series with the mouse:

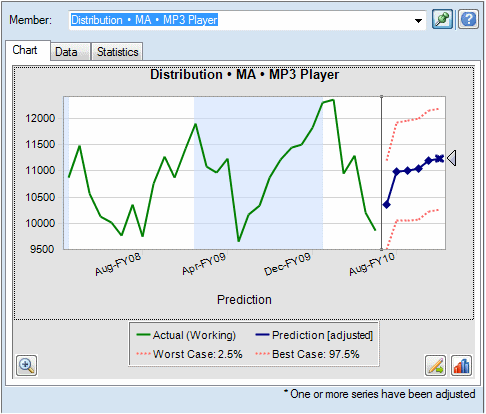
  1. Begin by clicking the future data series, either the main prediction line or one of the bounds, such as Worst Case and Best Case.

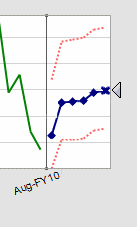
    This activates the chart grabber (Figure 2-4). An x is displayed for eachy data point and a triangle, the chart grabber, appears at the end of the line.

    By default, the data points are "unlocked" and can be adjusted evenly.

    Figure 2-4 Clicking the Prediction Line to Activate the Chart Grabber


    Clicking the predicted value chart line is the same as selecting that series in the Adjust Series dialog.
  2. Perform one of the following actions:
    • Move the chart grabber up or down to increase or decrease all values evenly with the first period value unlocked (Figure 2-5).

      Figure 2-5 Lowering the Chart Grabber Decreases All Values Equally


      Moving the chart grabber is the same as adjusting the values in the Adjust Series dialog.
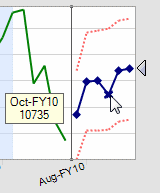
    • Click a predicted data point and move it to adjust only that value (Figure 2-6). A tooltip indicates which value is adjusted and how it is changing.

      Figure 2-6 Moving a Single Data Point


      Moving a single point is the same as typing a new value into the Planning form for the predicted data series.
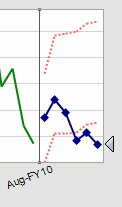
    • Right-click and select Lock First Period to keep the first predicted value constant. Move the chart grabber up or down to increase or decrease all values relative to the first value (Figure 2-7).

      Note:

      For more information about locking, see Using the Adjust Series Dialog.

      Figure 2-7 Moving the Chart Grabber with the First Predicted Value Locked


      With the first period locked, values adjust relative to each other.
  3. You can right-click and select Reset at any time to restore the original predicted values. Otherwise, the adjusted values replace the original values.

See Using the Adjust Series Dialog to perform the same actions using a dialog instead of manipulating the chart with the mouse. You can right-click and select Adjust Series to display the dialog from within a chart.