The Power of Dashboards
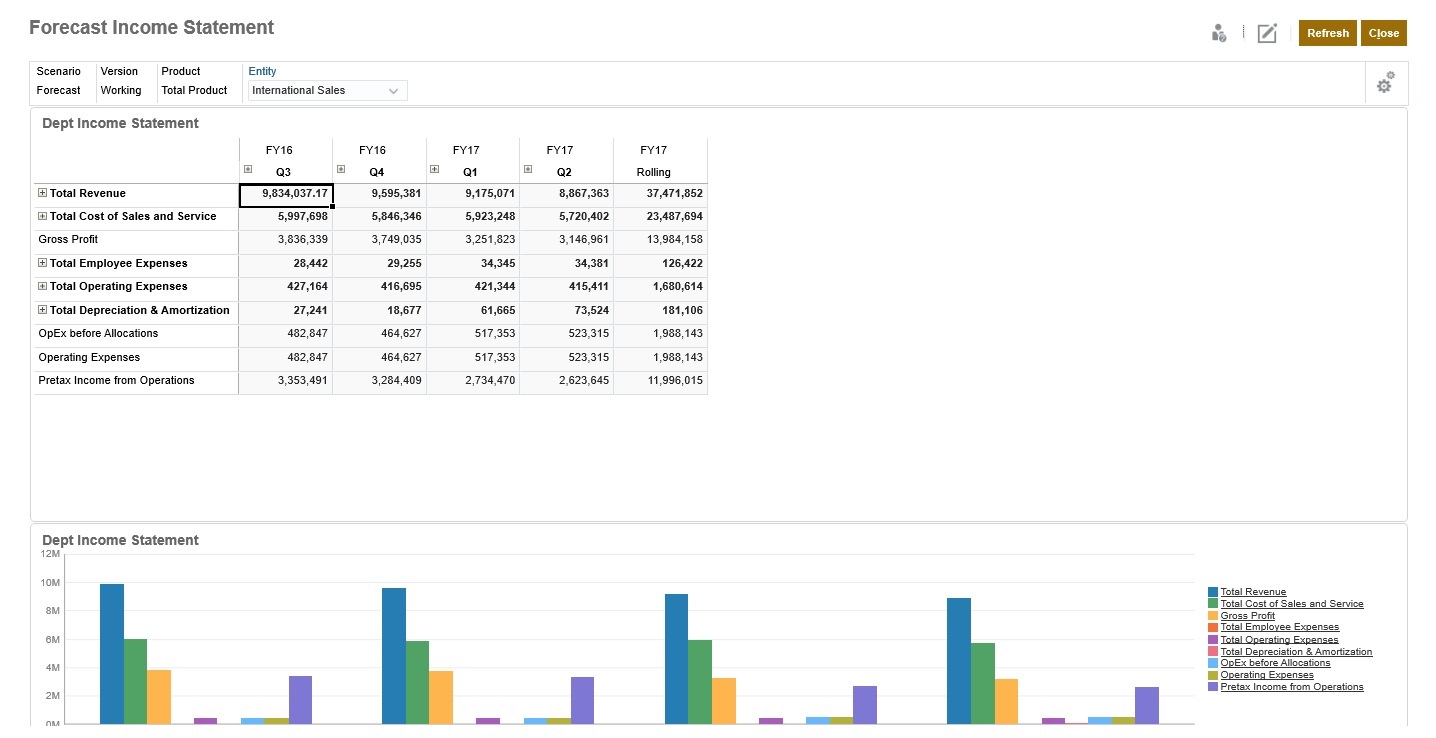
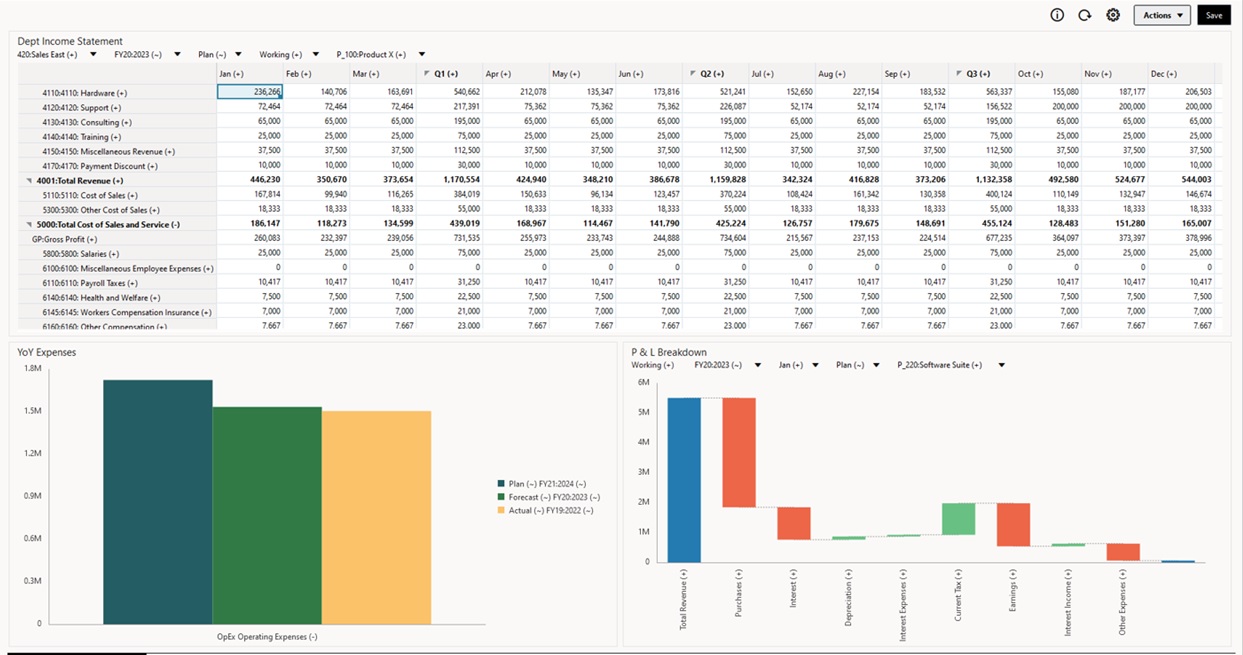
Dashboards typically provide an overview to users at the beginning of their planning and forecast process by showing summary data. The versatility of dashboards enables users to chart, evaluate, highlight, comment on, and even change key business data. They can change a driver in a form that's in a dashboard and immediately see its impact in other forms and charts:
Sample Dashboard 1.0

Sample Dashboard 2.0

You create dashboards by simply dragging and dropping a variety of objects from the library panel on the left to the dashboard workspace.
With dashboards, you can:
- Include multiple forms that dynamically update, including their associated charts, as users change data in the form.
- Include tiles that display a specific value from the cube. To provide the value for each tile, you can specify a form or a cell intersection as a data source.
- Switch easily between using the design environment and the runtime environment, so you can see exactly what the dashboard user will see.
- Depict data interactively with a wide variety of chart types such as area, bar, bubble, column, combination bar and line, doughnut, funnel, gauge, scatter, radar, and so on.
- Control the dashboard’s layout.
- Depending on the form design, enable users to drill down into underlying detail and select which members to work with.
- Include user variables in the global POV bar and the local POV.
- In certain charts, customize the colors and line width, and show or hide gridlines.
- Add links to dynamically display external Web pages.
- Include explanations of data called Commentary in the dashboard.
- Tag a form as master and then filter members from the master form to detail forms or charts within the same dashboard.
- Change legend and label positions in charts.
- In Dashboard 2.0:
- Add up to 12 components within a dashboard
- Add up to 10 tiles in a tile chart type
- Add hierarchical labels in charts
- Use a logarithmic scale in relevant chart types
- Add a secondary Y-axis in relevant chart types
- Render the dashboard in Default, Light, and Dark background colors using the Style property
- Use grid display with write-enabled grids (used with Forms 2.0)
- Enjoy other usability improvements such as more screen space, options to open and edit a form directly, option to edit a dashboard without data, automatically apply POV changes, and hide dimension names
- Improved Rules on Save with dashboards: with/without runtime prompts before/after Load/Save
- Migrate easily from Dashboard 1.0
Note:
Dashboard 1.0 dashboards are deployed with Forms 1.0, even when the Forms Version setting is Forms 2.0.
When users use a dashboard (referred to as runtime), they can set many aspects of the components, such as the type of chart displayed, the dashboard’s title, and so on. A toolbar is available for each component. Dashboard users can change and save data, run rules, and so on. However, changes made in runtime to the chart type options aren't saved for the next session. Clicking Save in runtime saves the data, but not the dashboard definition.
Service Administrators create, redesign, delete, and assign permissions to dashboards and dashboard folders.
Videos
| Your Goal | Watch This Video |
|---|---|
| Learn how to create 1.0 dashboards. | |
| Learn how to create Dashboard 2.0 dashboards. |