Introduction
This 30-minute hands-on tutorial reviews best practice planning in Financials using your own chart of accounts. After loading your own chart of accounts, you can leverage out-of-the-box features and incrementally add more features to your application. The sections build on each other and should be completed sequentially.
Background
While a complete chart of accounts is included to get you up and running quickly, Financials also gives you the flexibility to use your own chart of accounts and still retain the benefits of the integrated Financials framework.
Financials delivers tools to help you quickly develop plans and forecasts, and generate core financial statements such as balance sheets, cash flow statements, and income statements for internal analysis. Financials provides these components that you can enable incrementally to best meet your business needs:
- Revenue / Gross Margin
- Expense
- Balance Sheet
- Cash Flow
- Income Statement
- Analysis
Here are a few considerations when incrementally enabling features in Financials:
- If you are planning at the weekly level with a 12-month calendar, you can incrementally enable an option to support a 53-week calendar. Options you specify when enabling 53 weeks determine in which month and year the 53rd week falls. Usually the 53rd week occurs every fourth or fifth calendar year. You can’t disable this feature once it’s enabled.
- You can enable custom dimensions only on the first time you enable Financials.
- You can incrementally associate custom dimensions with additional features after you first enable Financials.
- If you incrementally enable additional features, any new forms or other artifacts are added to the original and the copy of the navigation flows.
Prerequisites
Cloud EPM Hands-on Tutorials may require you to import a snapshot into your Cloud EPM Enterprise Service instance. Before you can import a tutorial snapshot, you must request another Cloud EPM Enterprise Service instance or remove your current application and business process. The tutorial snapshot will not import over your existing application or business process, nor will it automatically replace or restore the application or business process you are currently working with.
Before starting this tutorial, you must:
- Have Service Administrator access to a Cloud EPM Enterprise Service instance.
- Upload and import this snapshot into your Planning instance. Alternatively, you can complete the steps in the Configuring Financials to Bring In Your Chart of Accounts hands-on tutorial, and use that as your starting point for this tutorial.
- Save this data file locally and extract the ExportedData_Account.csv load file. You will be importing data using this load file.
Note:
If you run into migration errors importing the snapshot, re-run the migration excluding the HSS-Shared Services component, as well as the Security and User Preferences artifacts in the Core component. For more information on uploading and importing snapshots, refer to the Administering Migration for Oracle Enterprise Performance Management Cloud documentation.Reviewing the business process configuration
Reviewing the previously added chart of accounts
Review the previously added members for the chart of accounts. These accounts were not included during Financials configuration.
Note:
To learn more about loading your own chart of accounts, step-through the Configuring Financials to bring in your own Chart of Accounts hands-on tutorial.- On the Planning home page, click Application, then Overview.
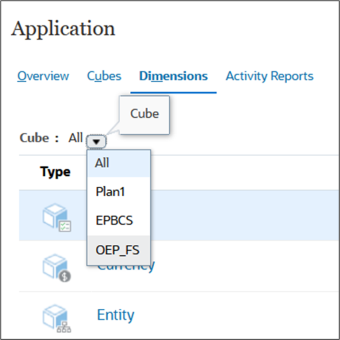
- Click Dimensions.
- From the Cube dropdown list, select OEP_FS.
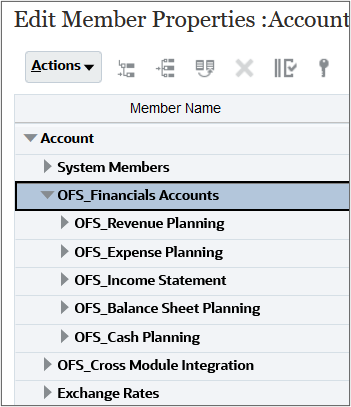
- Click Account.
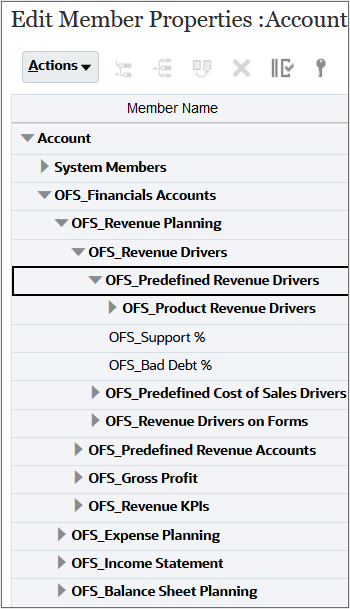
- Expand OFS_Financials Accounts.
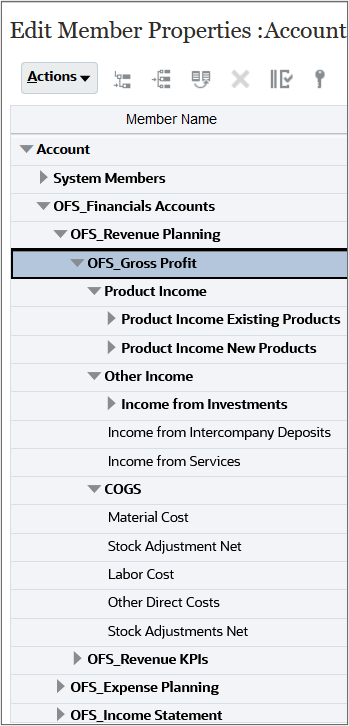
- Expand OFS_Revenue Planning, and then OFS_Gross Profit.
- Expand the members under OFS_Revenue Planning to display the custom chart of account members.
- When finished, collapse the hierarchy until only the parent key members are visible under OFS_Financial Accounts.
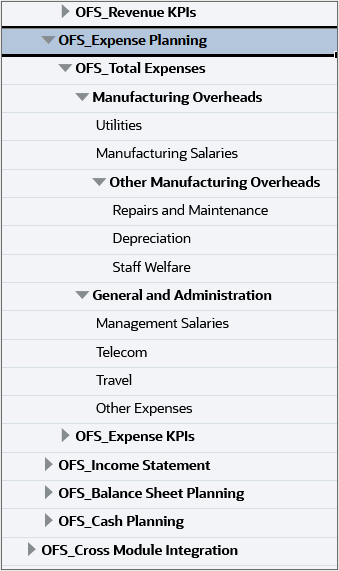
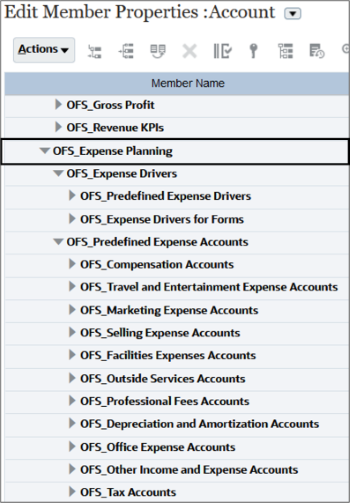
- Expand OFS_Expense Planning, and then OFS_Total Expenses.
- Expand the members under OFS_Total Expenses to display the custom chart of account members.
- When finished, collapse the metadata hierarchy.
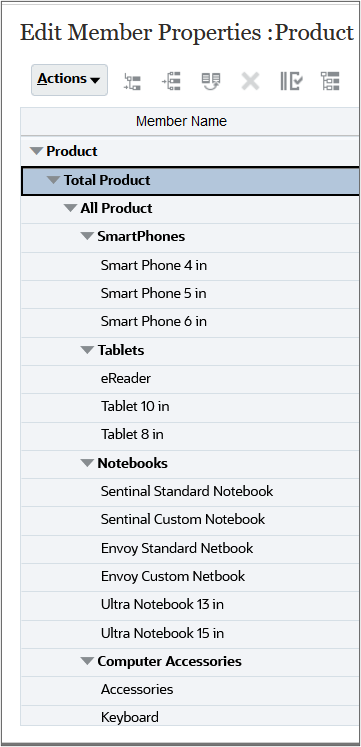
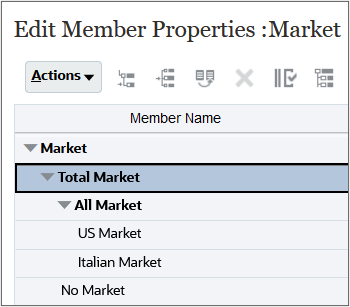
- Switch dimensions. In Edit Member Properties, click the arrow next to the dimension name and select a dimension: Entity, Product, Market.
- Entity: Expand OEP_Total Entity, and member levels below it to view entities.
- Product: Expand Total Product, and member levels below it to view products.
- Market: Expand Total Market and member levels below it to view markets.
Here are the parent key members enabled in Financials:
Adding shared members
Some of the included charts and dashboards depict results from key members. Include accounts by adding them as shared members under the appropriate parent. The share can be at the level of detail required for your business.
- In Edit Member Properties, click the arrow next to the dimension name and select Account.
- Expand OFS_Financials Accounts, then OFS_Income Statement.
- Under OFS_Income Statement, select OFS_Net Income.
- Click
 (Add Child).
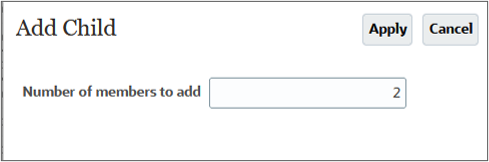
 - In the Add Child dialog box, enter 2 and click Apply.
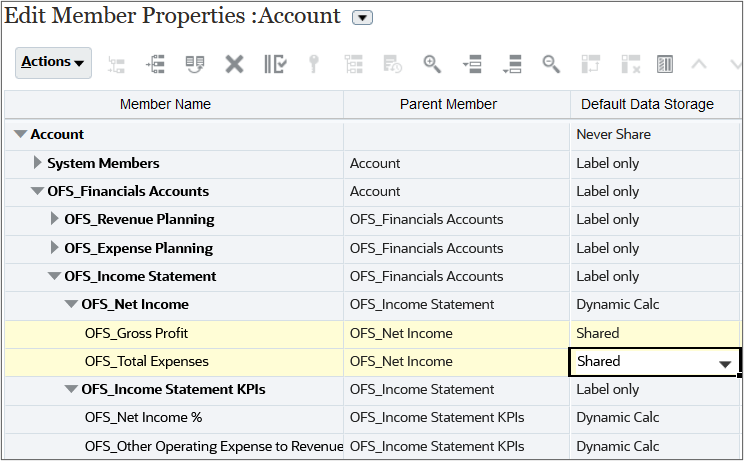
- Edit the Member Name for the cells added under OFS_Net Income to:
- OFS_Gross Profit
- OFS_Total Expenses
- For both members, set the Default Data Storage to Shared.
- Click Save.
- Click
 (Refresh Database).
 - In the Refresh Database dialog box, accept the default selections, and click Refresh Database.
- In the Refresh Database prompt, click Refresh.
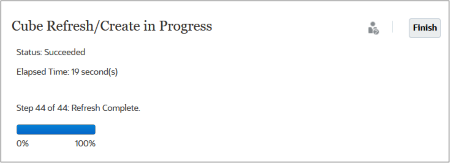
- When the status displays as Succeeded and the percent complete is 100%, click Finish.
- Click Close.
- Click Cancel.
Yellow colored rows were added under OFS_Net Income.
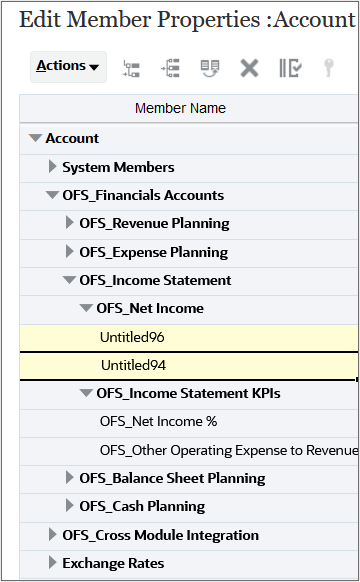
The members are temporarily added to the hierarchy. To commit changes, you must refresh the database.
Tip:
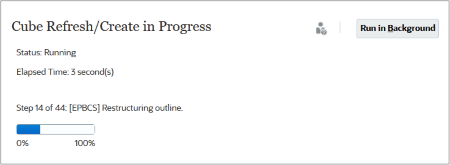
It is recommended that Enable Use of the Application is set to Administrators, before and after refreshing the database, until Financials is completely configured and ready for production.The Cube Refresh/Create in Progress status is displayed.
Reviewing the enabled Financials features
Navigating to the Planning home page
From the upper right portion of the page, click ![]() (Home).
(Home).
Navigating to the Configure page
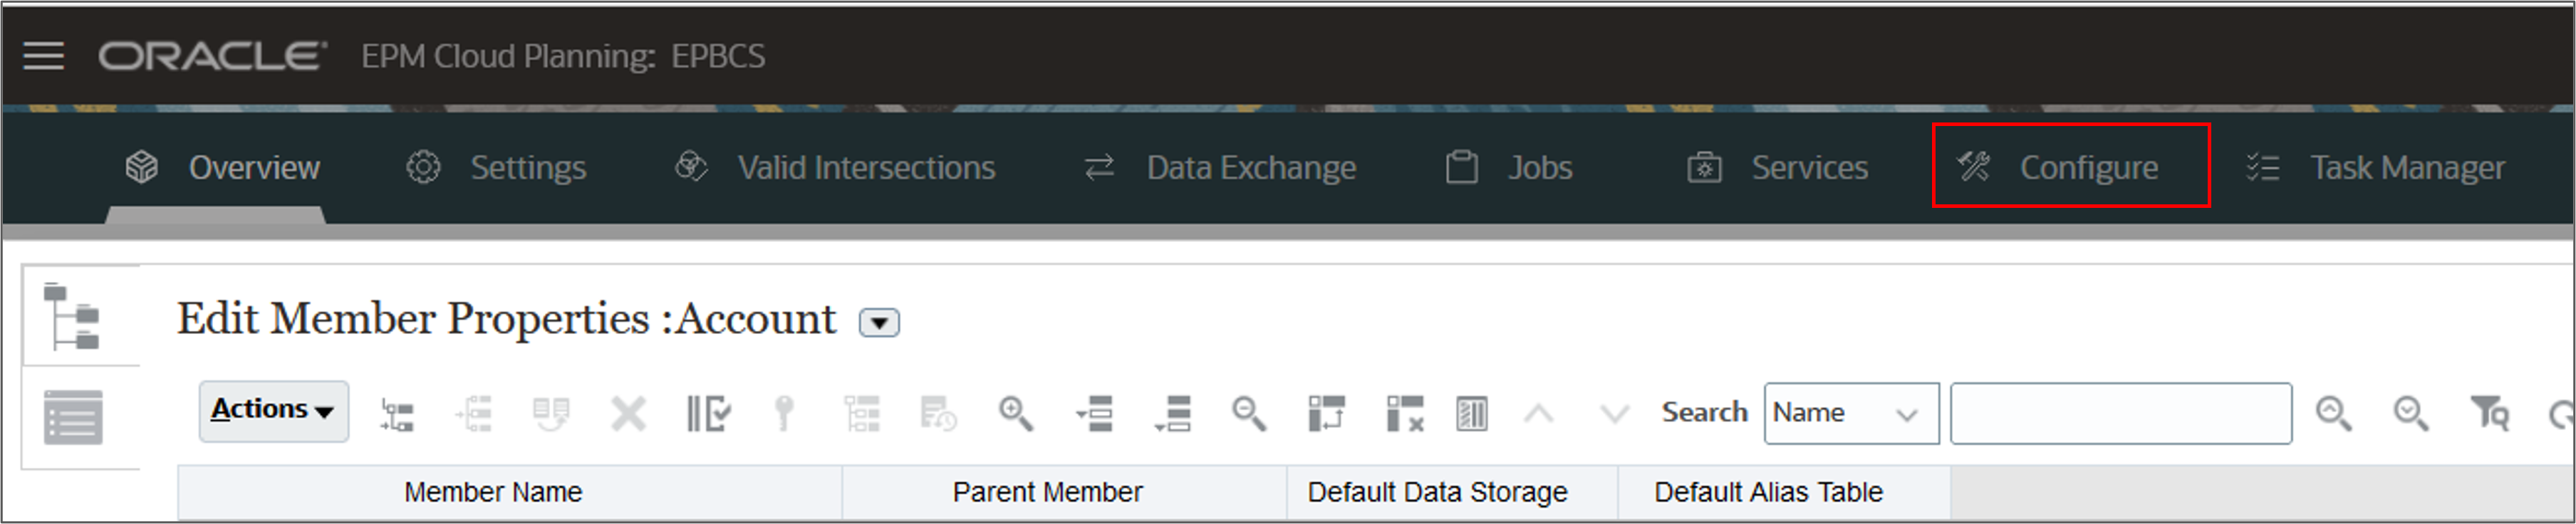
From the Planning home page, click Application, then Configure.
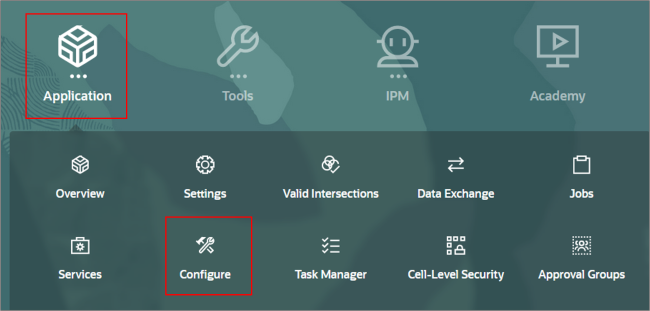
If you have another card open in the Application cluster, click Configure from the cards on the top of the page.
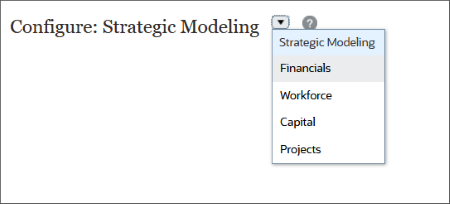
- From the Configure dropdown list, select Financials.
- Click Enable Features.
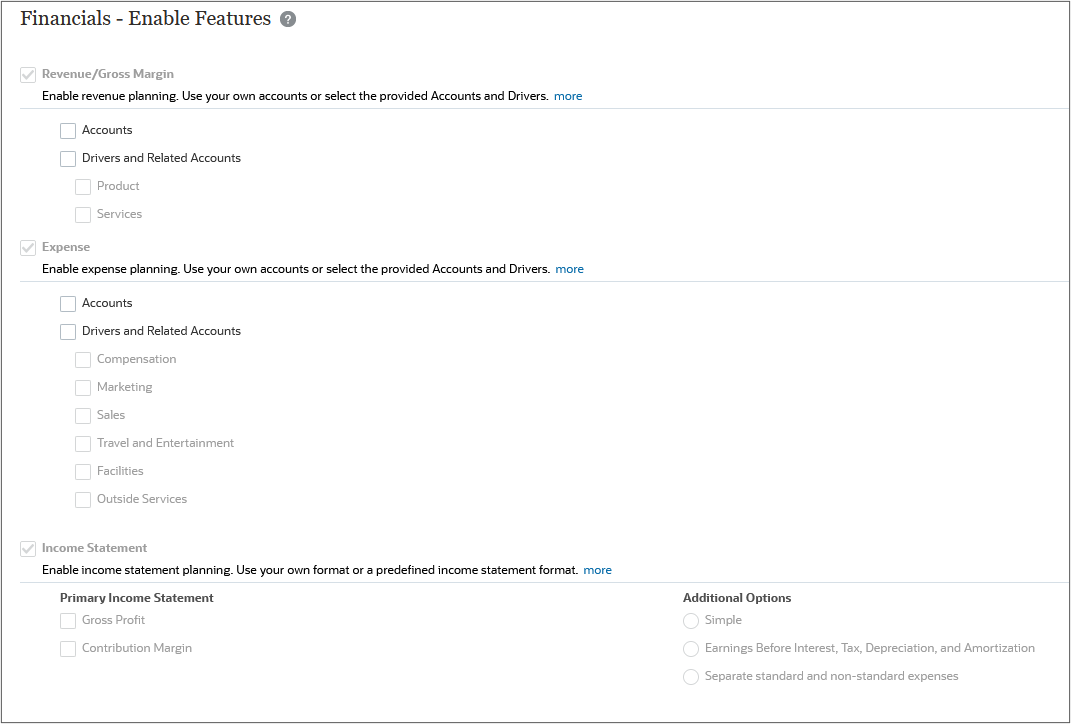
- Verify that the following key account members are enabled:
- Revenue/Gross Margin
- Expense
- Income Statement
- Balance Sheet
- Cash Flow Statement
Tip:
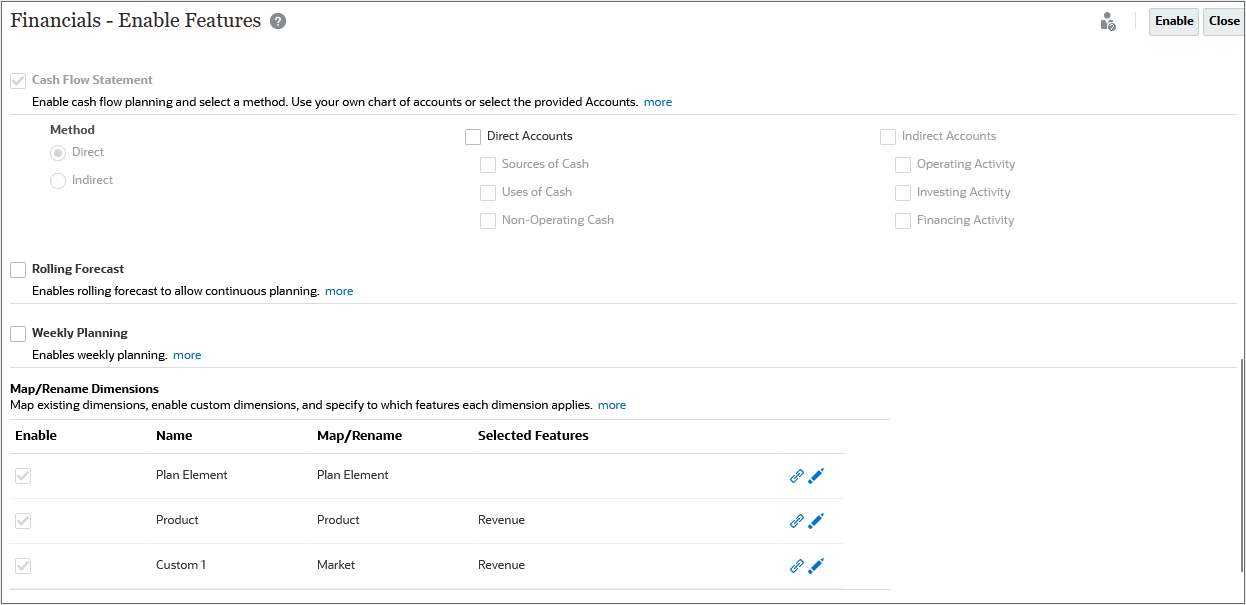
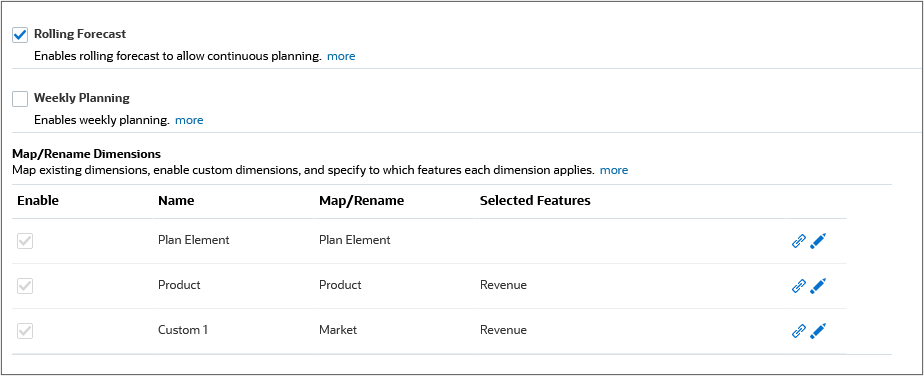
You may need to scroll down the page to display more options. - Scroll down to the Map/Rename Dimensions section.
- Verify that the following custom dimensions are listed and mapped:
The Financials - Enable Features dialog box is displayed.
Incrementally enabling Financials features
Financials allows you to incrementally enable features, depending on your company’s needs.
Enabling additional Financials features
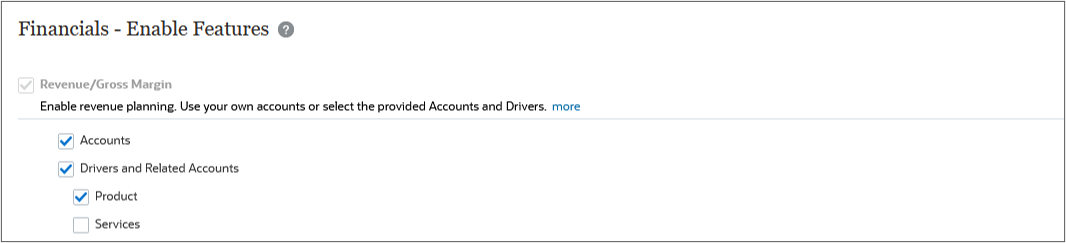
- In Enable Features, beginning at the top of the page, select the following features:
- Revenue/Gross Margin
- Accounts
- Drivers and Related Accounts
- Product
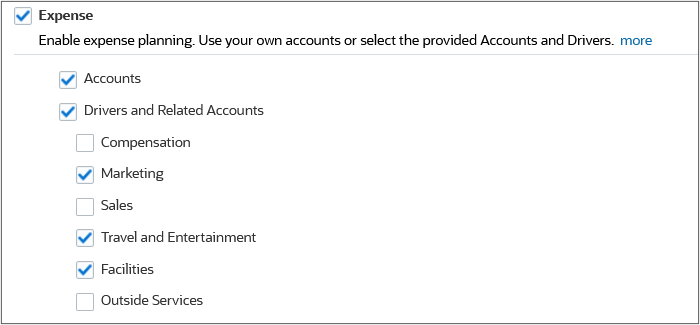
- Expense
- Accounts
- Drivers and Related Accounts
- Marketing
- Travel & Entertainment
- Facilities
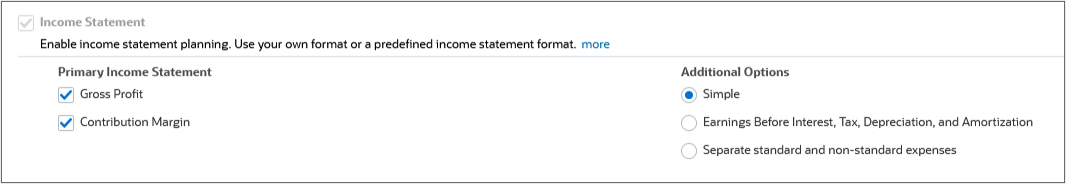
- Income Statement
- Gross Profit
- Simple
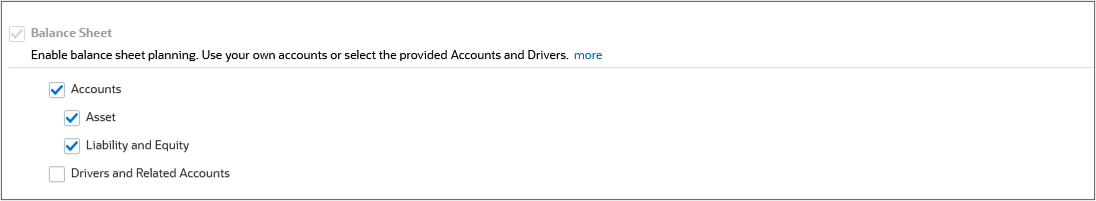
- Balance Sheet
- Asset
- Liability & Equity
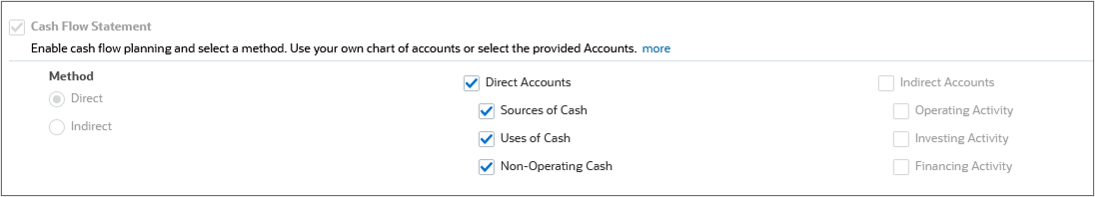
- Cash Flow Statement
- Direct Accounts
- Sources of Cash
- Uses of Cash
- Non-Operating Cash
- Aside from accounts and drivers, enable Rolling Forecast.
- Review your selections, then click Enable.
- When prompted to confirm that you want to continue, click Yes.
- When the enable process completes, a message box to confirm is displayed. Click OK.
- Sign out and log back in to Planning.
Additional Options:
Accounts
A status box is displayed.

Reviewing enabled account drivers
Predefined drivers and the chart of accounts you bring in can co-exist within the Account dimension member hierarchy.
- On the Planning home page, click Application, then Overview.
- Click Dimensions.
- From the Cube dropdown list, select OEP_FS.
- Click Account.
- Expand OFS_Financials Accounts.
- Display Revenue accounts, drivers, and KPIs. Expand OFS_Revenue Planning, and its descendants.
- When finished, collapse the hierarchy until only the parent key members are visible under OFS_Financial Accounts.
- Display Expense accounts, drivers, and KPIs. Expand OFS_Expense Planning, and its descendants.
- When finished, collapse the metadata hierarchy.
- Expand OFS_Income Statement, OFS_Balance Sheet Planning, OFS_Cash Planning and their descendants to review account members and KPIs.
- When finished, click Cancel to close Edit Member Properties.
For each parent key member, expand the member hierarchy to view the added drivers and KPIs.
Performing post-configuration tasks
Setting Period and Scenario combinations
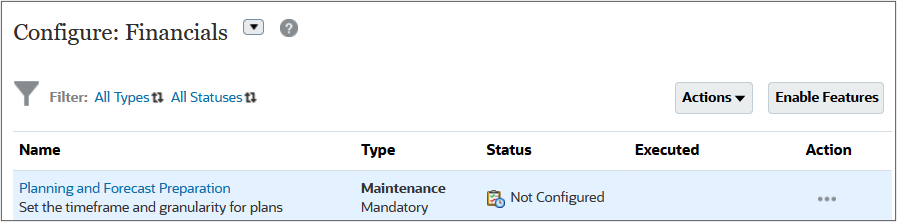
- Navigate to the Configure page for Financials.
- Click Planning and Forecast Preparation.
- In the Planning and Forecast Preparation dialog box, for Plan, make the following selections:
- Current Fiscal Year: FY23
- Period: Jun
- Plan Start Year: Next Fiscal Year
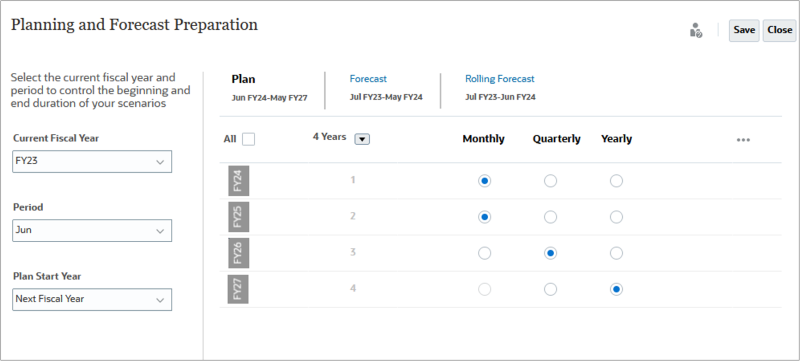
- Review the selections and accept the defaults for Forecast and Rolling Forecast.
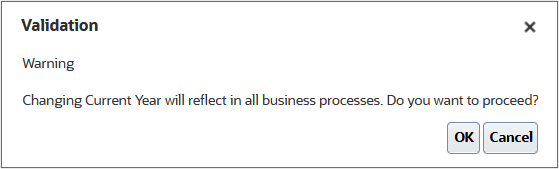
- Click Save.
- If prompted that changing the current year will reflect in all business processes, click OK.
- Click Close.
- Go to the Planning home page.
Setting User Variables
Before you can open dashboards and forms, you must set values for user variables.
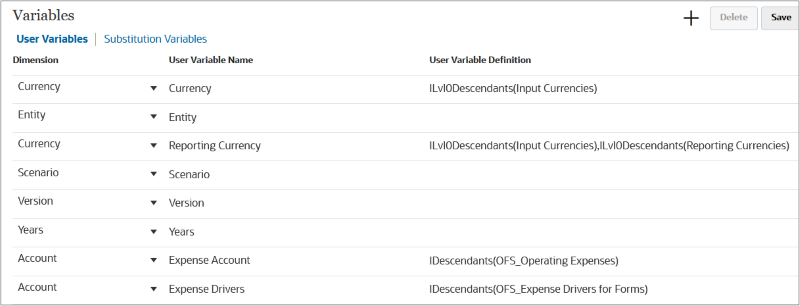
- On the Planning home page, click Tools, then Variables.
- Change the value for Expense Account to iDescendants(OFS_Financials Accounts).
- Click Save.
- When prompted that the record(s) saved successfully, click OK.
- From the cards on the top of the page, click User Preferences.
- In the left pane, click User Variables and enter the following members for the user variables:
- Currency: USD
- Entity: Sales US
- Reporting Currency: USD
- Scenario: OEP_Plan
- Version: OEP_Working
- Years: FY24
- Expense Account: OFS_Total Expenses
- Expense Drivers: OFS_Expense Drivers for Forms
- Click Save.
- When prompted, click OK.
- Go to the Planning home page.
User Variables were added when the business process was created. User variables act as filters in forms, enabling planners to focus only on certain members. This is where you create additional User Variables for your business process.
Planners must first select values in preferences for the variable before opening forms and dashboards.

Tip:
You can use Member Selector to select members.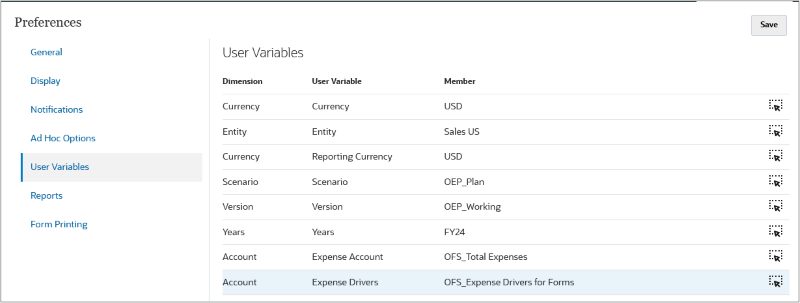
Importing data into Financials
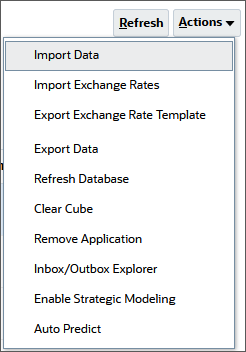
- From the Planning home page, click Application, then Overview.
- On the Application page, click Actions and select Import Data.
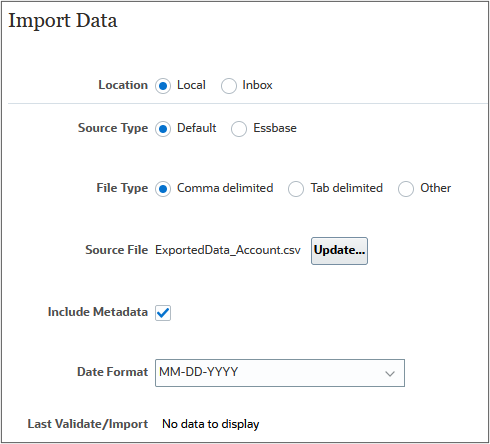
- On the Import Data dialog box, click Create.
- Accept the default selection, Local, as the Location.
- Accept the default selection, Default, as the Source Type.
- Accept the default selection, Comma delimited, as the File Type.
- For Source File, click Browse File.
- Navigate to the location of the ExportedData_Account.csv import file, select it, and click Open.
- Select Include Metadata.
- For Date Format, accept the default selection: MM-DD-YYYY.
- Review your selections.
- Click Import.
- On the Information dialog box that confirms that the import data job was submitted successfully, click OK.
- Click Close twice to close the Import Data dialog boxes.
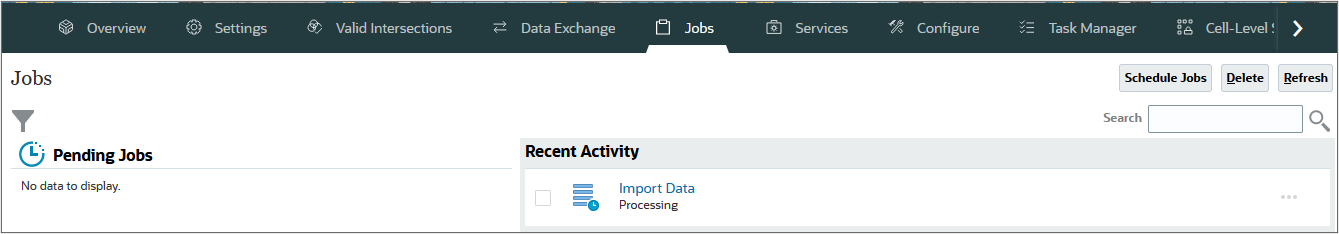
- From the cards displayed on top of the page, click Jobs and then locate the Import Data job.
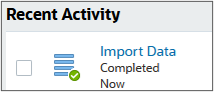
- Click Refresh until the status displays as Completed.
- Go to the Planning home page.
Building revenue and expense plans
You can plan using several different methods:
- Driver-based—Enter global rate assumptions and other assumptions (for example revenue drivers or expense drivers) to take advantage of built-in accounts and calculations to drive the planning process.
- Trend-based—For Financials only, enter trend-based assumptions that let you plan and forecast based on trends. For example, you can plan by using current, projected, or past values (such as Forecast Average or Year Over Year Increase) and estimate the percent by which each value is likely to change.
- Direct Entry—Directly enter data, for example if your planning and forecasting does not have historic trends or specific business drivers. When you use this planning method, no built-in logic is used.
Navigating the Financials card
On the Planning home page, click Financials.
Keep in mind that by default, the cards in the Financials cluster depend on what features you enabled. You can customize the display of clusters and cards using navigation flows.
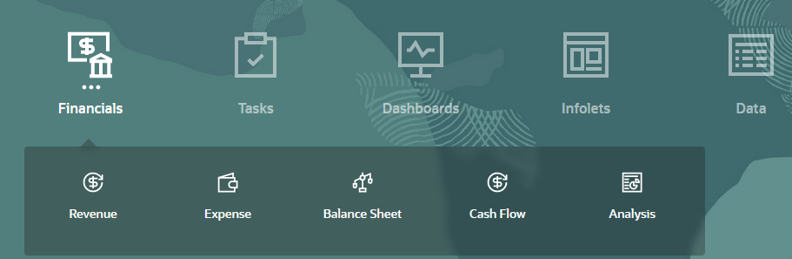
In this section of the tutorial, we will quickly go through the Revenue and Expense components.
Note:
Learn more about Financial Planning by stepping-through the EPM hands-on tutorials.Navigating between Revenue and Expense planning
- From the Financials cluster, click Revenue or Expense.
- Navigate between options using horizontal and vertical tabs.


Horizontal tabs vary depending on the vertical tab displayed.
The vertical tabs, found on the left side of the page, take you to the following options:
Vertical Tab Name Description 
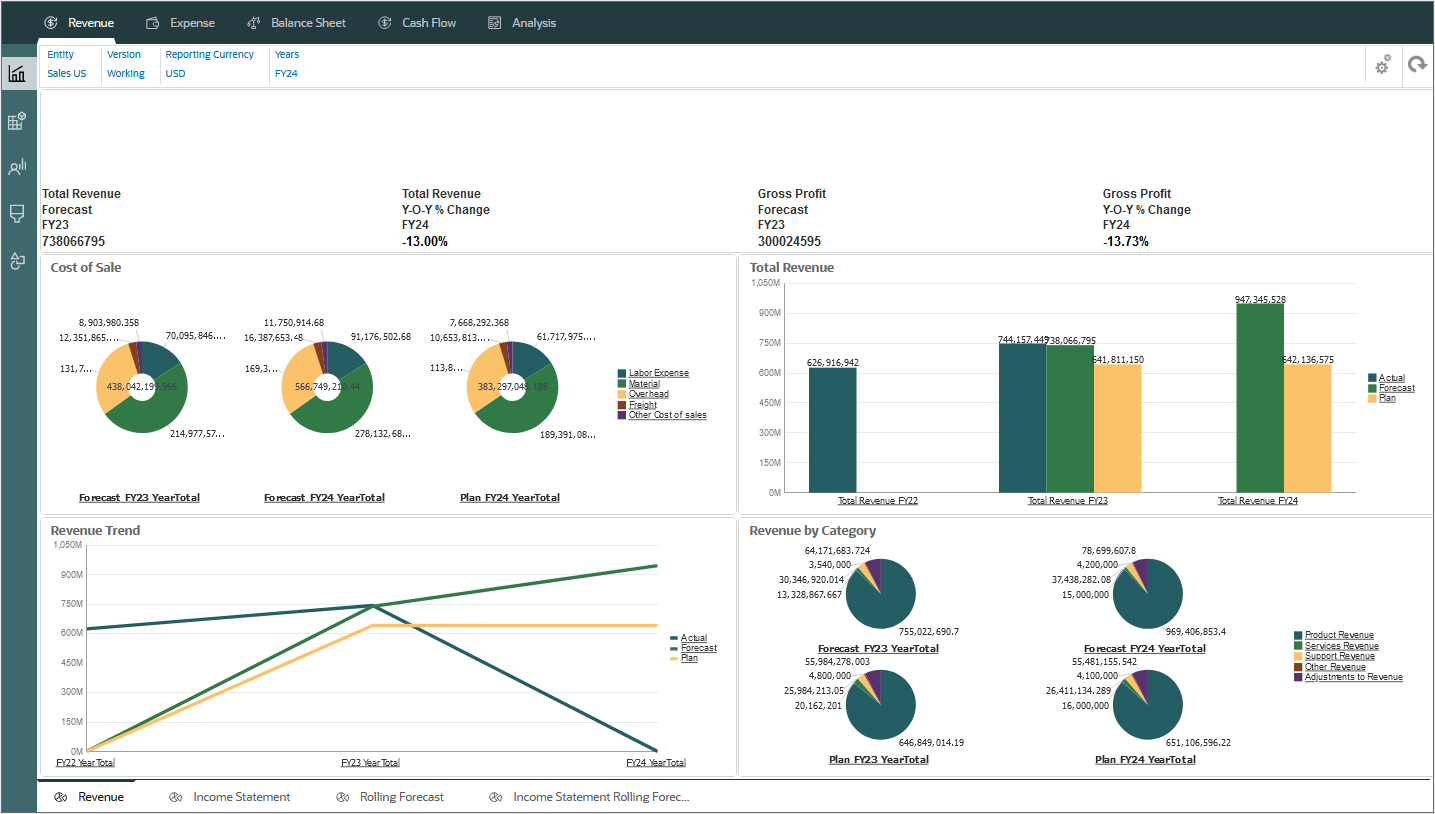
Overview Review an overview of your financials in a dashboard format. 
Driver and Trend Based Enter values for the drivers, view actual account values calculated by drivers, override values if needed, evaluate planned or forecast values and historic actuals using driver trends, plan, without any internal driver-based based logic, at the individual account level by manually entering and adjusting expenses. 
Rolling Forecast Plan revenue and expenses using a rolling forecast. Use these forms instead of, or in addition to, the forms on the Driver and Trend Based tab. 
Direct Entry Enter and adjust account values that are not driver-derived, and manually enter rolling forecast values. 
Income Statement View Income Statement data. - Verify that the data point-of-view (POV) is set to the following:
- Entity: Sales US
- Version: Working (OEP_Working)
- Reporting Currency: USD
- Years: FY24
The Revenue Overview dashboard or Expense Overview dashboard is displayed.

Specifying drivers and trends
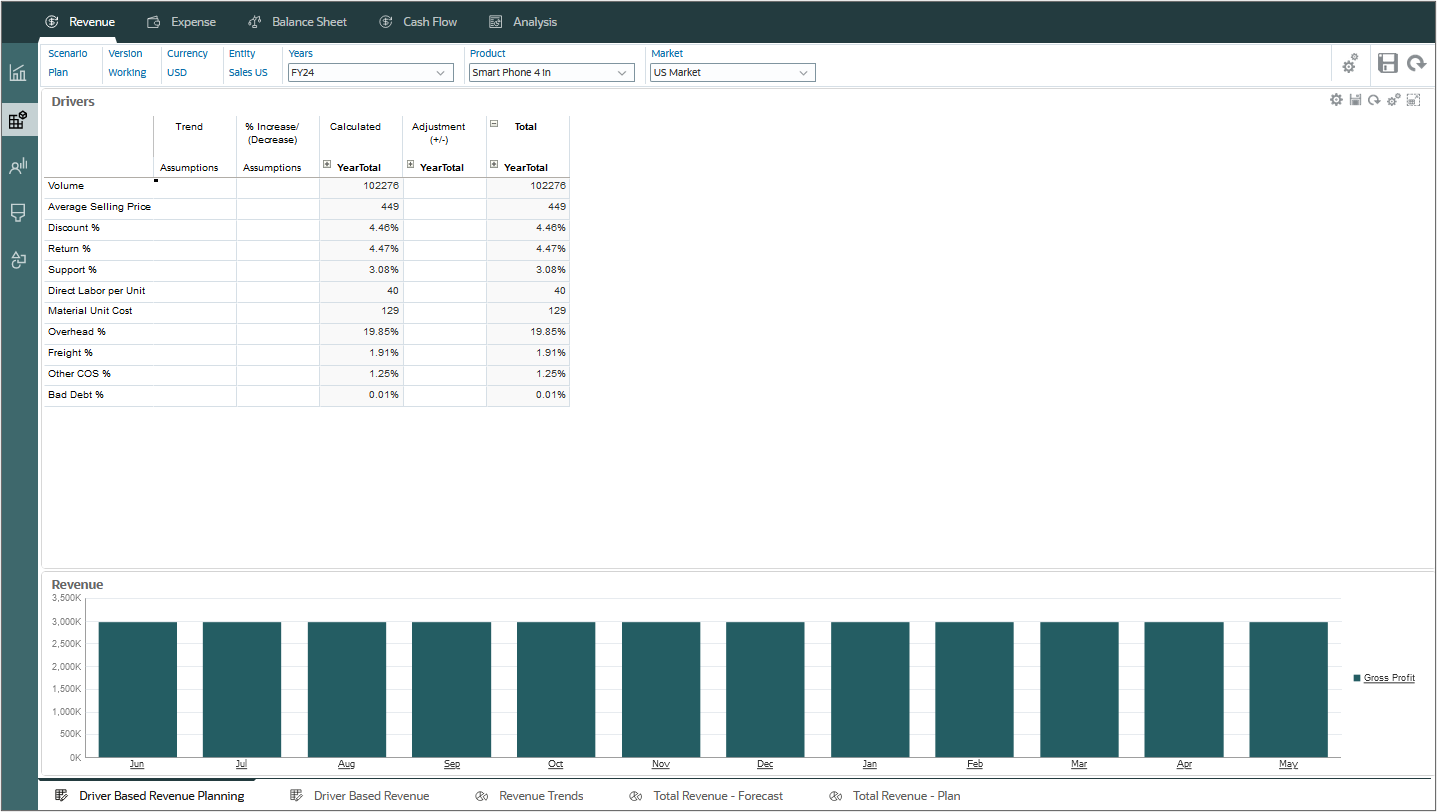
- For standard forecasting, click the Driver and Trend Based vertical tab and then:
- For Revenue, click the Driver Based Revenue Planning horizontal tab.
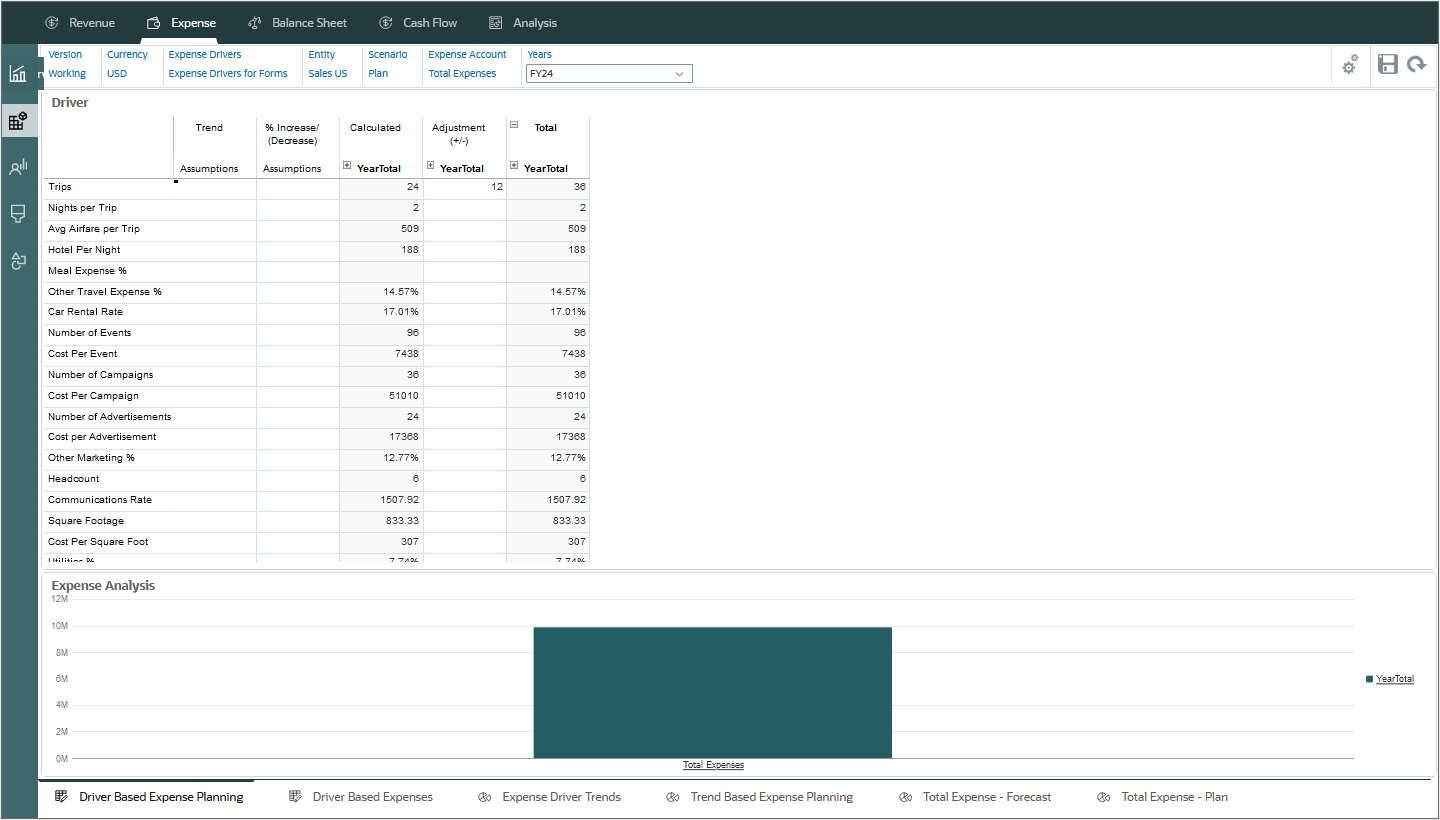
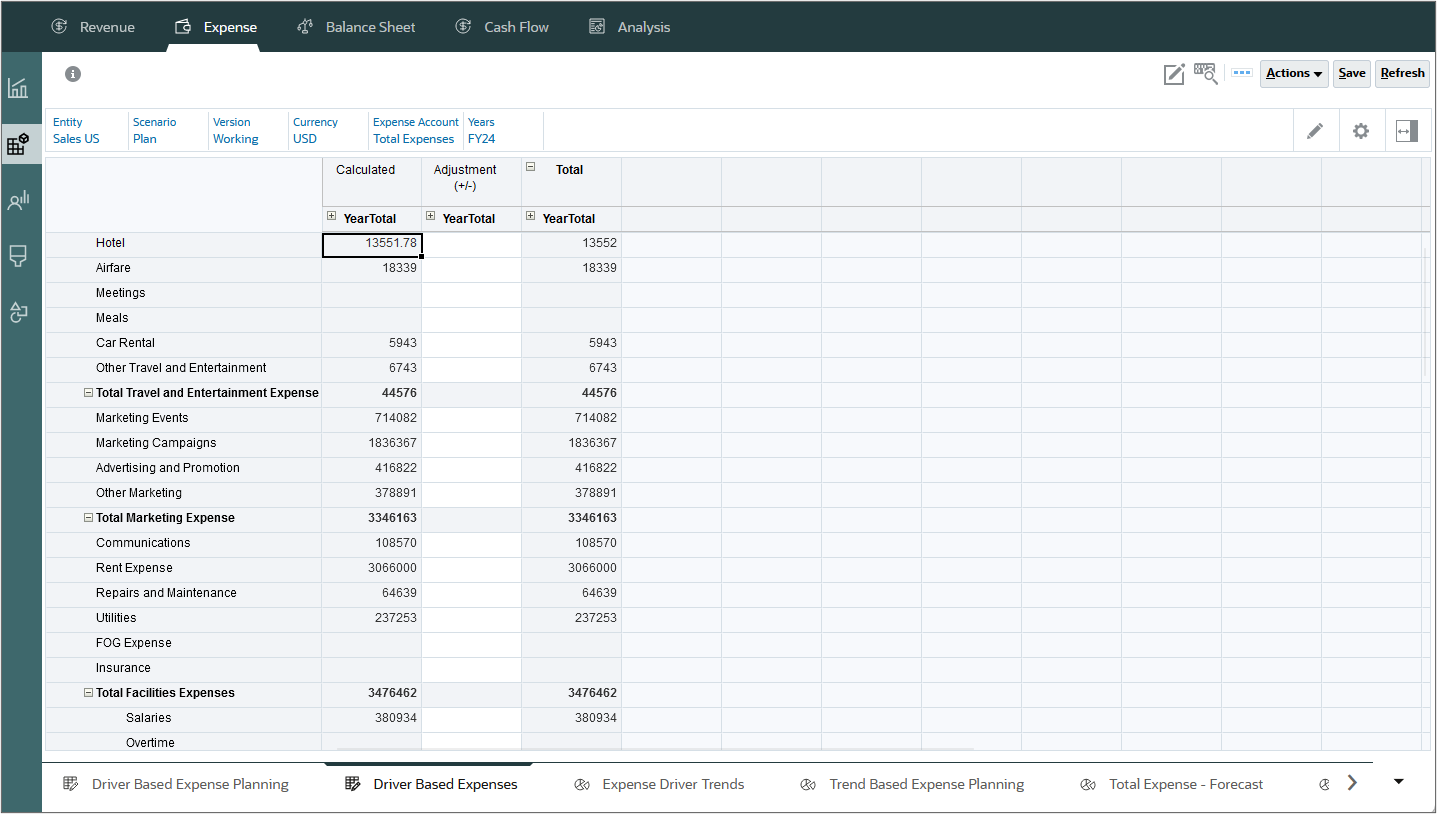
- For Expenses, click the Driver Based Expense Planning horizontal tab.
Tip:
If there is no data displayed, set POV members to match the examples.Enter assumptions and adjustments on these tabs.
- For Revenue, click the Driver Based Revenue Planning horizontal tab.
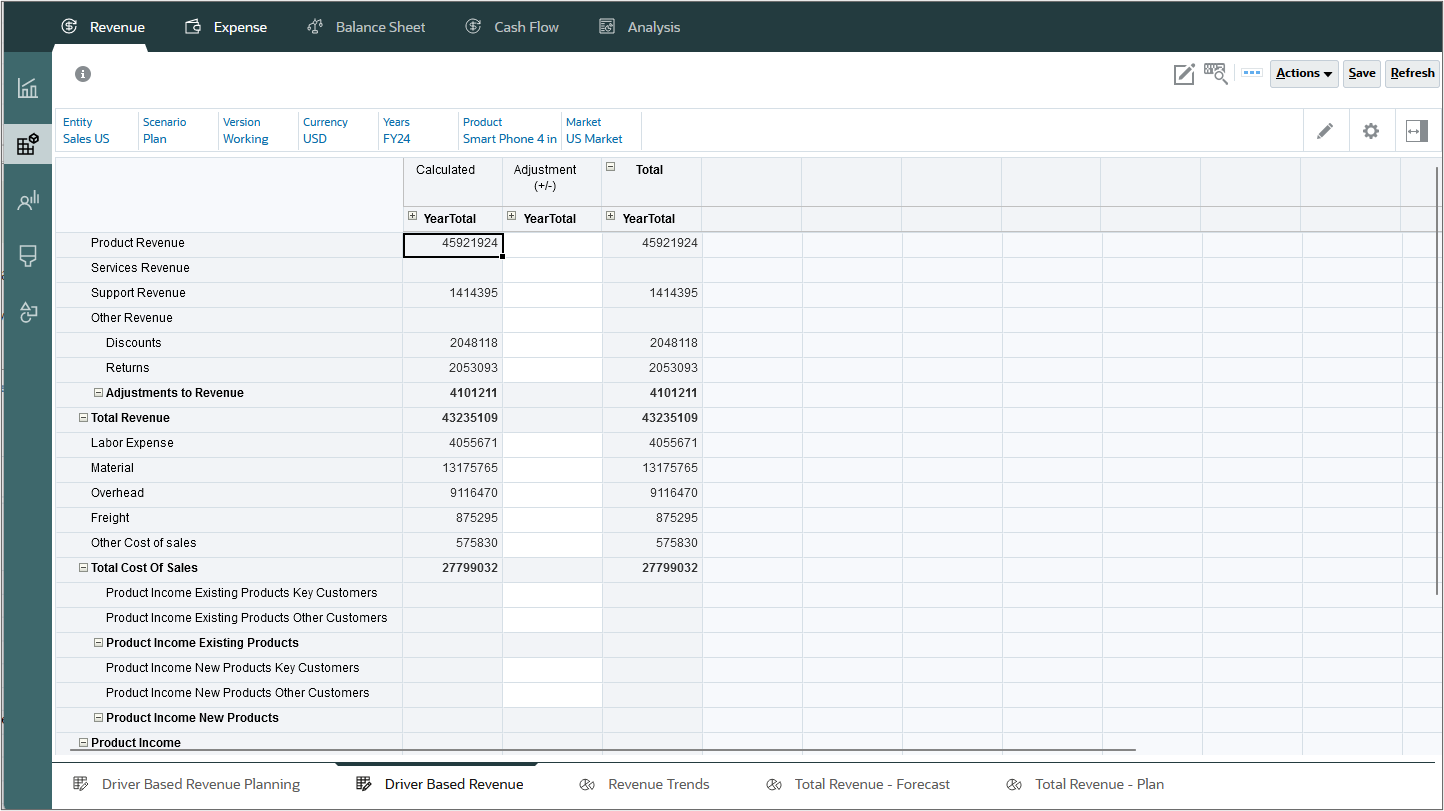
- View values for driver calculated accounts and enter adjustments on Driver Based Revenue and Driver Based Expenses horizontal tabs.
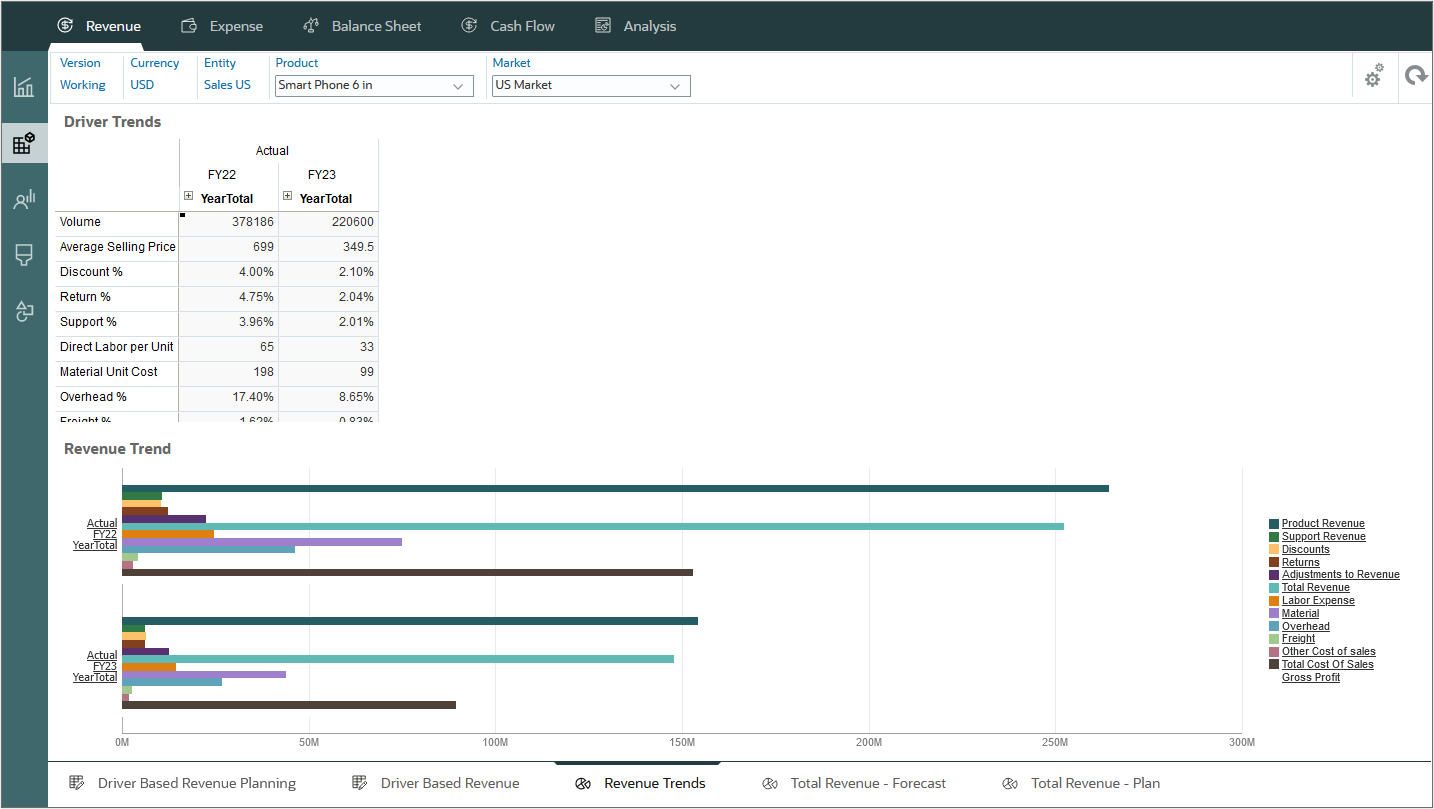
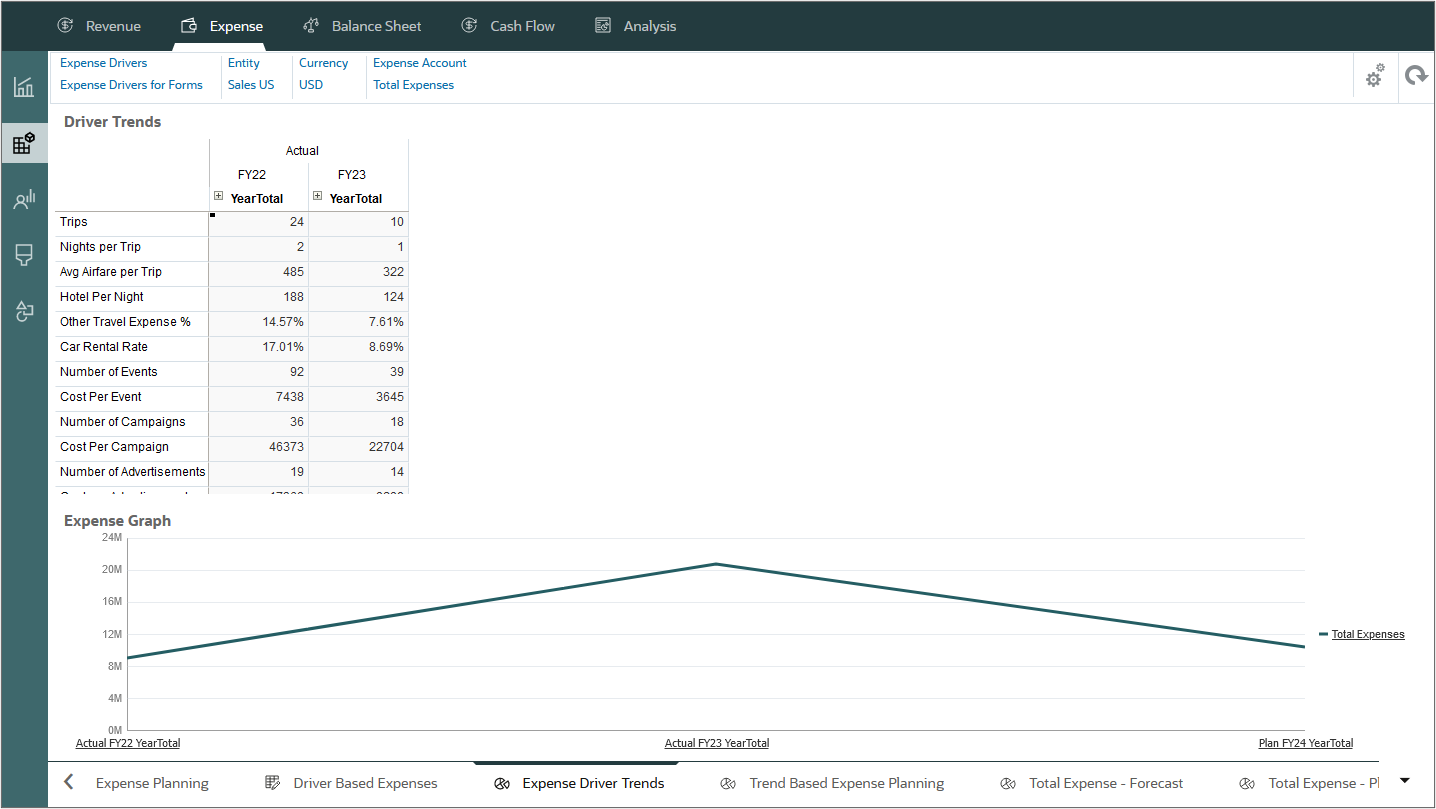
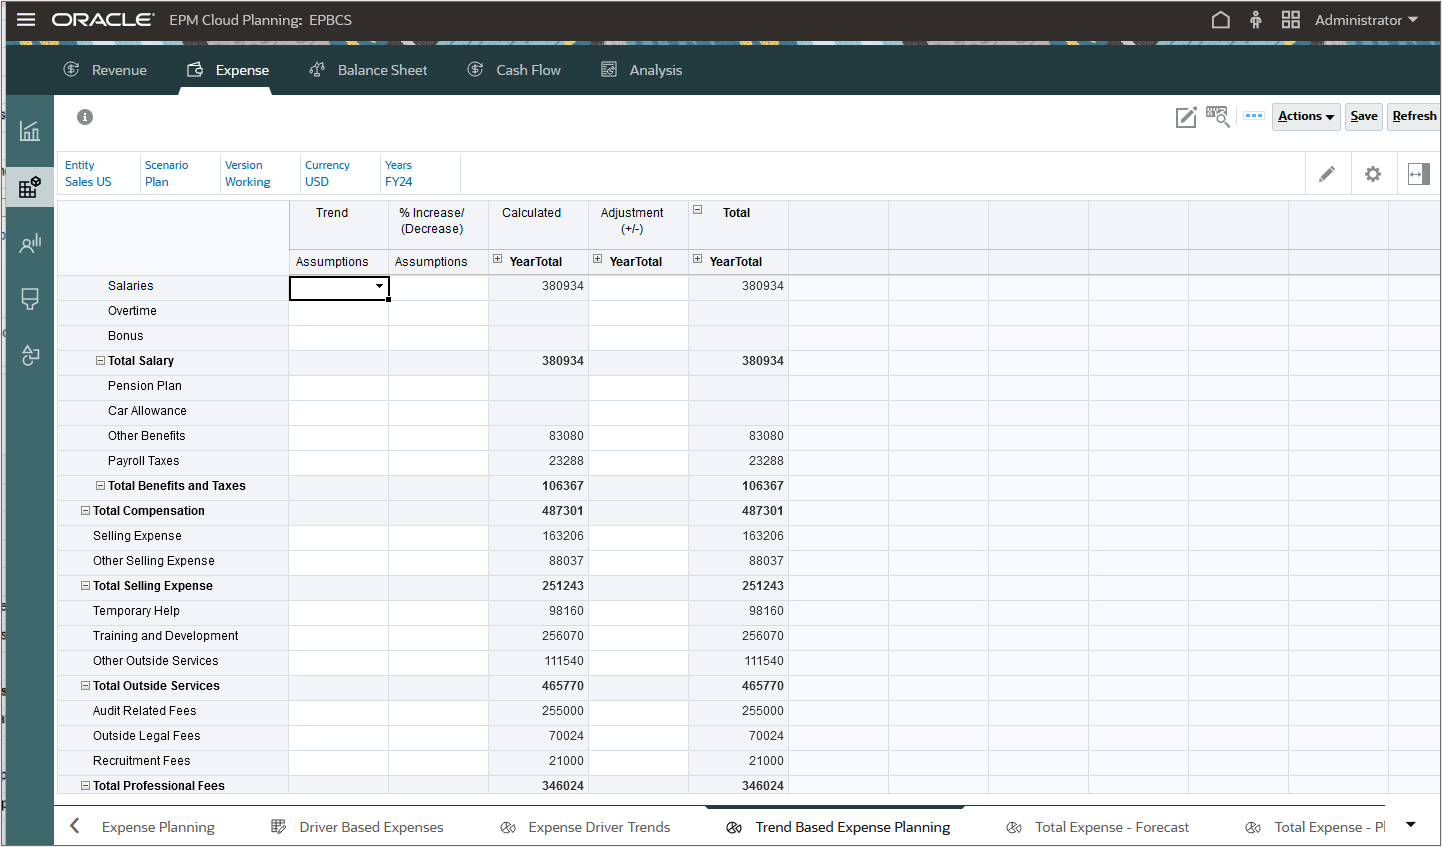
- The Revenue Trends, Expense Trends, and Trend Based Expense Planning horizontal tabs let you set values by adjusting using the current, projected, or past values, selecting a trend, and estimating the percent by which each value is likely to change in % Increase/Decrease.
Tip:
Scroll down to view all members, including the chart of accounts members that were added.For example, to plan for a 3% overtime pay increase, you would set Overtime to Prior Year Actual Average, and enter .03 in % Increase/Decrease.
Manually entering revenue and expenses
- For either Revenue or Expenses, click the Direct Entry vertical tab.
- For each revenue or expense item, enter a monthly or quarterly value.
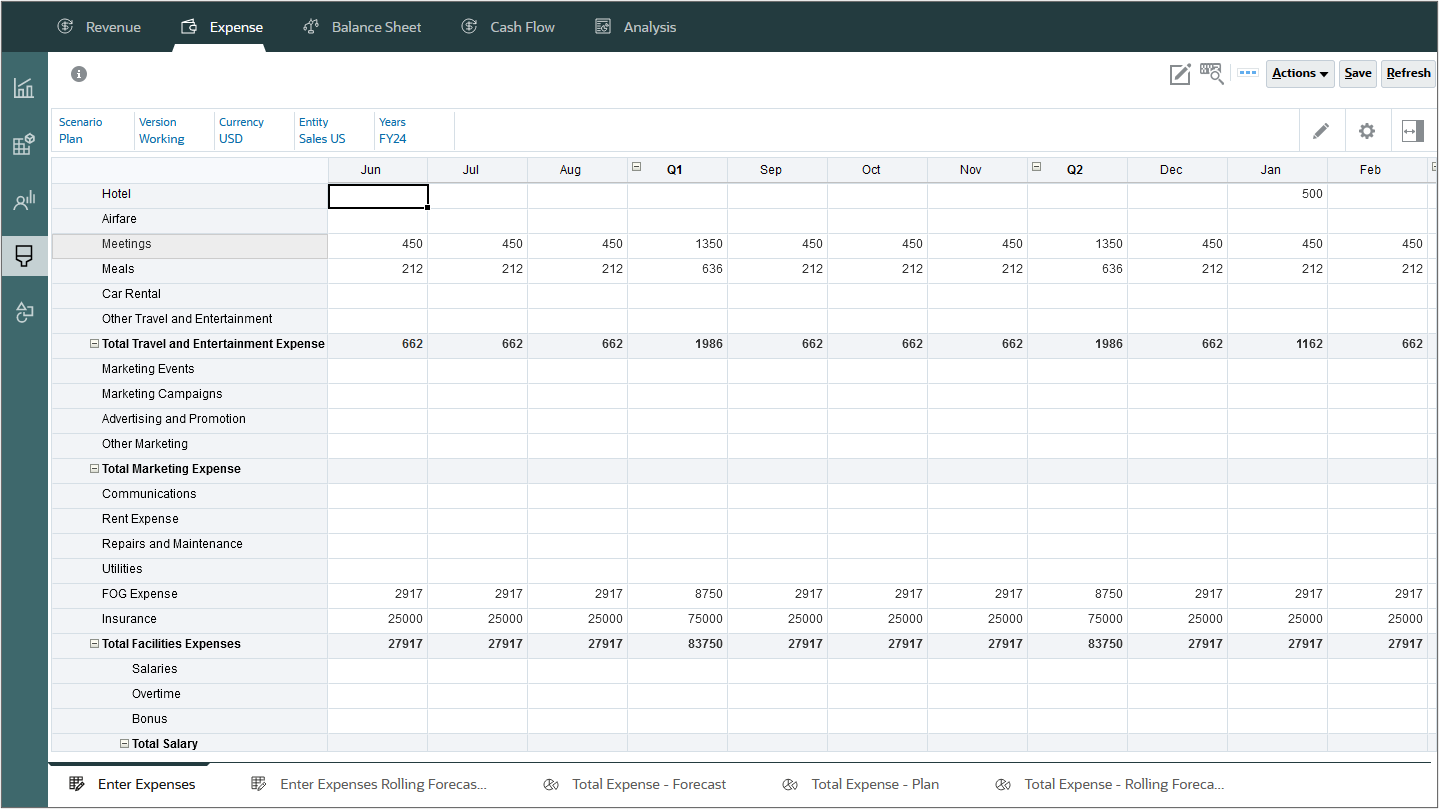
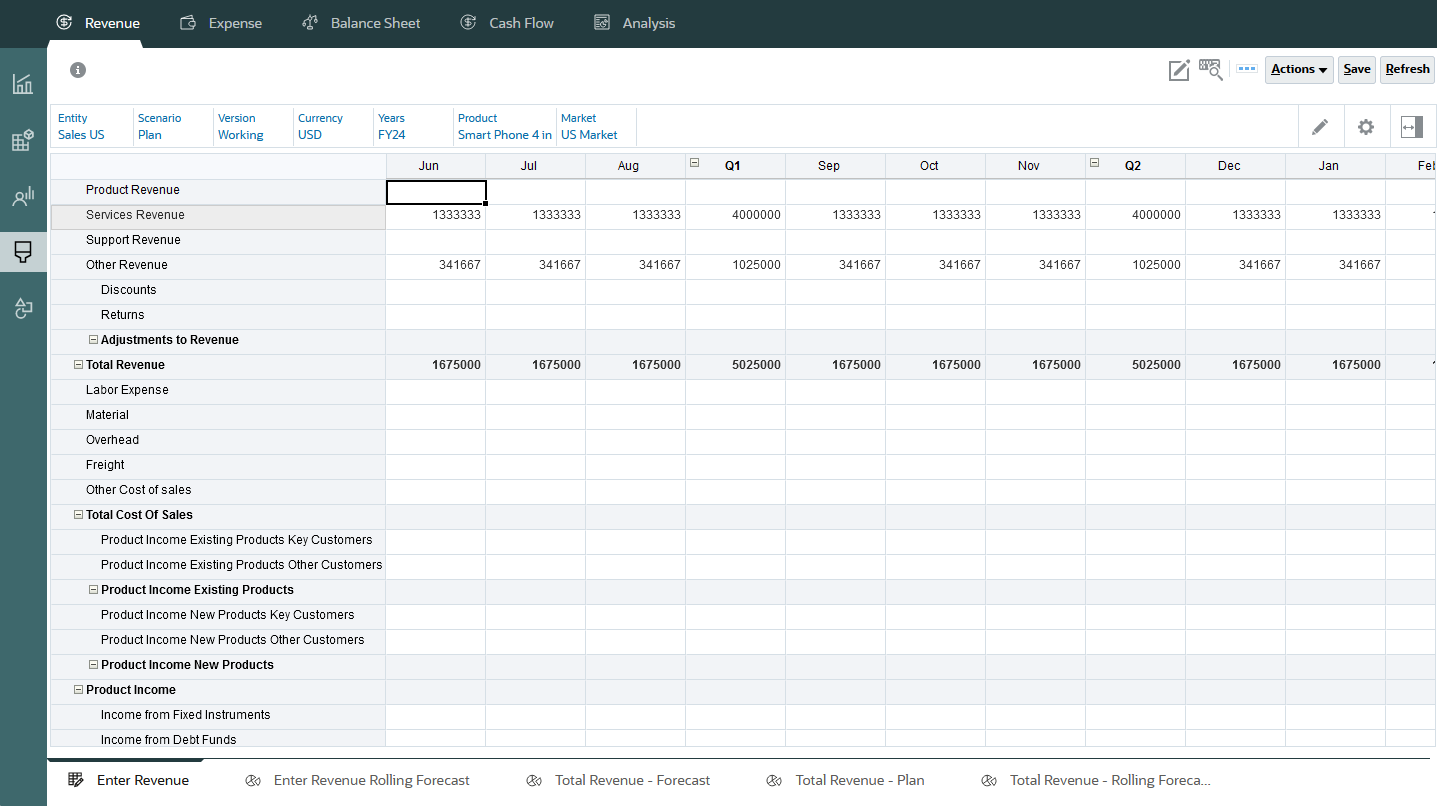
If you are using a rolling forecast, you can plan revenue and expense on the Enter Revenue Rolling Forecast and Enter Expenses Rolling Forecast horizontal tabs, respectively.
Related Links
Leveraging best practice Planning in Financials using your Chart of Accounts
F97844-01
May, 2024