Introduction
This 55-minute hands-on tutorial shows you how to calculate actuals, and prepare plans and forecasts. The sections build on each other and should be completed sequentially.
Background
After enabling Financials, you configure and set up the starting point of your planning and forecasting cycle. You can deploy in phases, by enabling features incrementally, integrating your own chart of accounts with predefined accounts and drivers, and loading data as a basis for building your plans and forecasts.
Leverage out-of-the-box calculations to aggregate and prepare actual, plan, and forecast data. This tutorial focuses on the following calculation rules:
- Calculate Actuals—calculates drivers and aggregates data in Actuals. Run this rule to ensure that you're working with the latest figures and calculations.
- Rollup—aggregates plan or forecast data. Run this rule to update reports or analyze data at various levels of the business hierarchy. If you enabled revenue dimensions, this rule must be run to see Total Revenue data.
- Prepare Plans— calculates Plan based on the trends and drivers set up in Financials. Run this rule to create or update a plan, or create a starting point for rolling over to a new year.
- Prepare Forecast— copies selected months of Actual data results to the Forecast scenario and recalculates drivers and trends based on the new periods of actual results. Run this rule when rolling over to a new year to create a starting point for a forecast.
Prerequisites
Cloud EPM Hands-on Tutorials may require you to import a snapshot into your Cloud EPM Enterprise Service instance. Before you can import a tutorial snapshot, you must request another Cloud EPM Enterprise Service instance or remove your current application and business process. The tutorial snapshot will not import over your existing application or business process, nor will it automatically replace or restore the application or business process you are currently working with.
Before starting this tutorial, you must:
- Have Service Administrator access to a Cloud EPM Enterprise Service instance. The instance should not have a business process created.
- Upload and import this snapshot into your Planning instance. Alternatively, you can complete the steps in the Configuring Financials to Bring In Your Chart of Accounts hands-on tutorial, and use that as your starting point for this tutorial.
- Save this data file locally and extract the file. You will be importing data using these load files.
Note:
If you run into migration errors importing the snapshot, re-run the migration excluding the HSS-Shared Services component, as well as the Security and User Preferences artifacts in the Core component. For more information on uploading and importing snapshots, refer to the Administering Migration for Oracle Enterprise Performance Management Cloud documentation.Reviewing the foundation for your plans and forecasts
In this section, you review the enabled features and time frame granularity, set values for user variables, and view data in Financials.
Reviewing enabled features
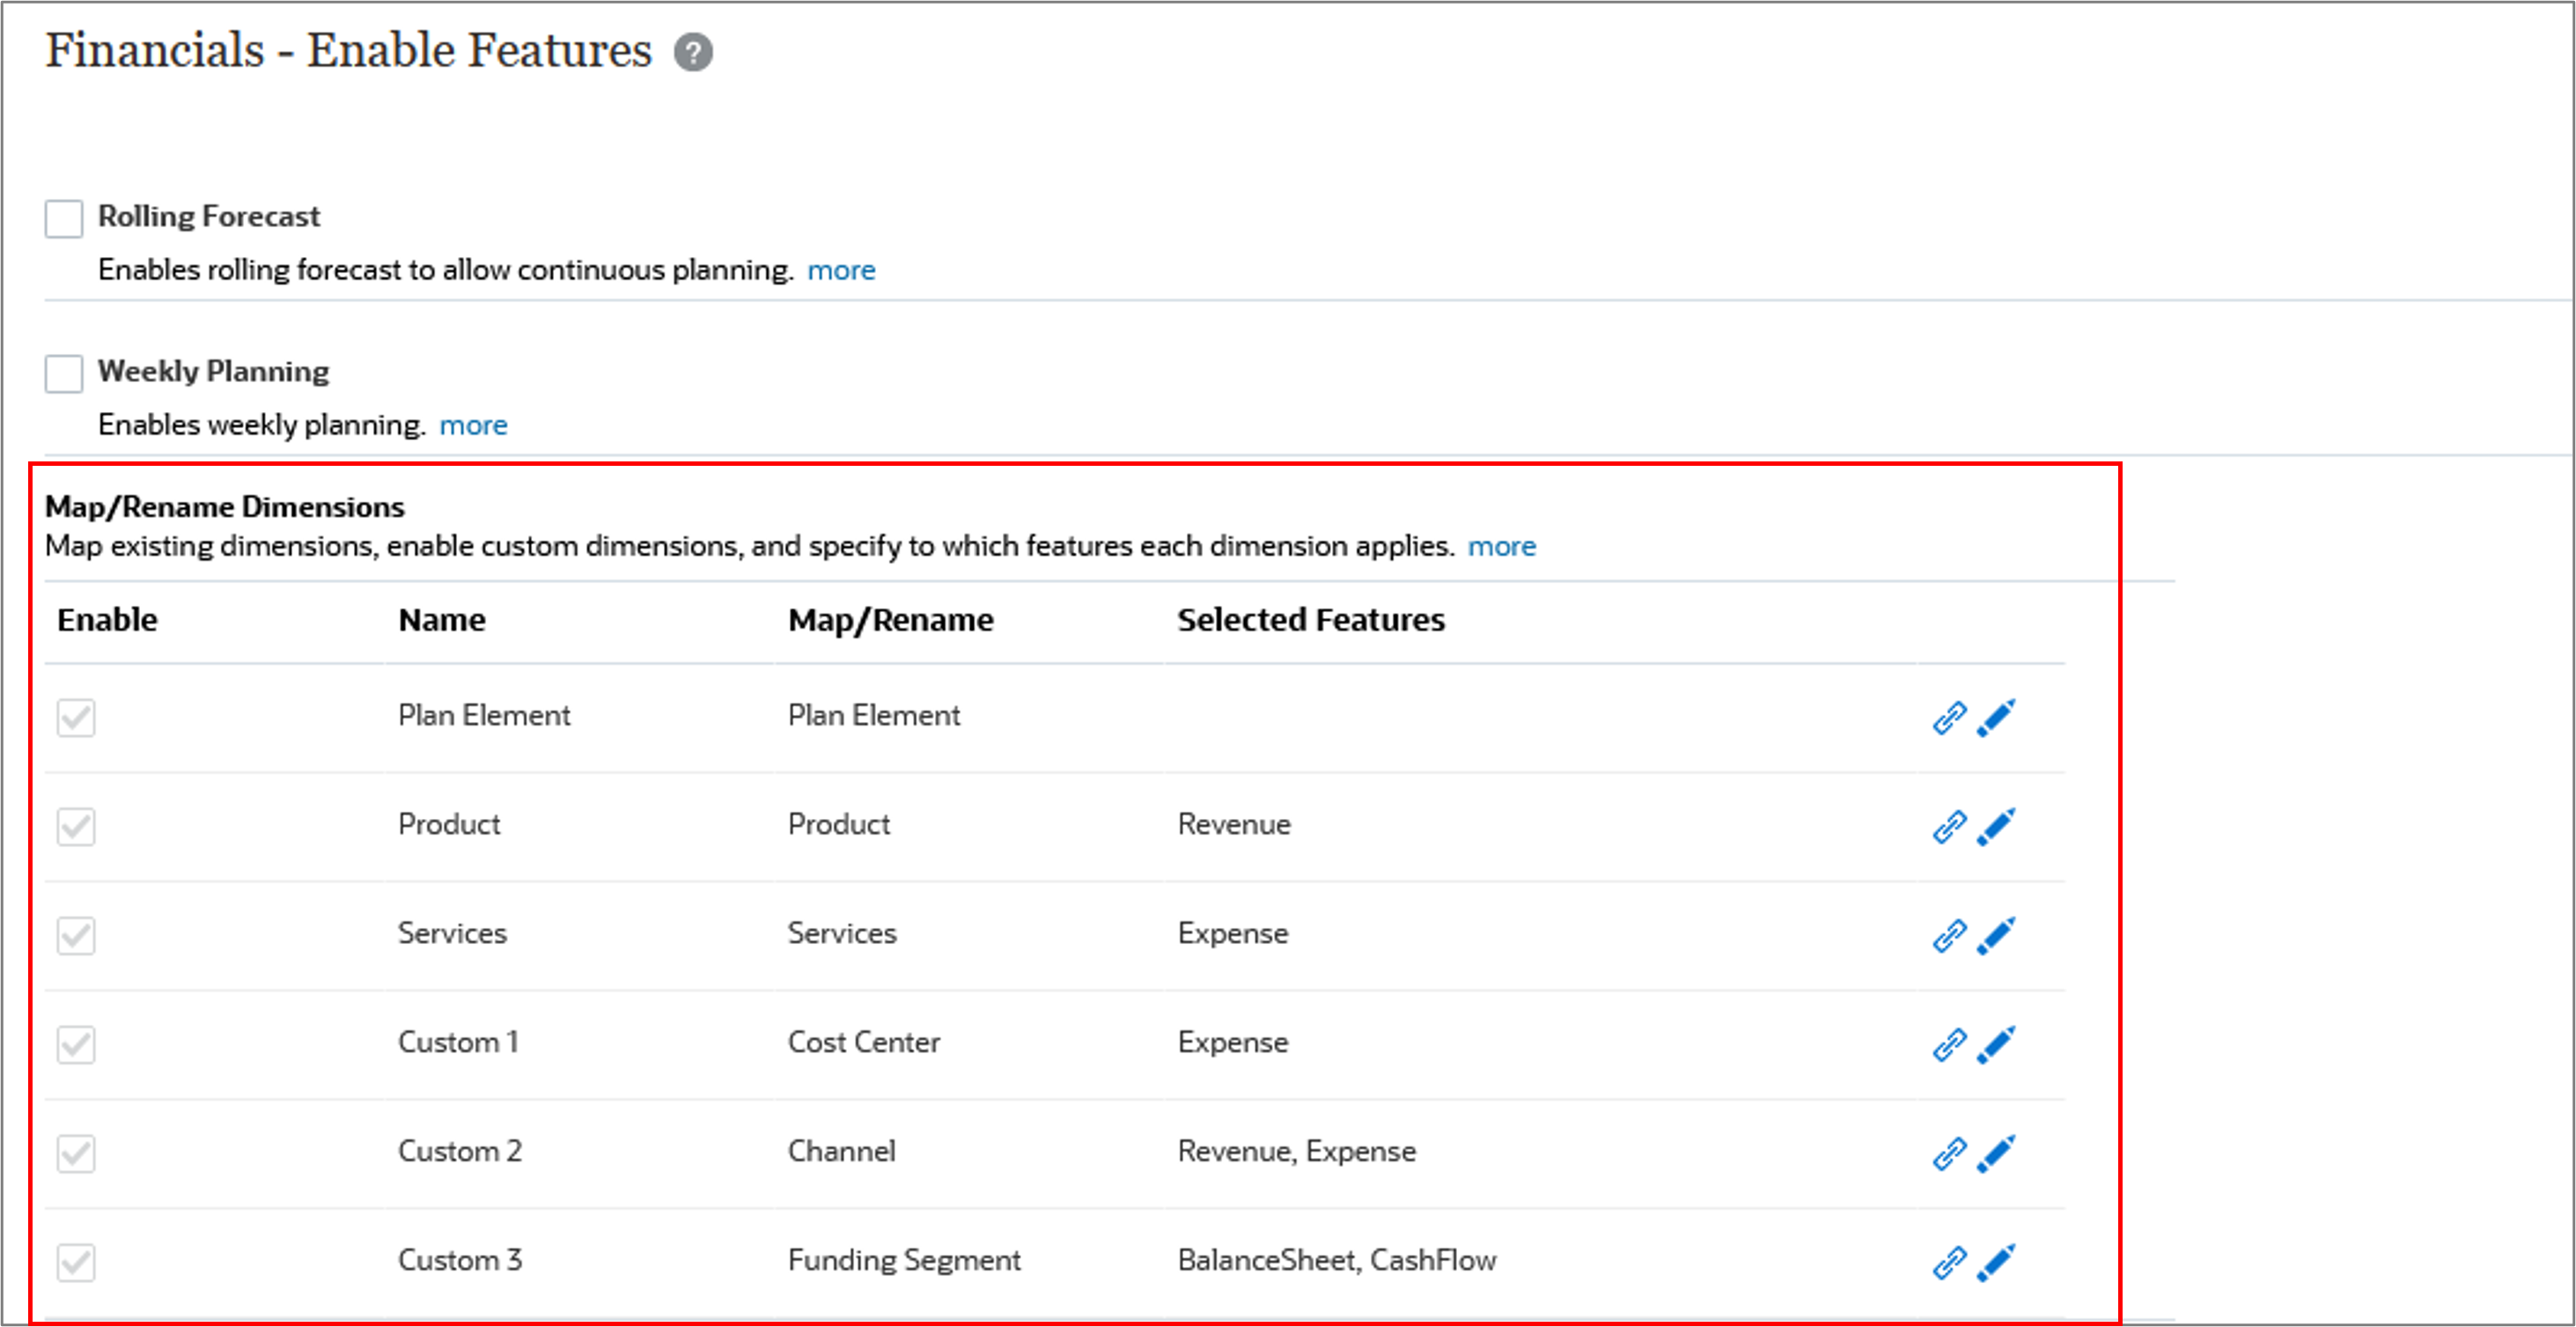
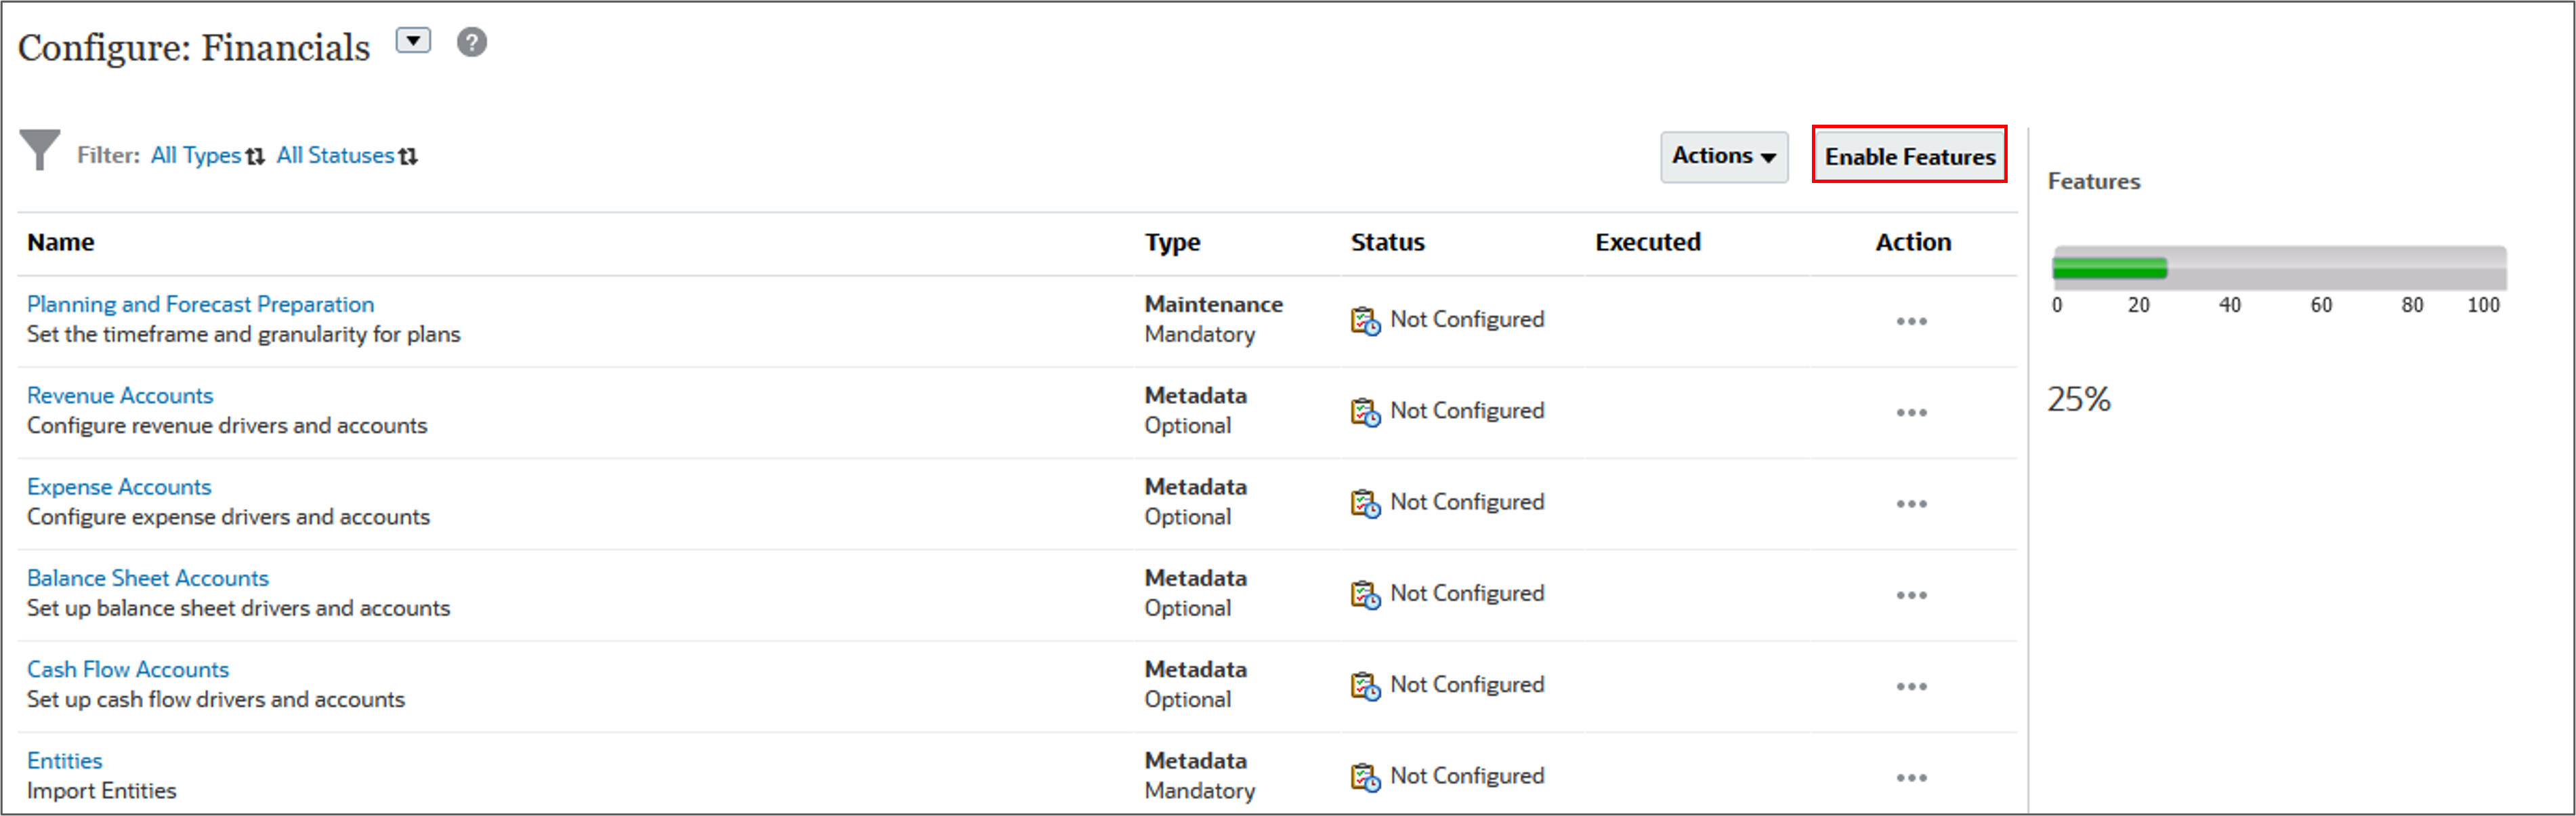
In Enable Features, you select which parent key members, accounts, and drivers you want to enable for your Financials business process, as well as add and map custom dimensions. Based on your selections, dimensions, drivers, forms, and accounts are created.
Note:
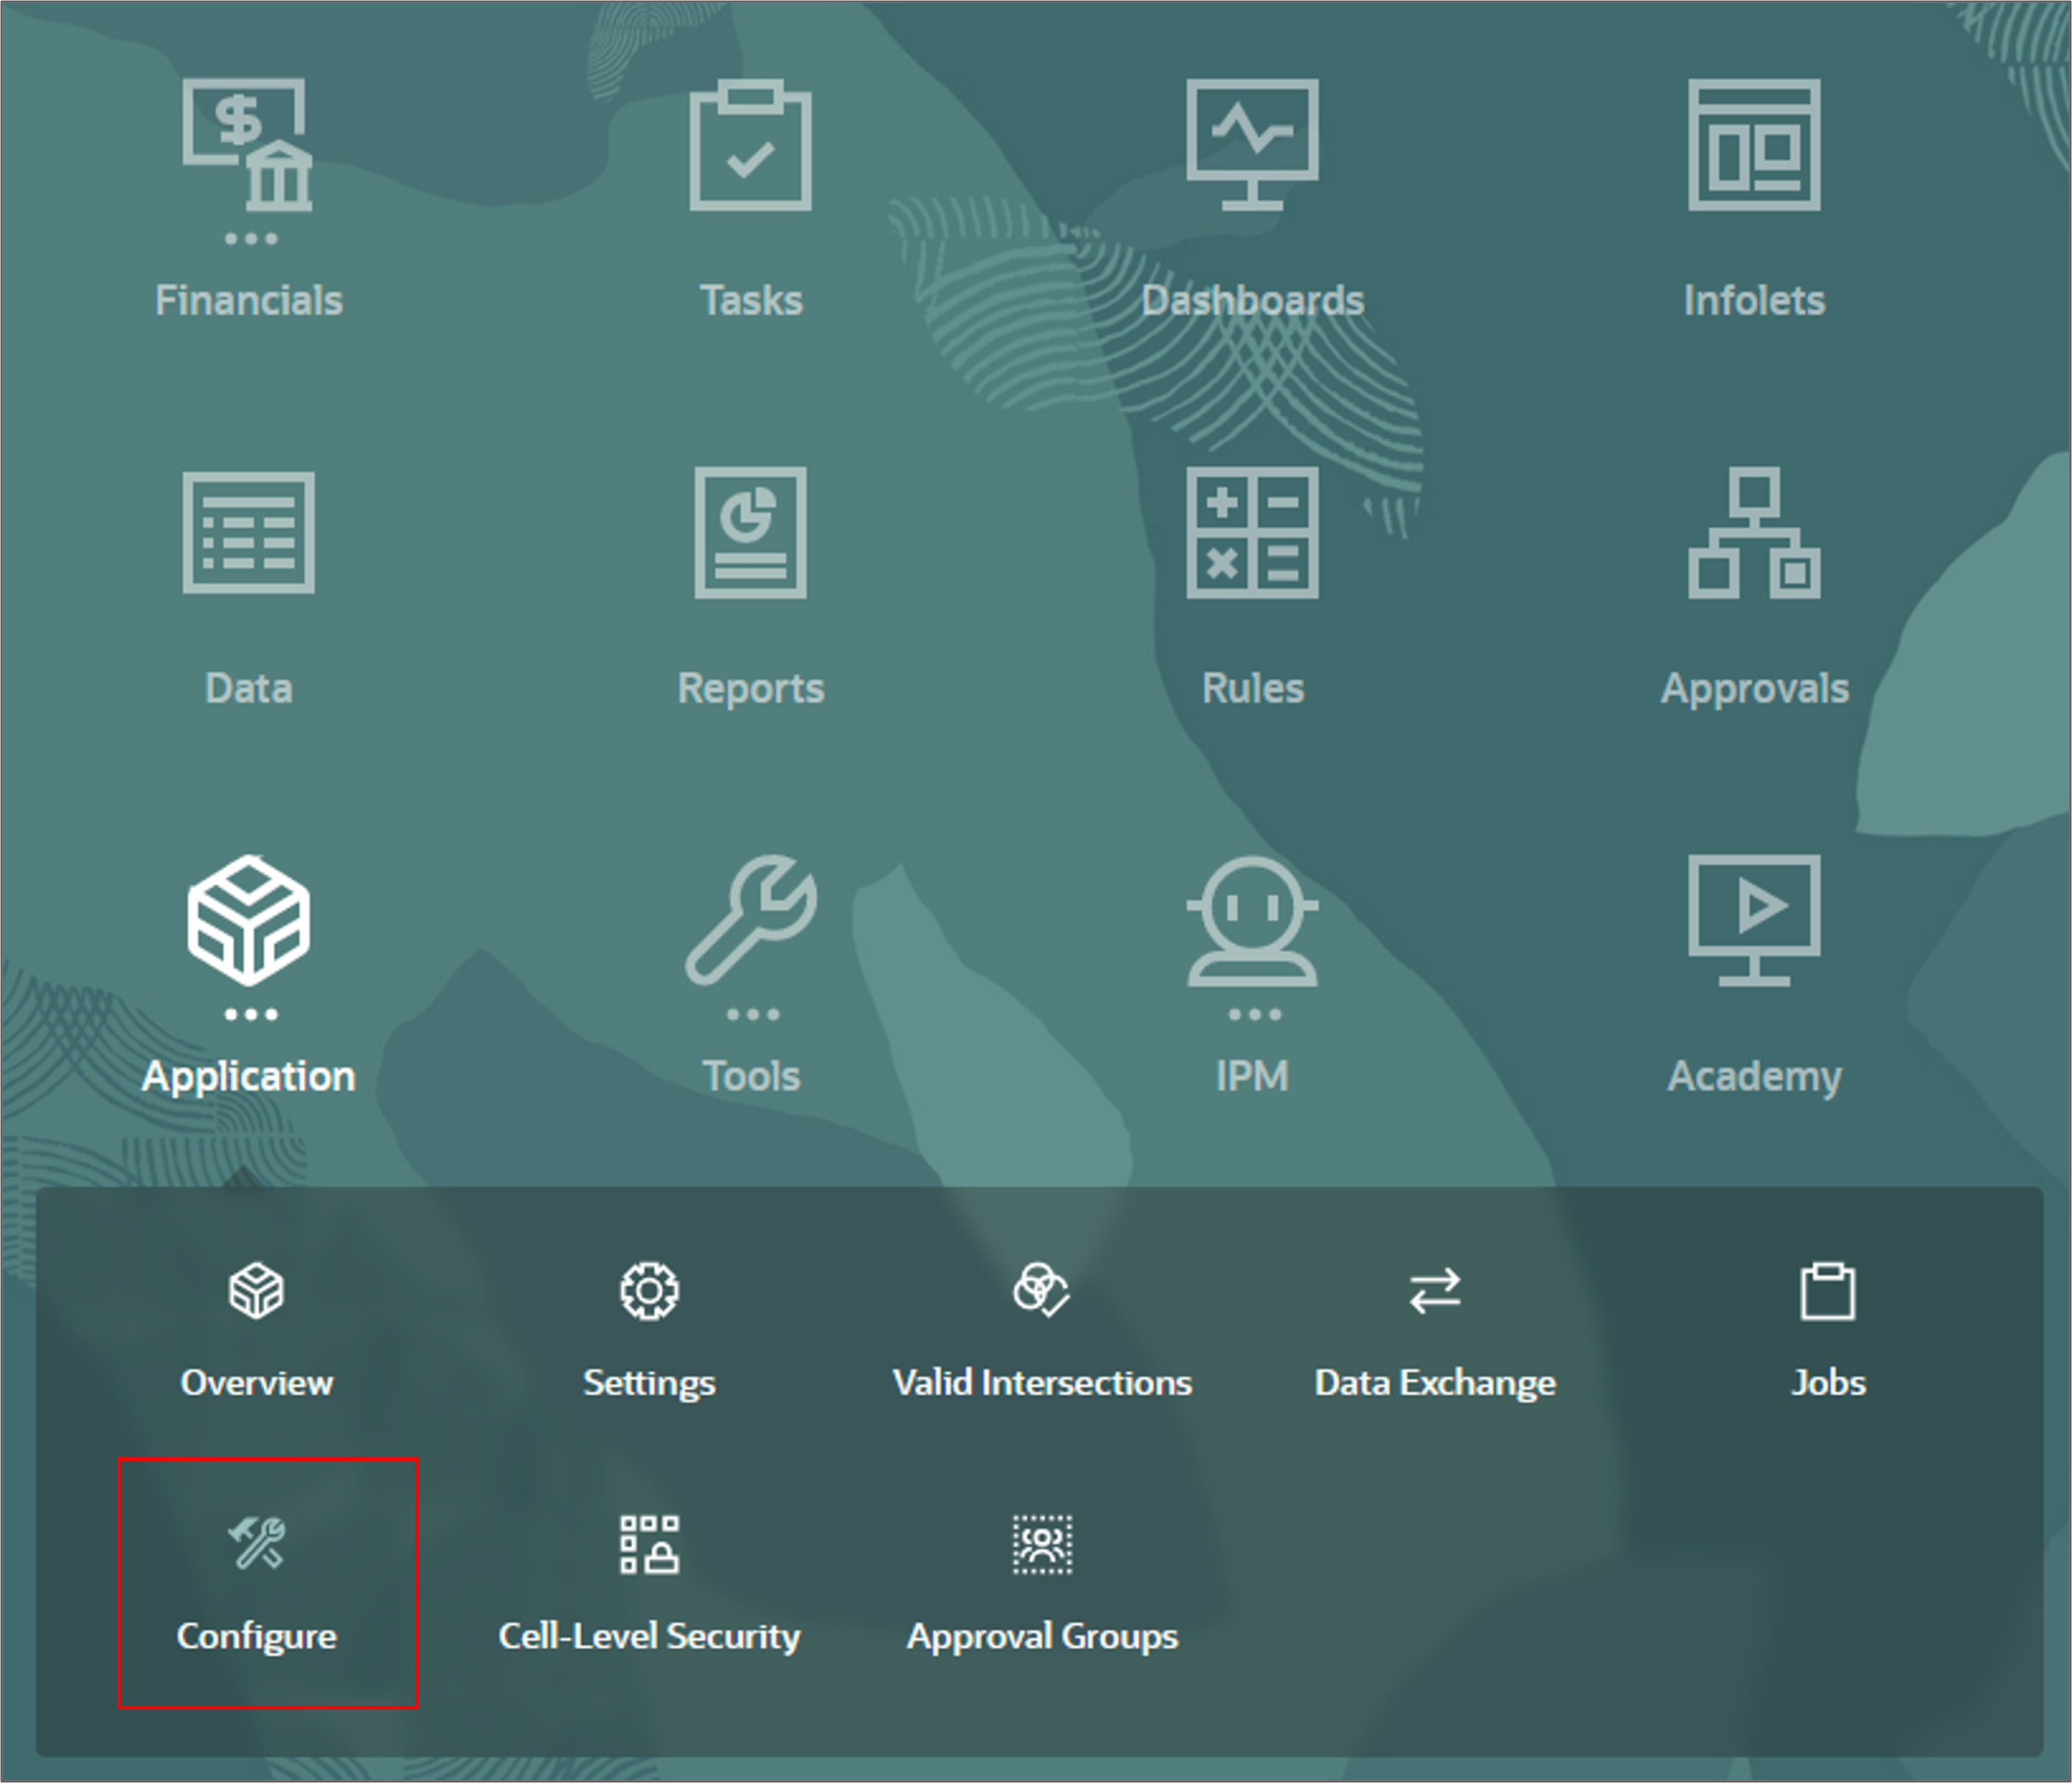
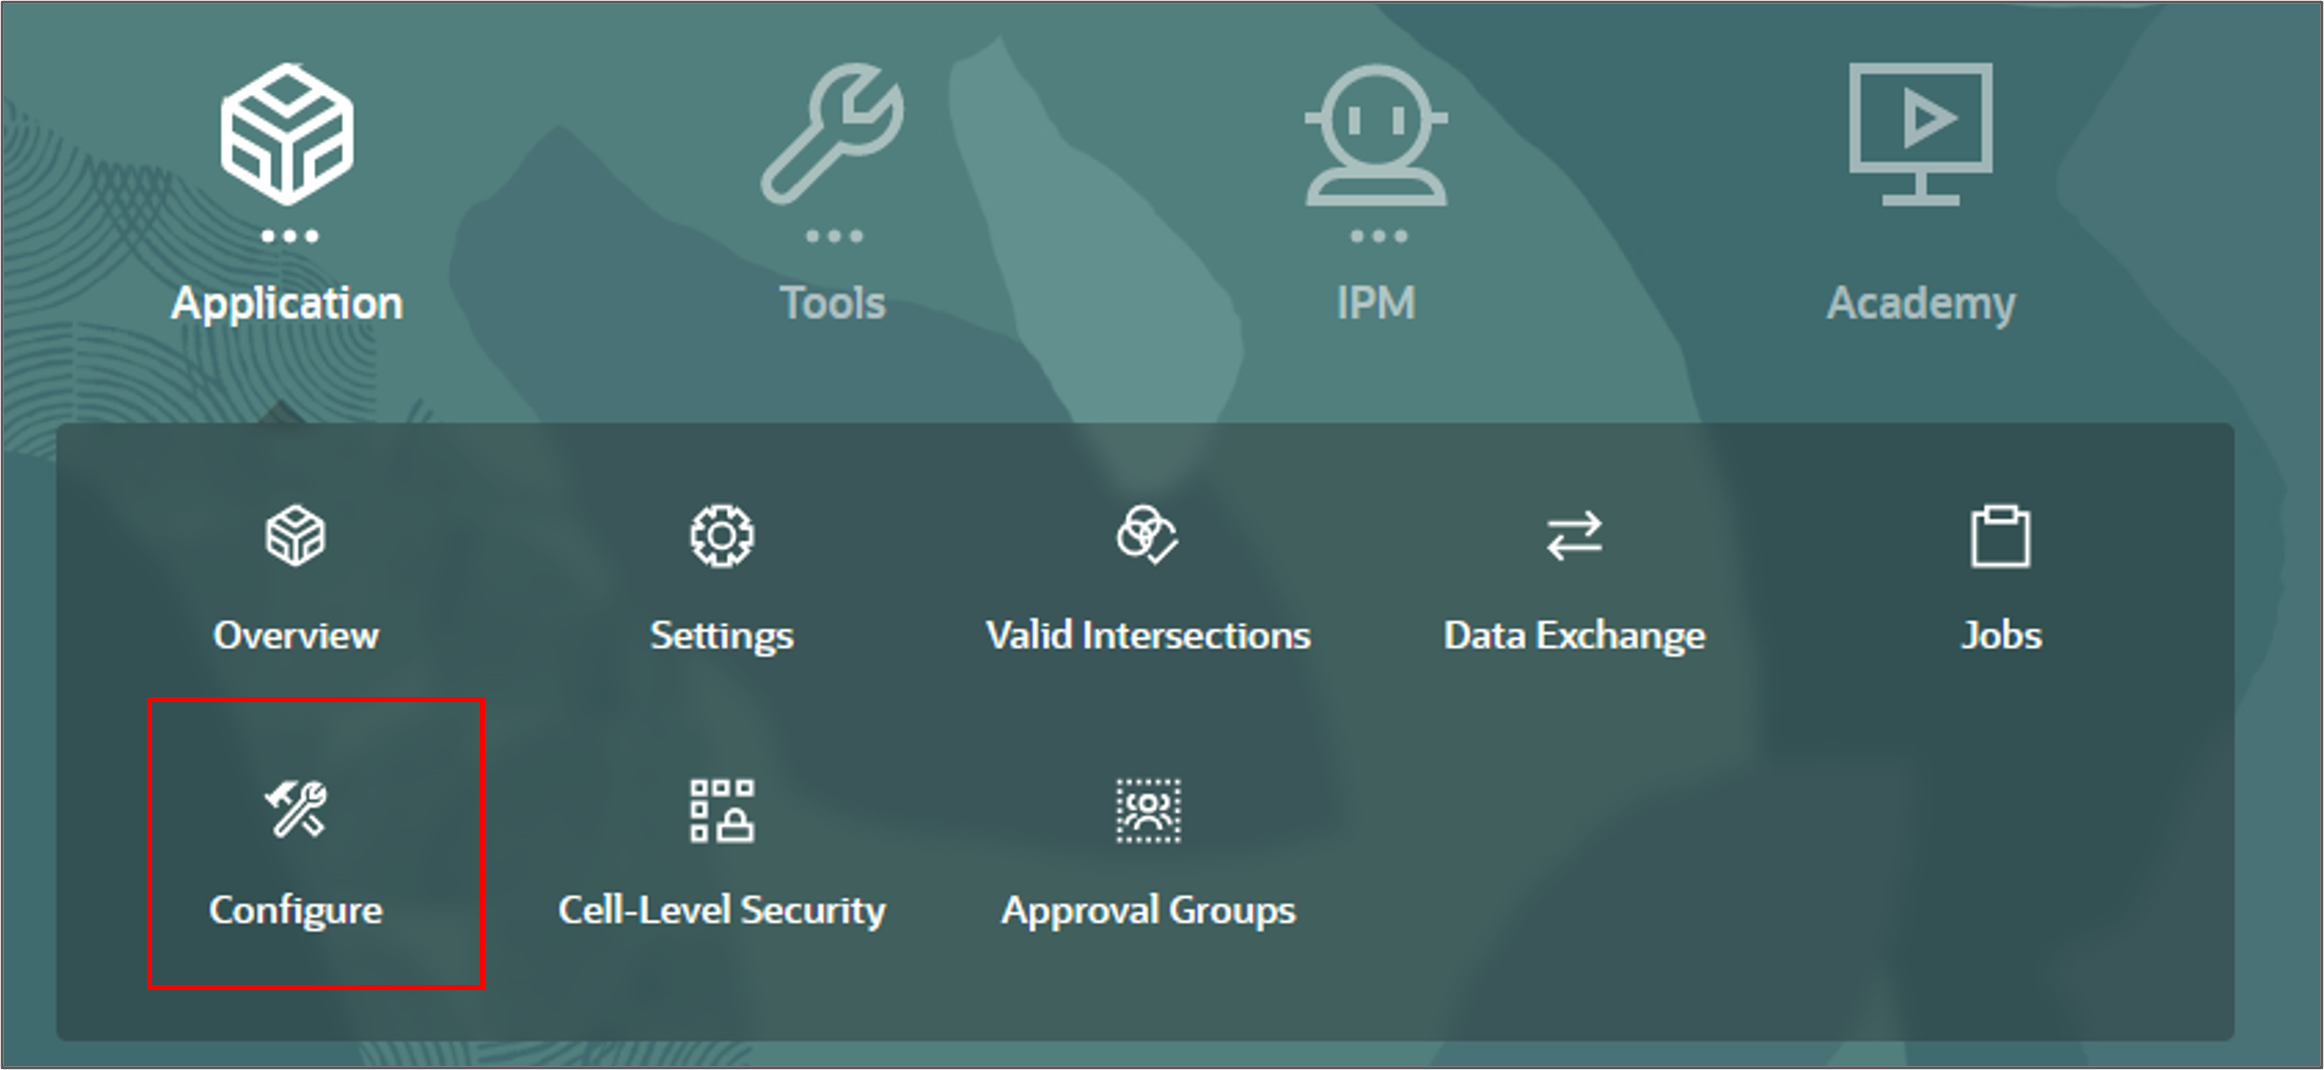
You must define all custom dimensions the first time you enable features. You can’t define these later.- On the Planning home page, click Application then Configure.
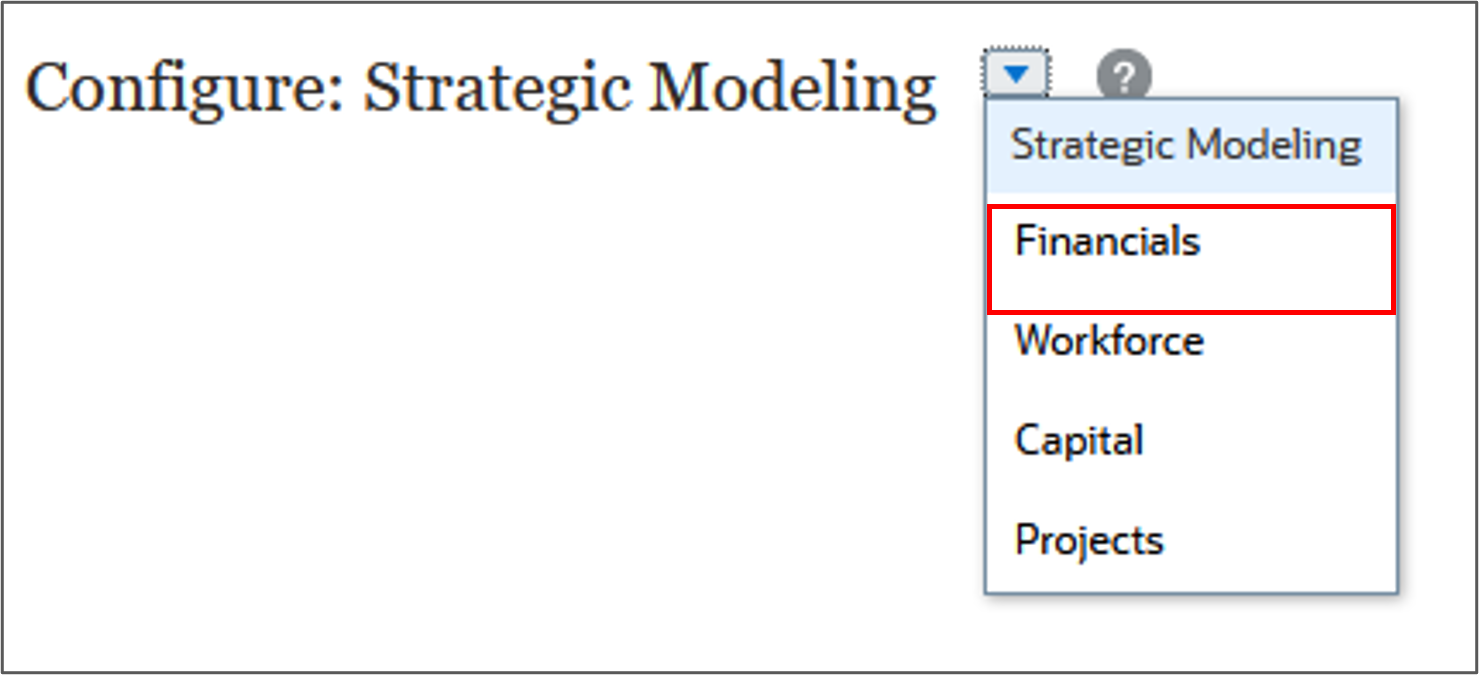
- From the Configure drop-down, select Financials.
- Click Enable Features.
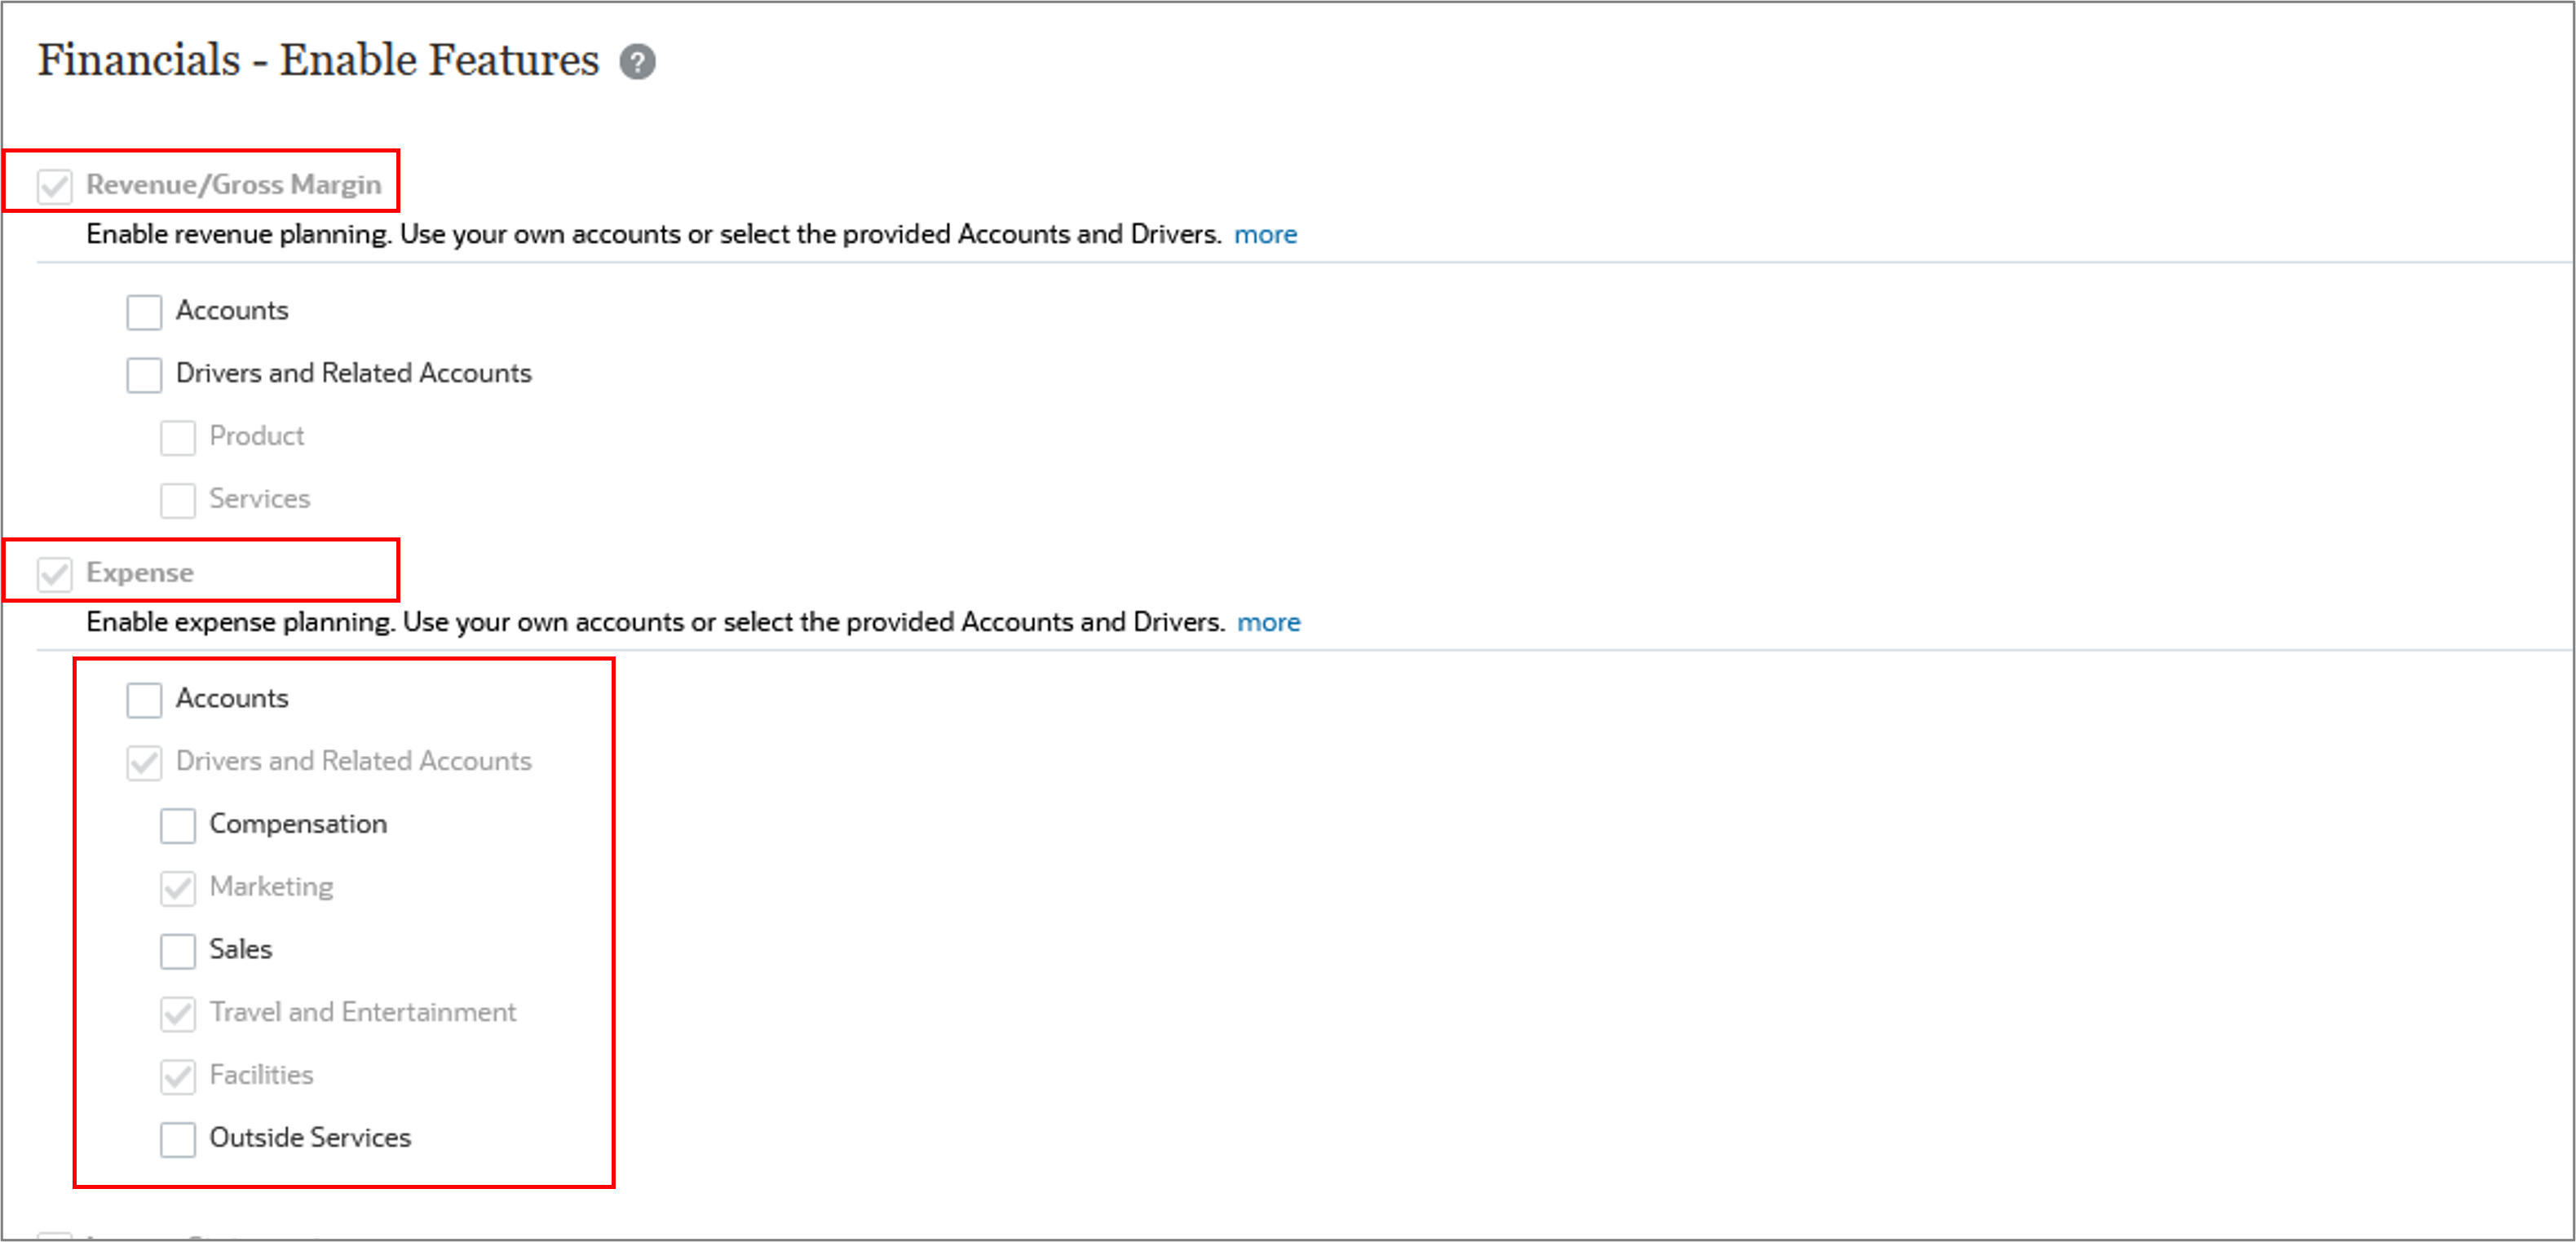
- Scroll down.
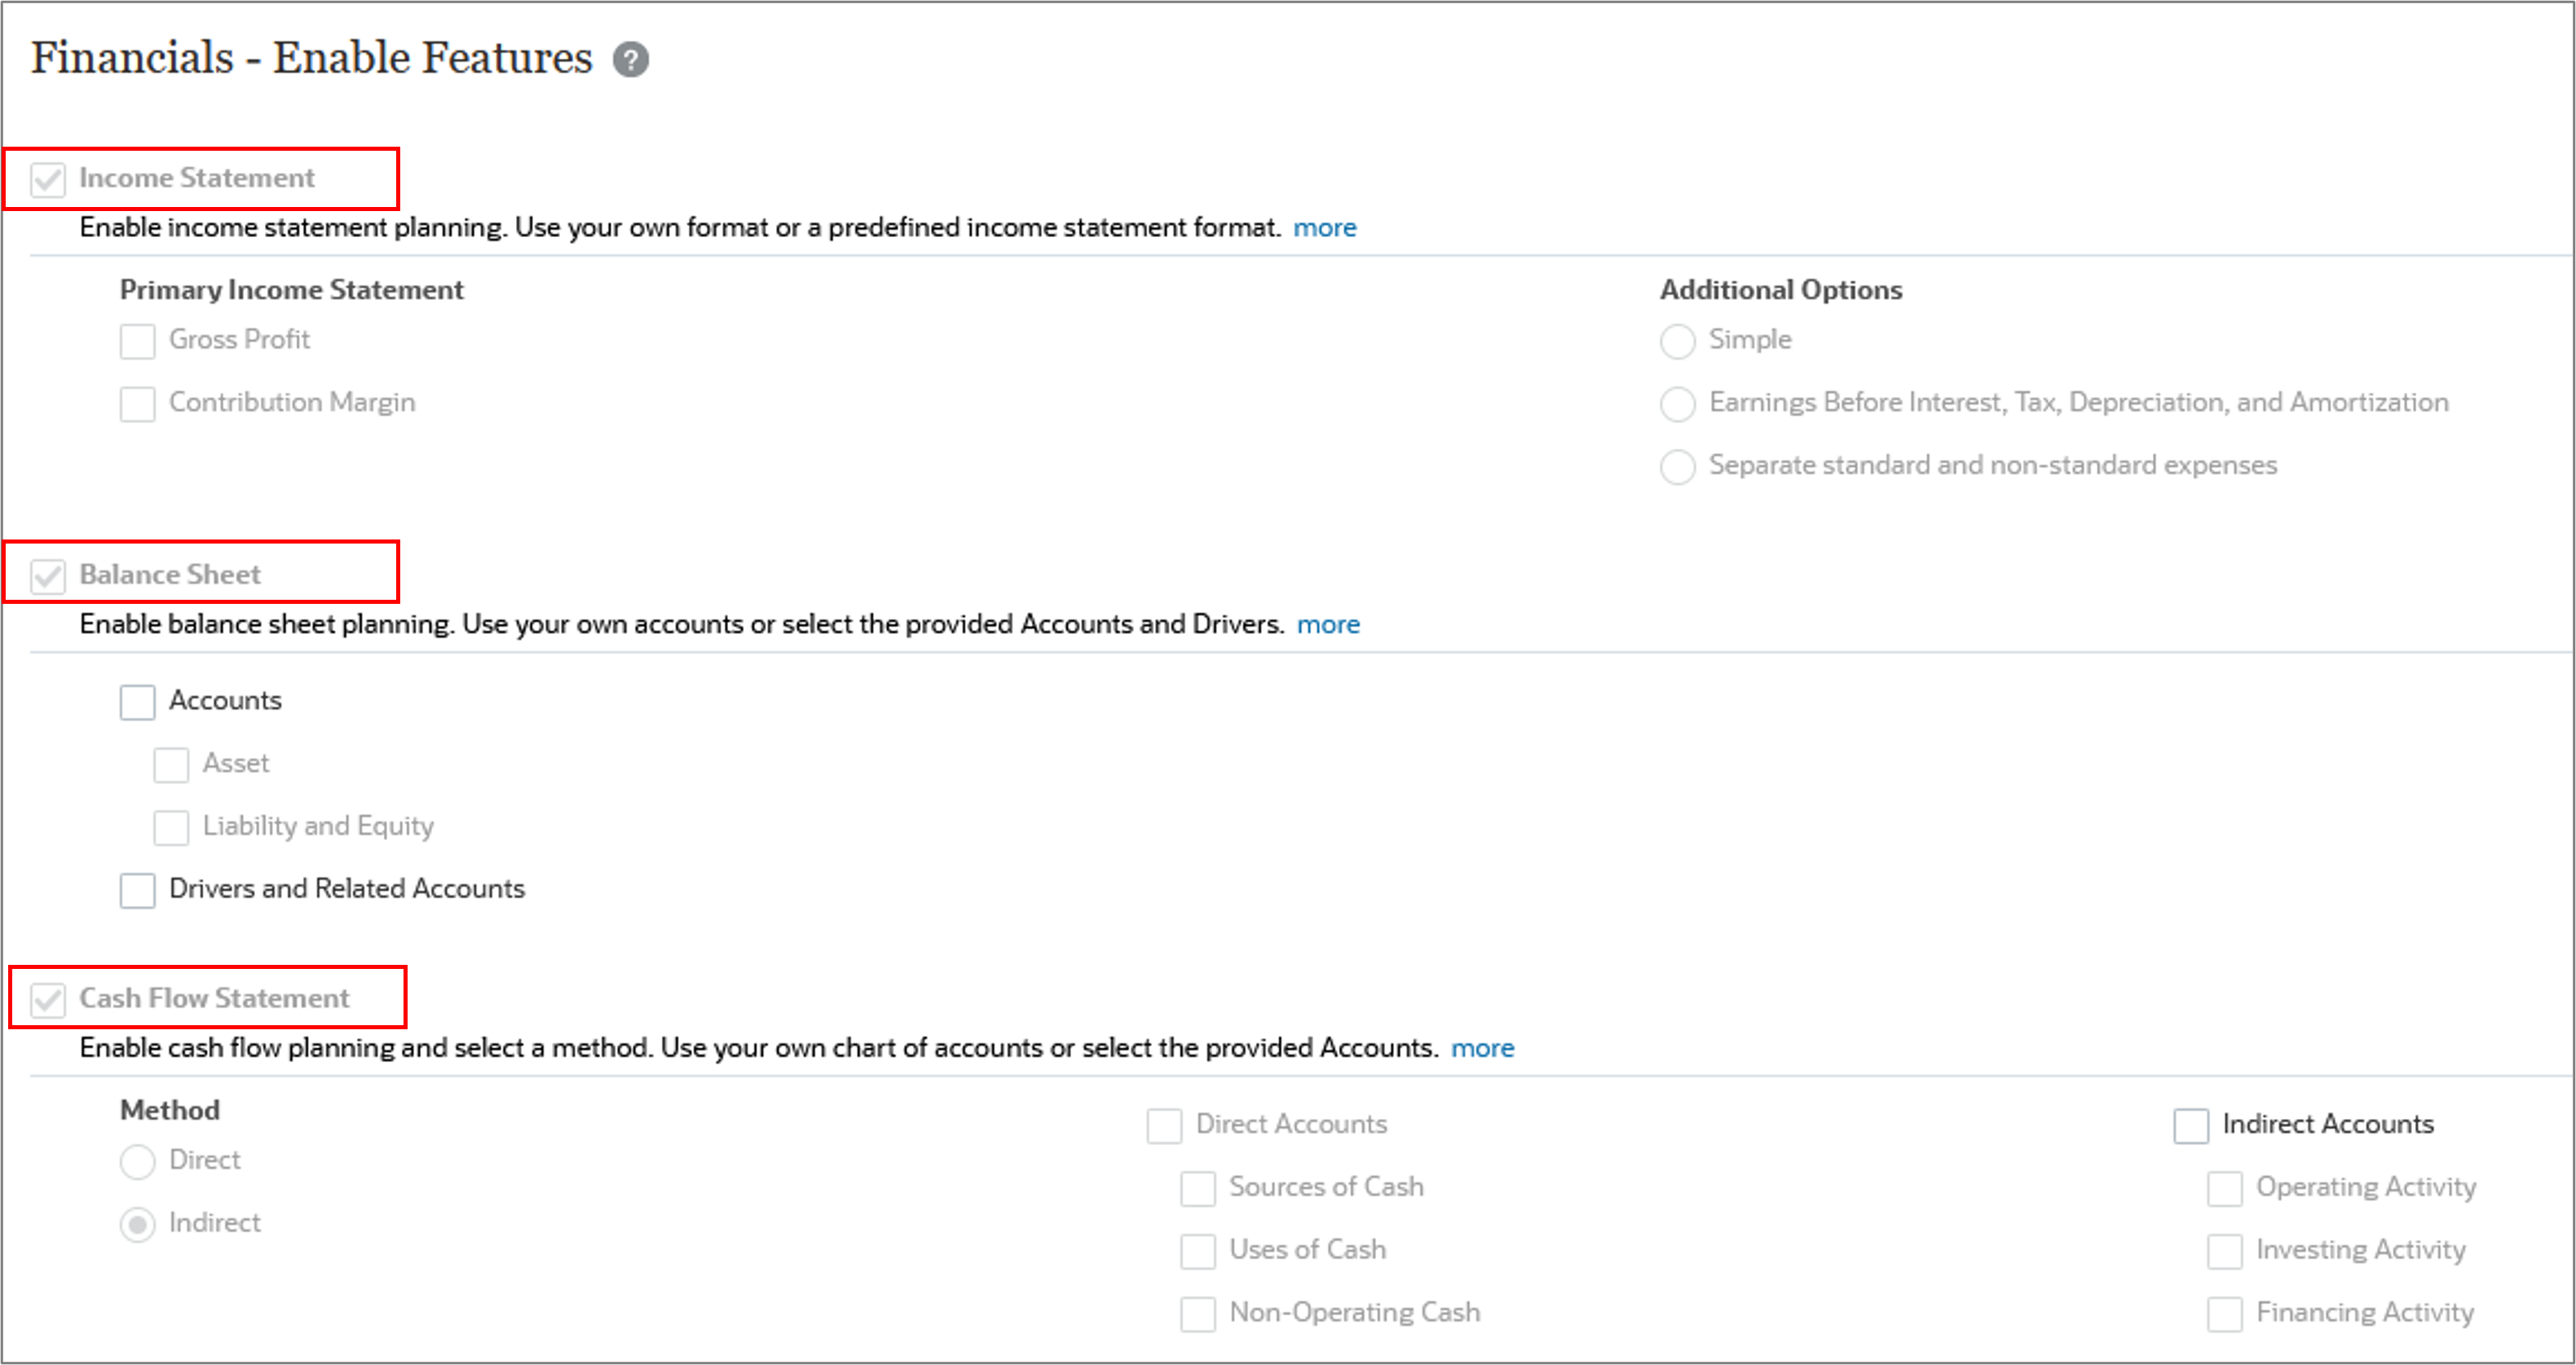
- Scroll down.
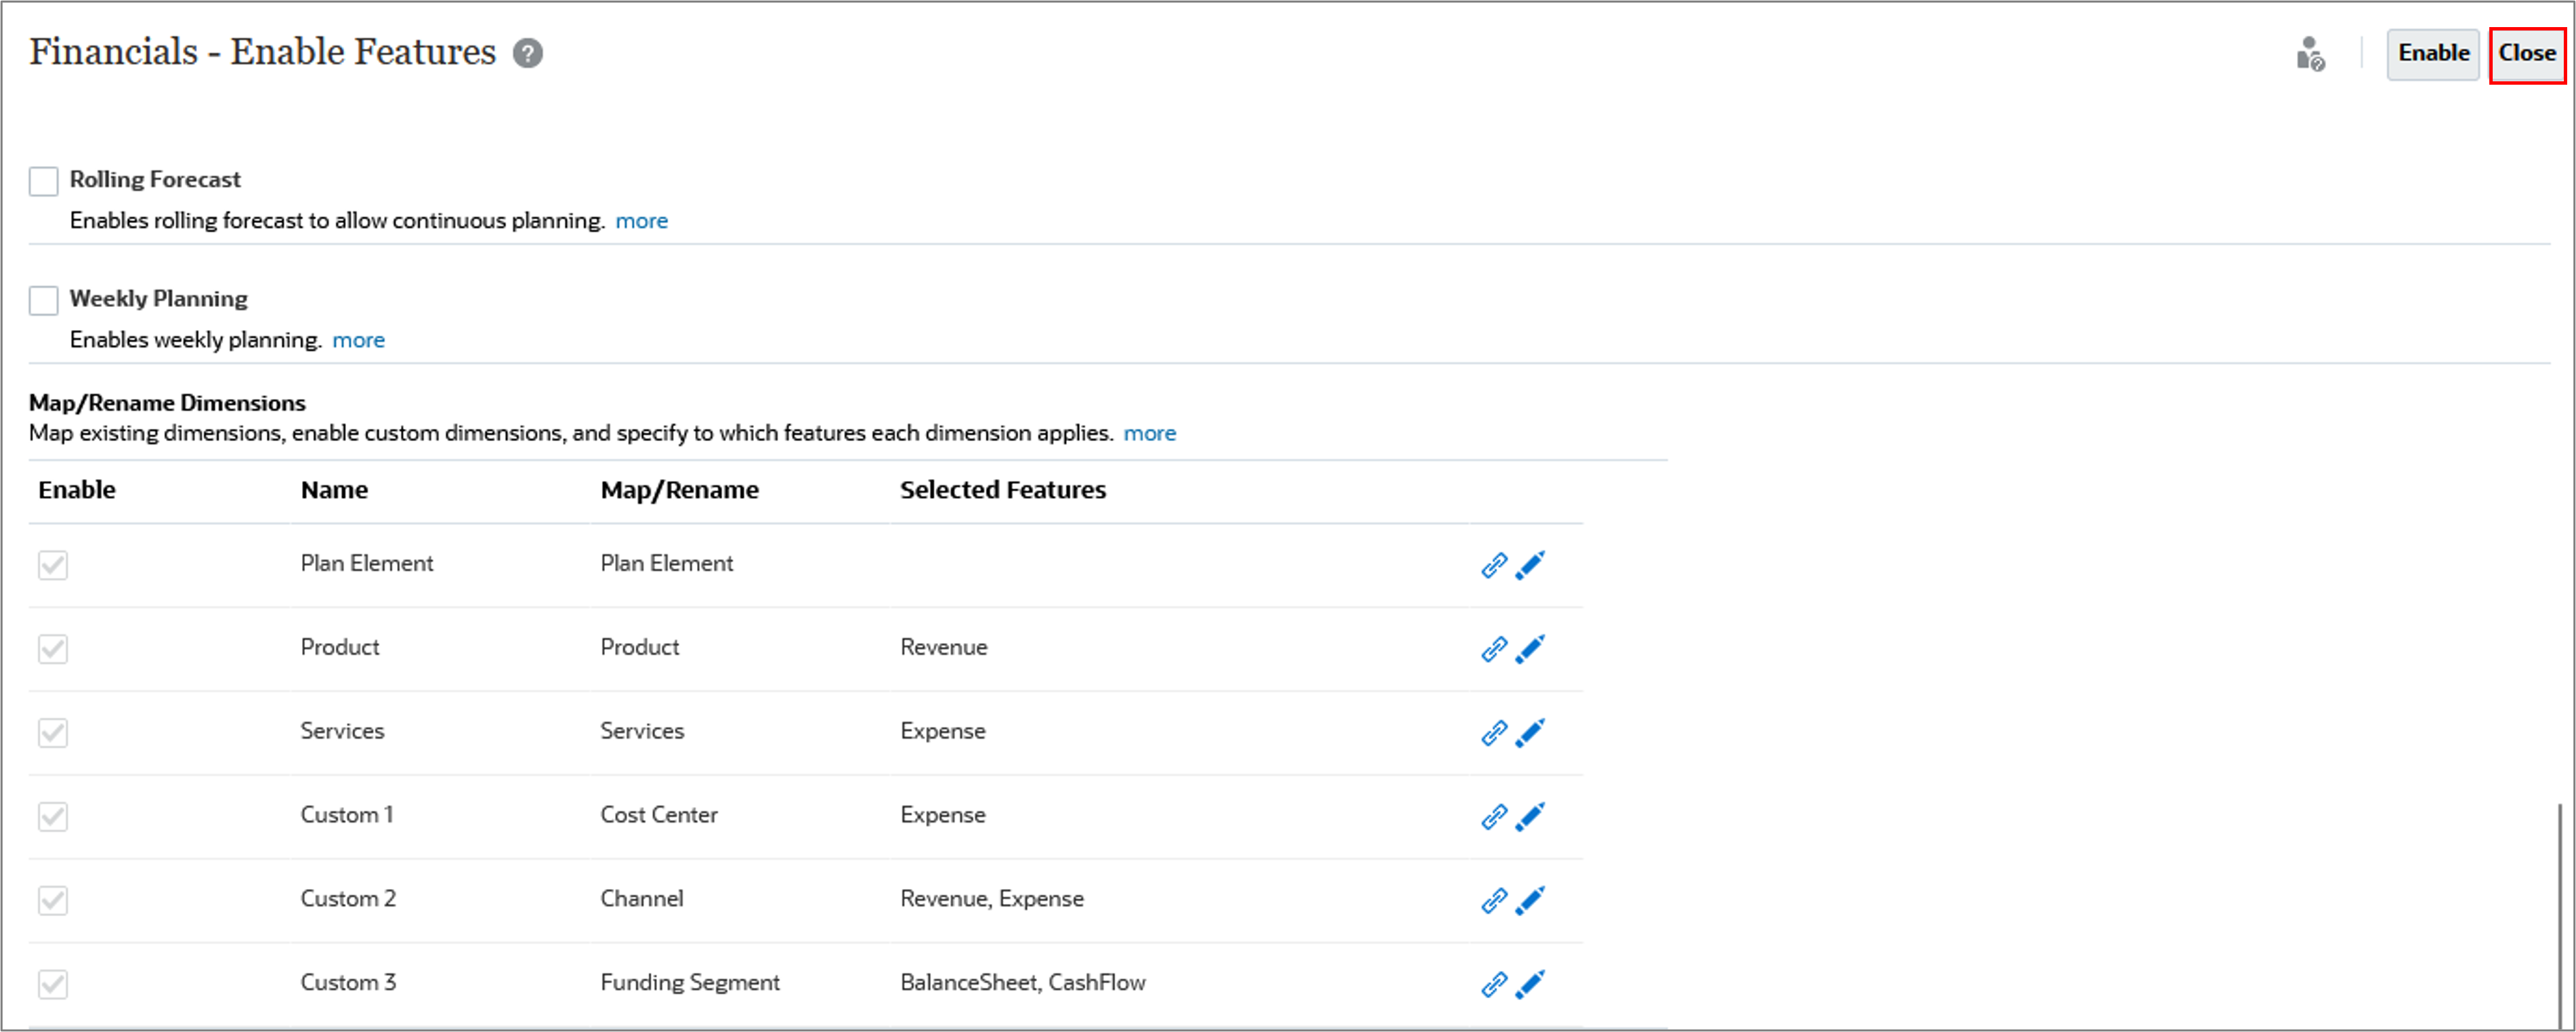
Existing dimensions and custom dimensions are displayed. Product dimension is enabled for Revenue and the Services dimension is enabled for Expense. Cost Center is enabled for Expense. Channel is enabled for both Revenue and Expense. Funding Segment is enabled for Balance Sheet and Cash Flow.
- Click Close.
Revenue and Expense planning is enabled. Expenses are configured so that you can plan with drivers and related accounts.
Income Statement, Balance Sheet and Cash Flow are configured.
Currently, rolling forecast and weekly planning are not configured.
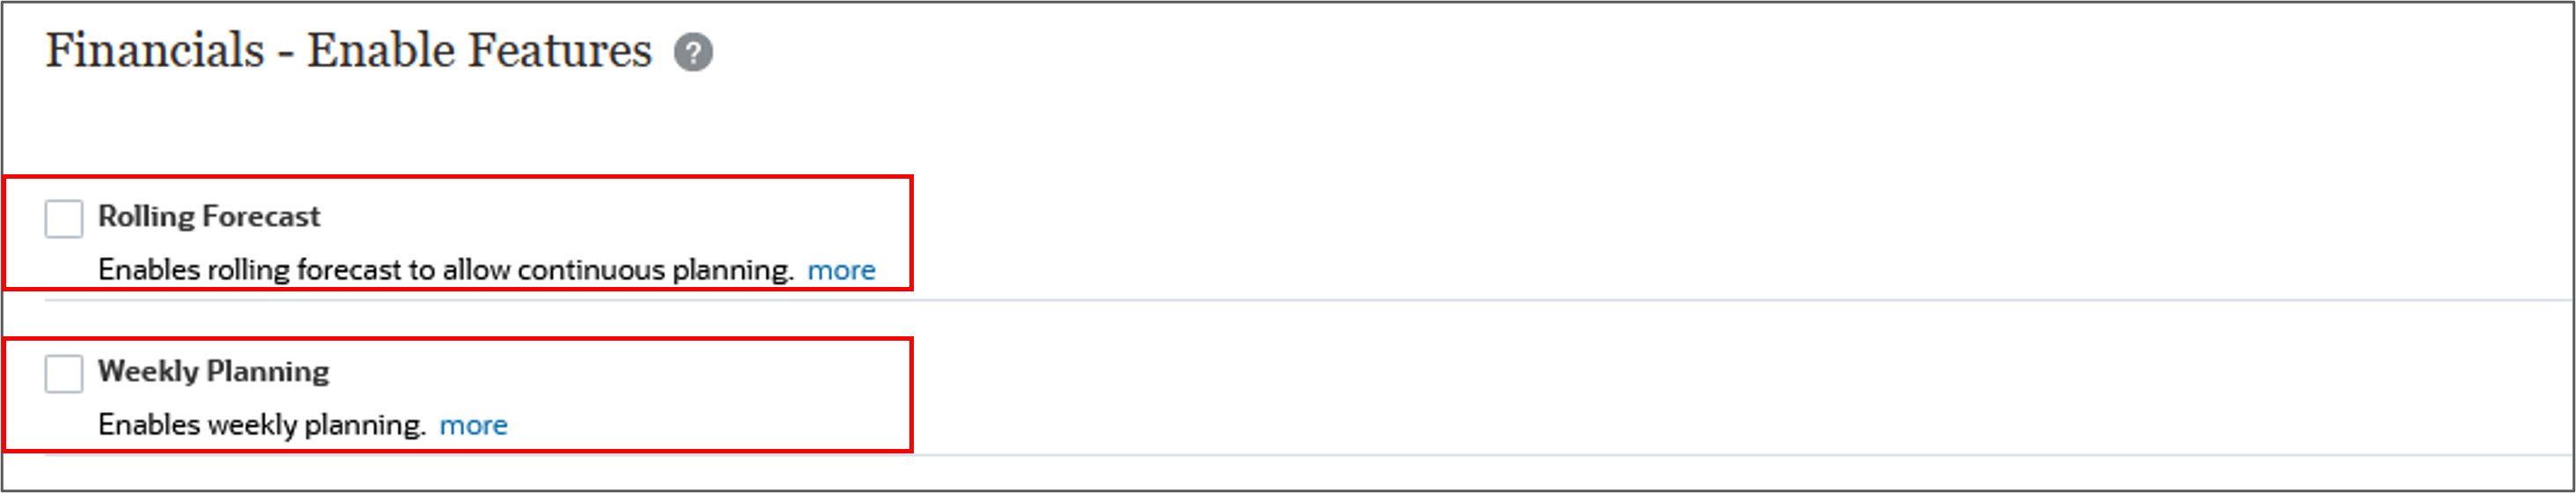
Note:
You can’t disable features later.Setting up time periods and granularity
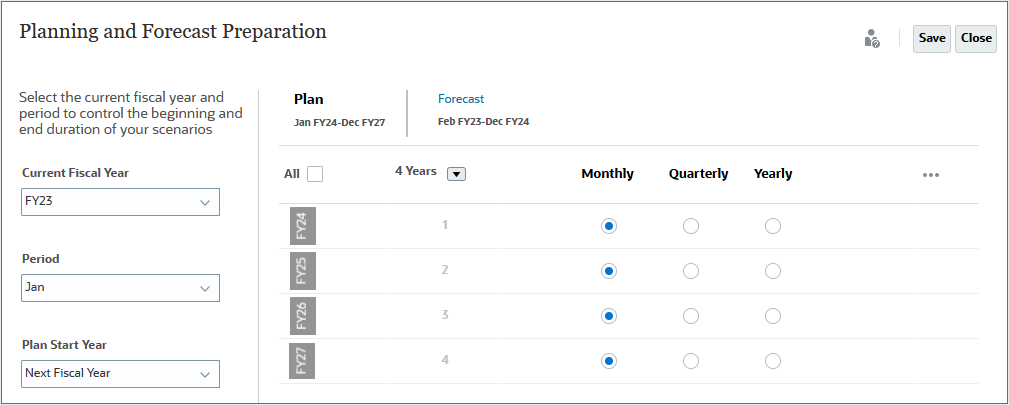
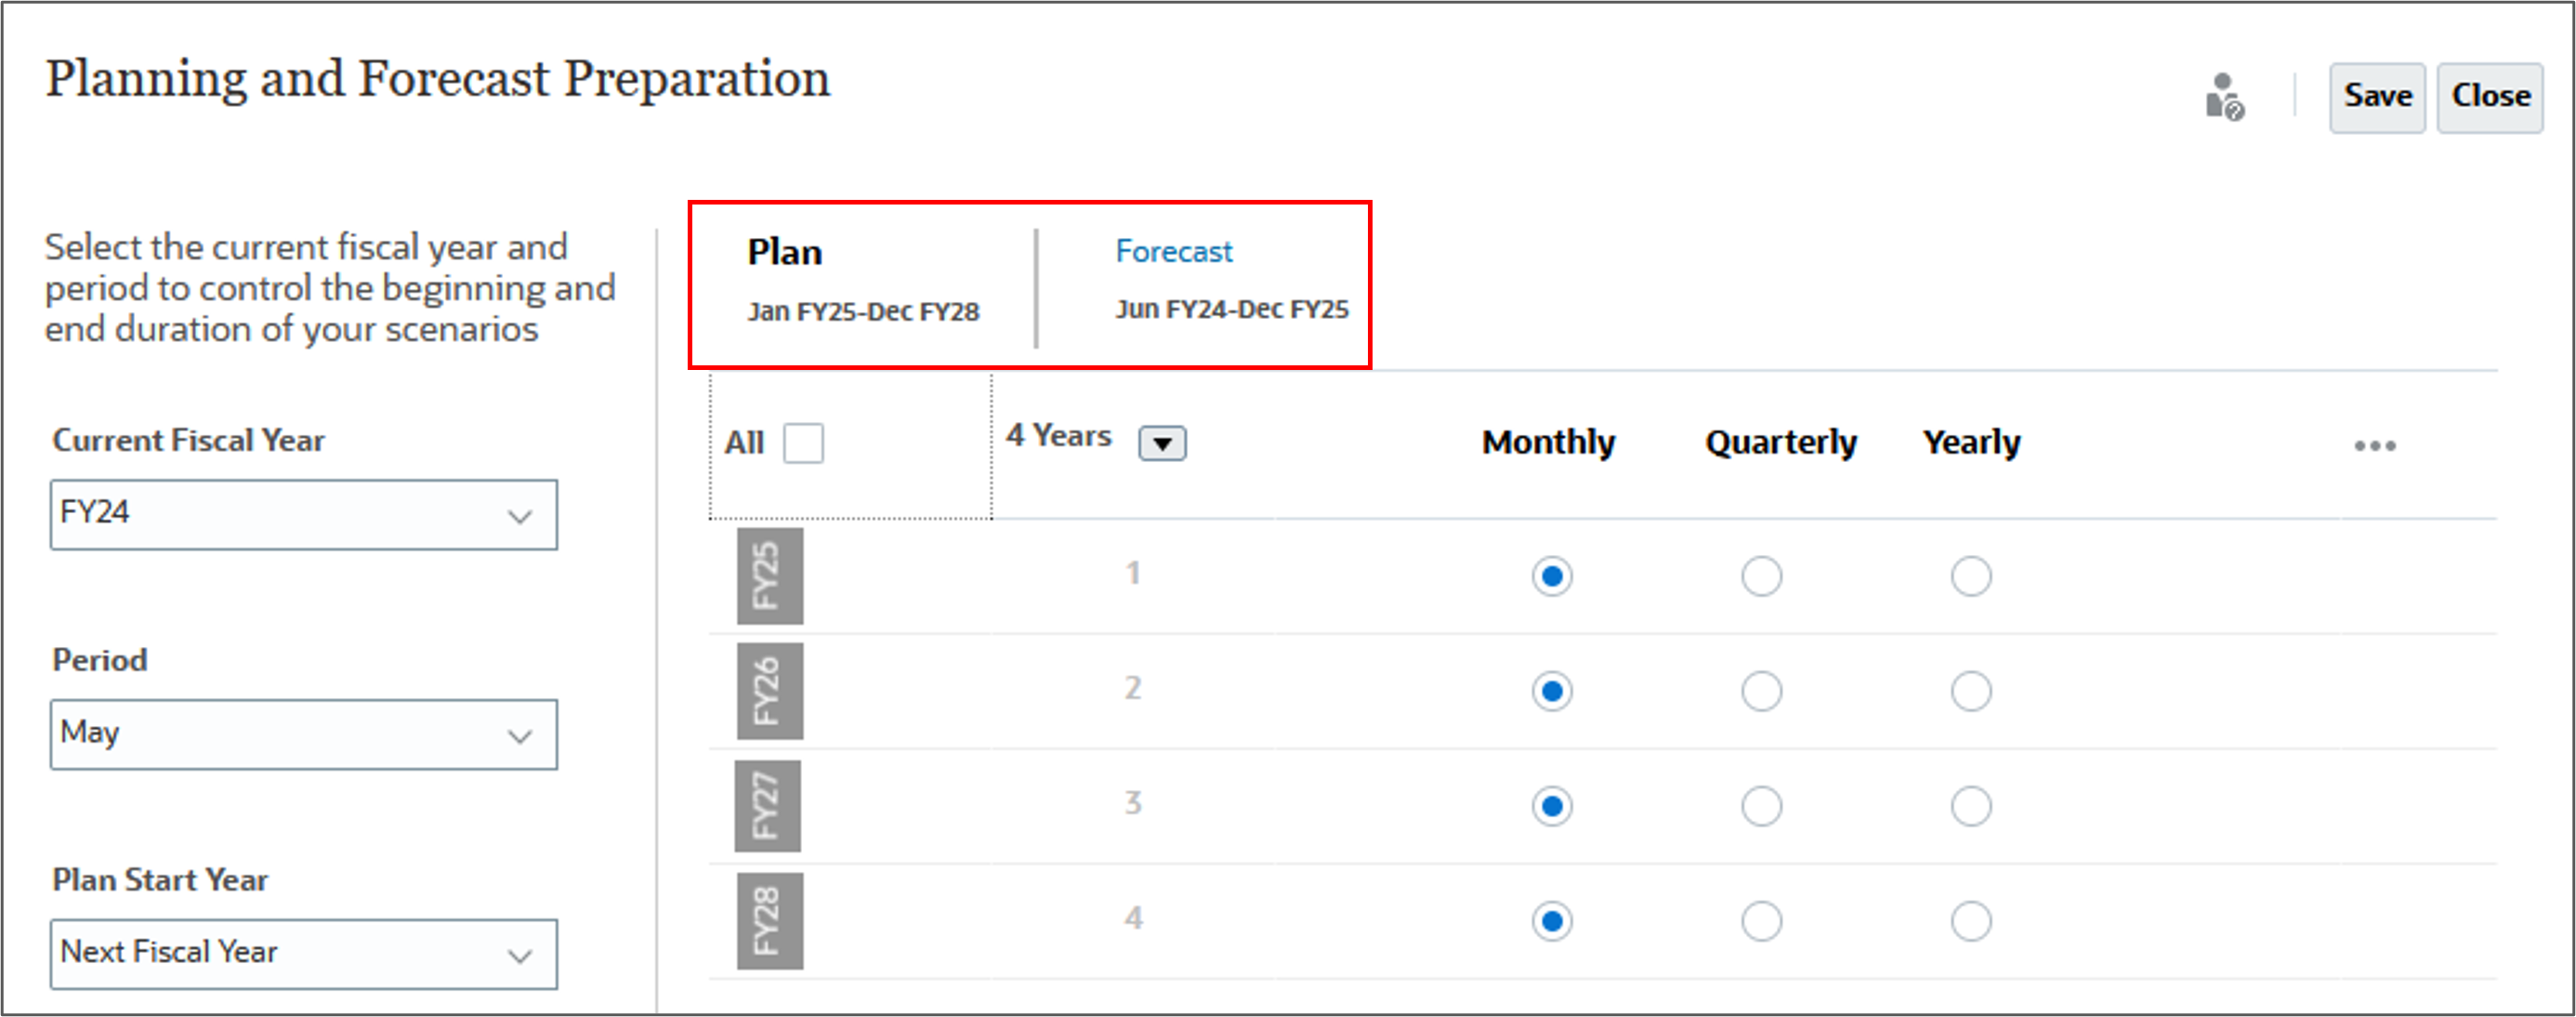
In Planning and Forecast Preparation, you select the current fiscal year, period (month), and plan start year to control the beginning and end duration of your scenarios. You also set the period granularity for the Plan, Forecast, and Rolling Forecast (if enabled) scenarios in your business process.
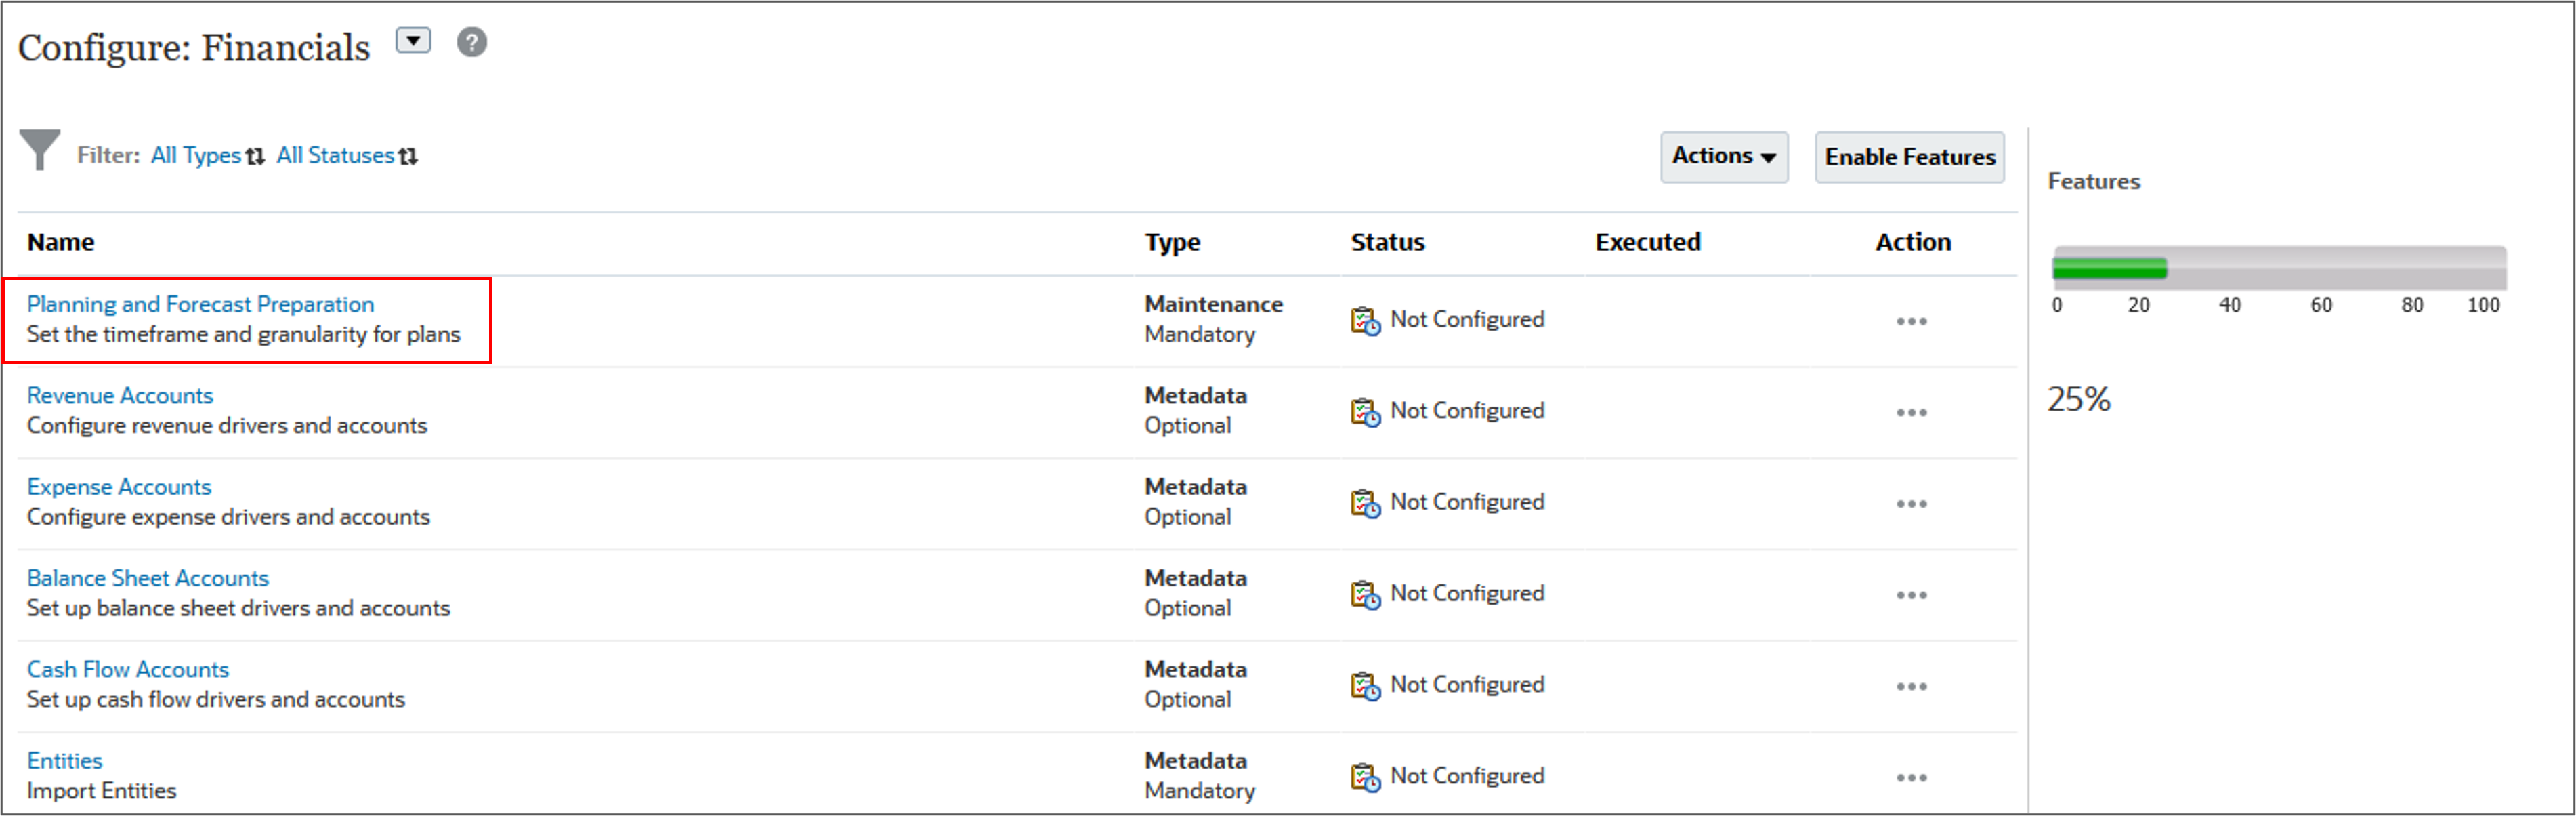
- On Configure: Financials, click Planning and Forecast Preparation.
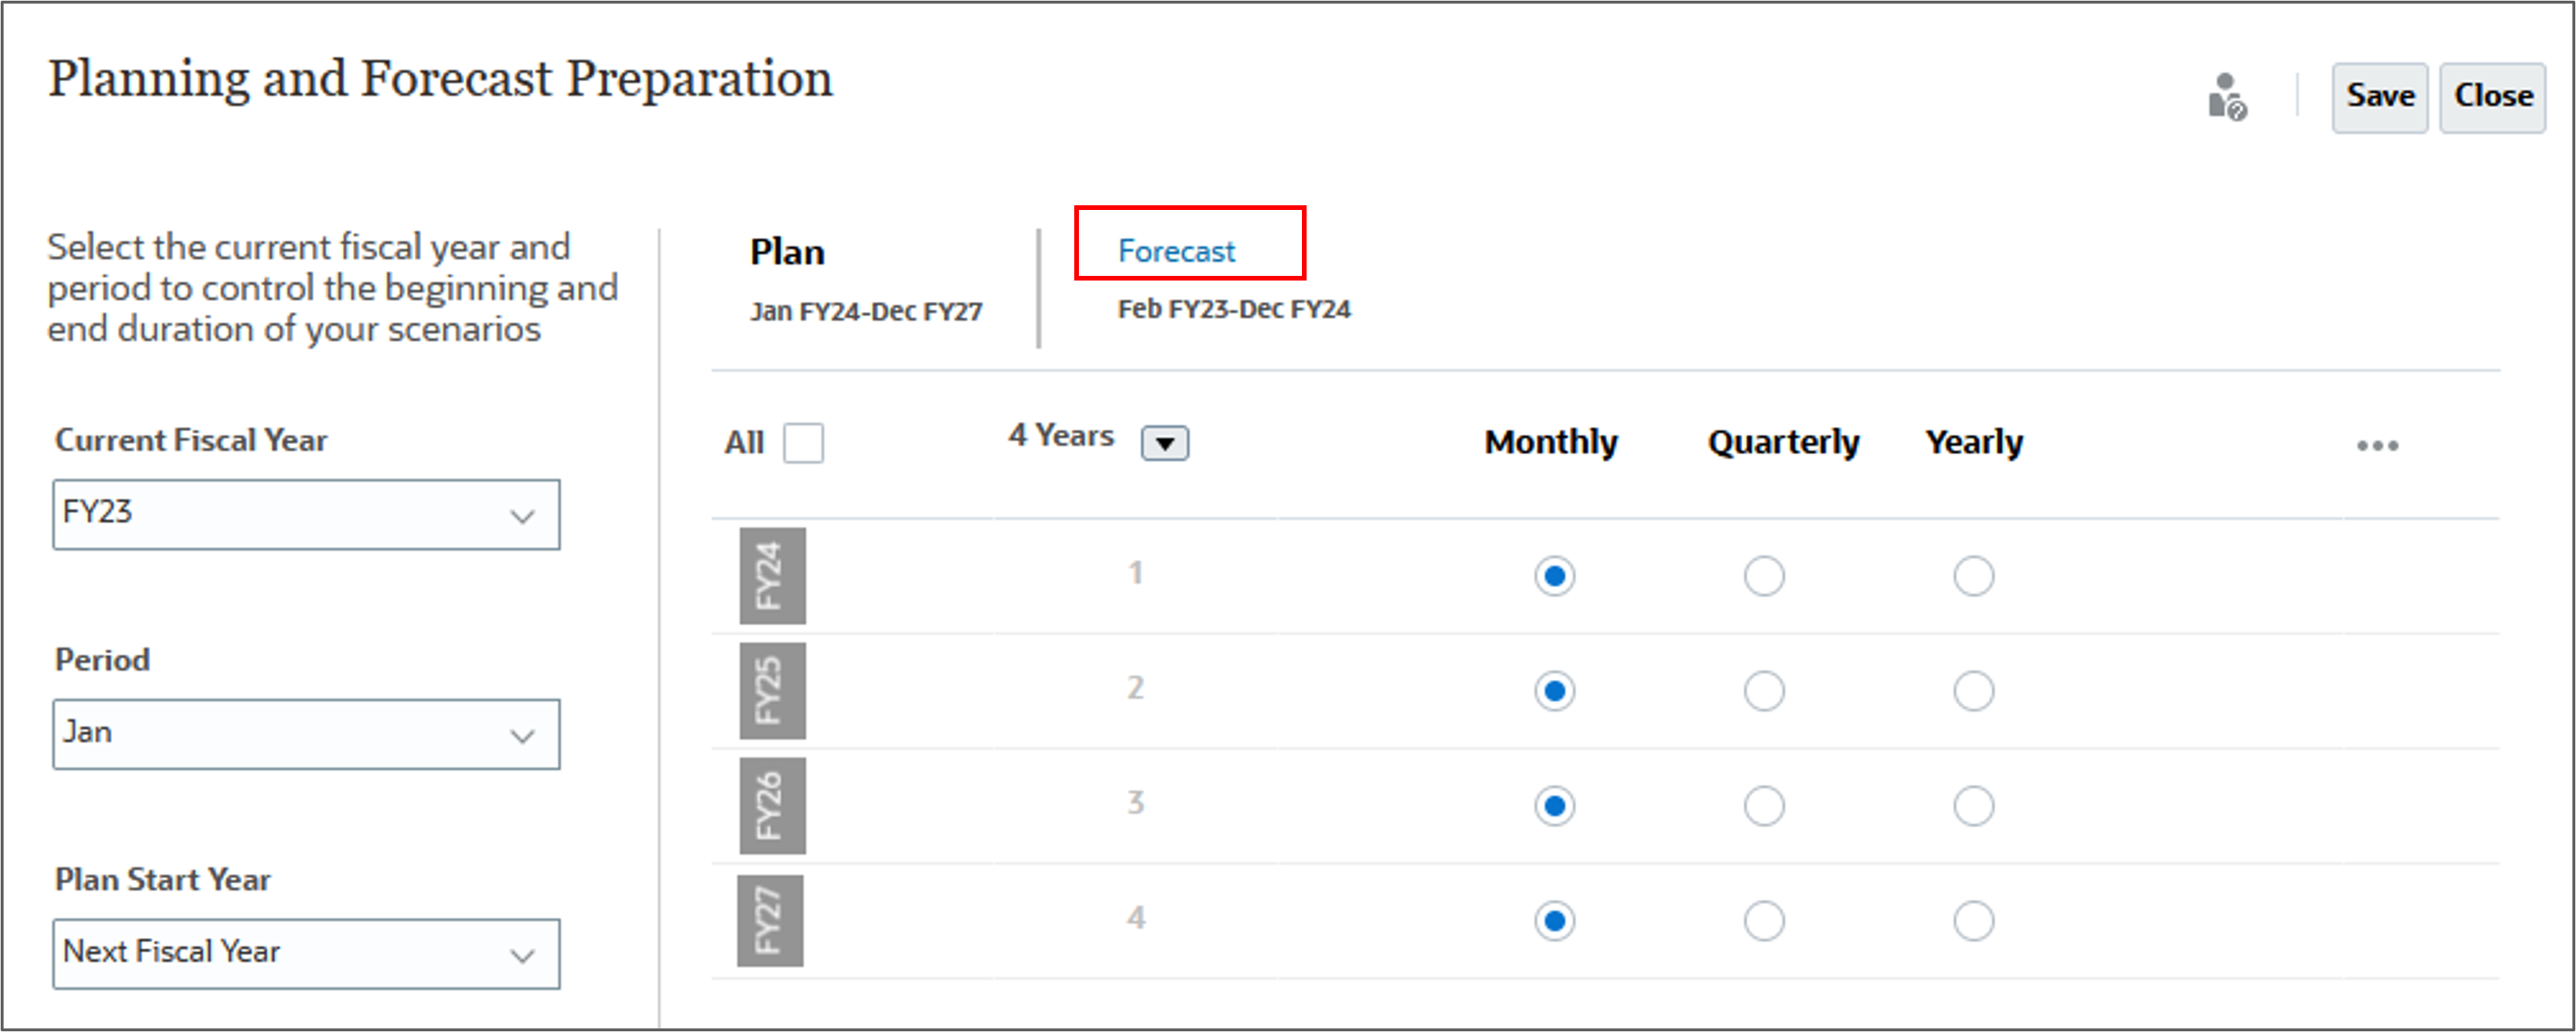
- Click Forecast.
- Click Plan.
- Click Close.
Notice the Current Fiscal Year is FY23, the current period is January, and the Plan Start Year is set to Next Fiscal Year.
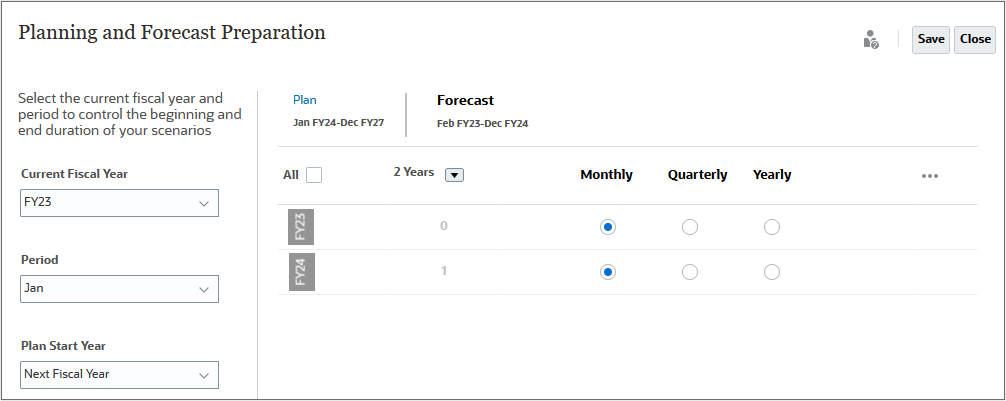
The Forecast starts in February FY23 and runs through December of FY24. The two year forecast is set on a monthly basis.
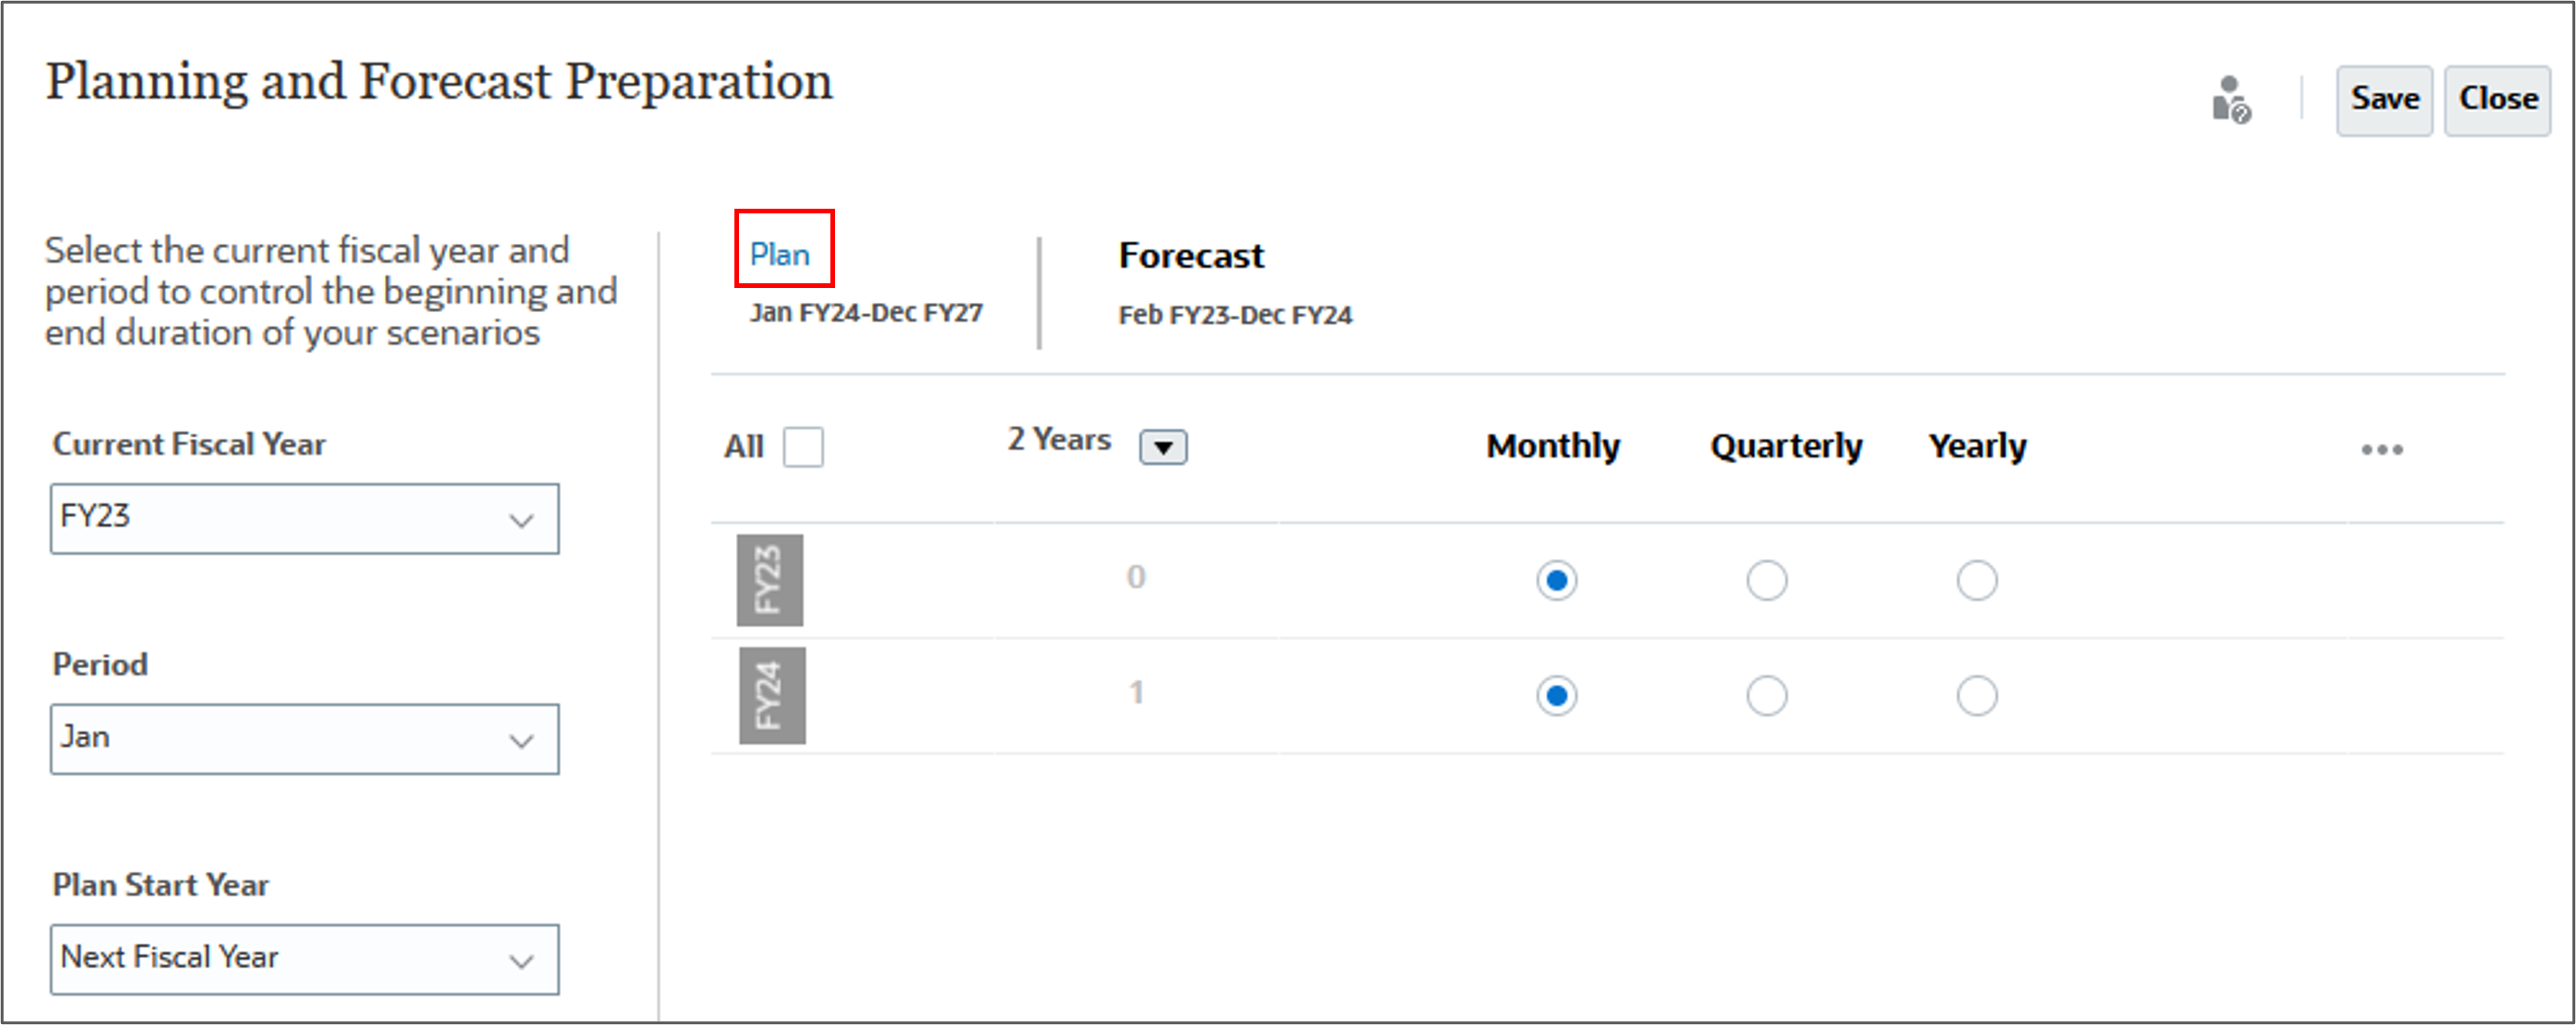
The four year Plan which runs from January FY24 through December of FY27, has each year's data planned on a monthly basis.

Selecting values for user variables
User Variables were added when the business process was created. User variables act as filters in forms, enabling planners to focus only on certain members. In this section, you set values for users values.
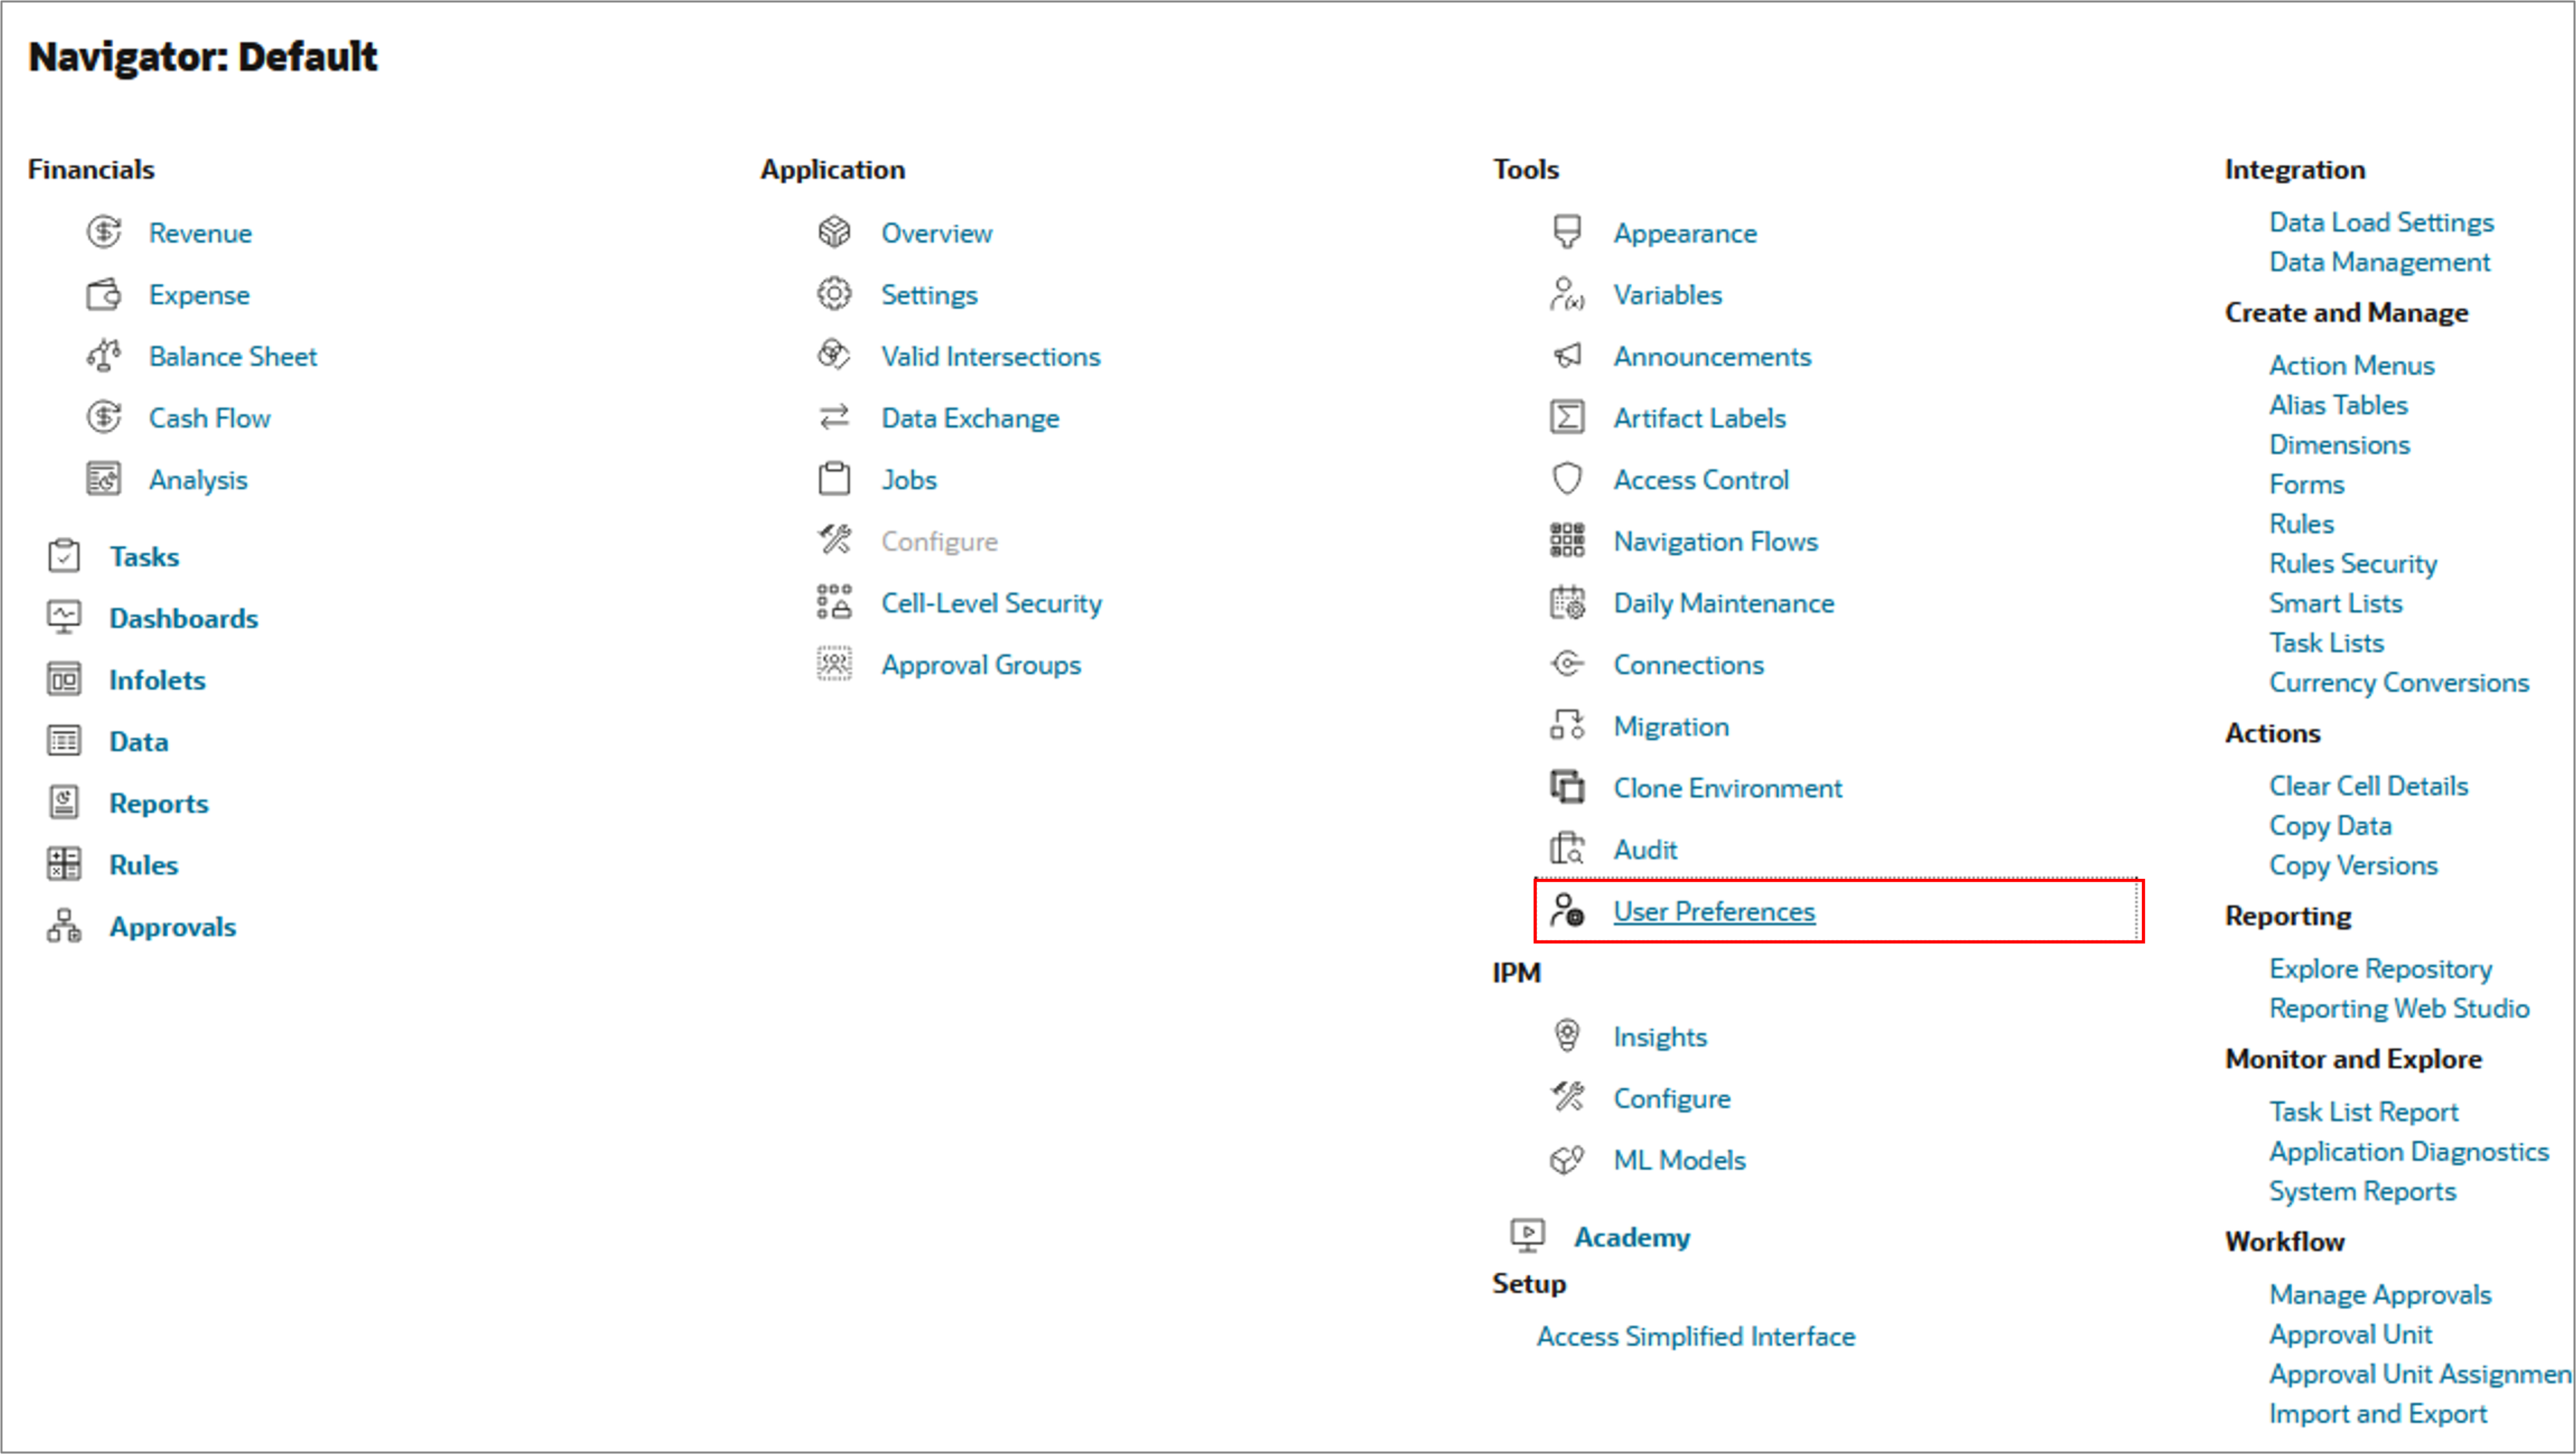
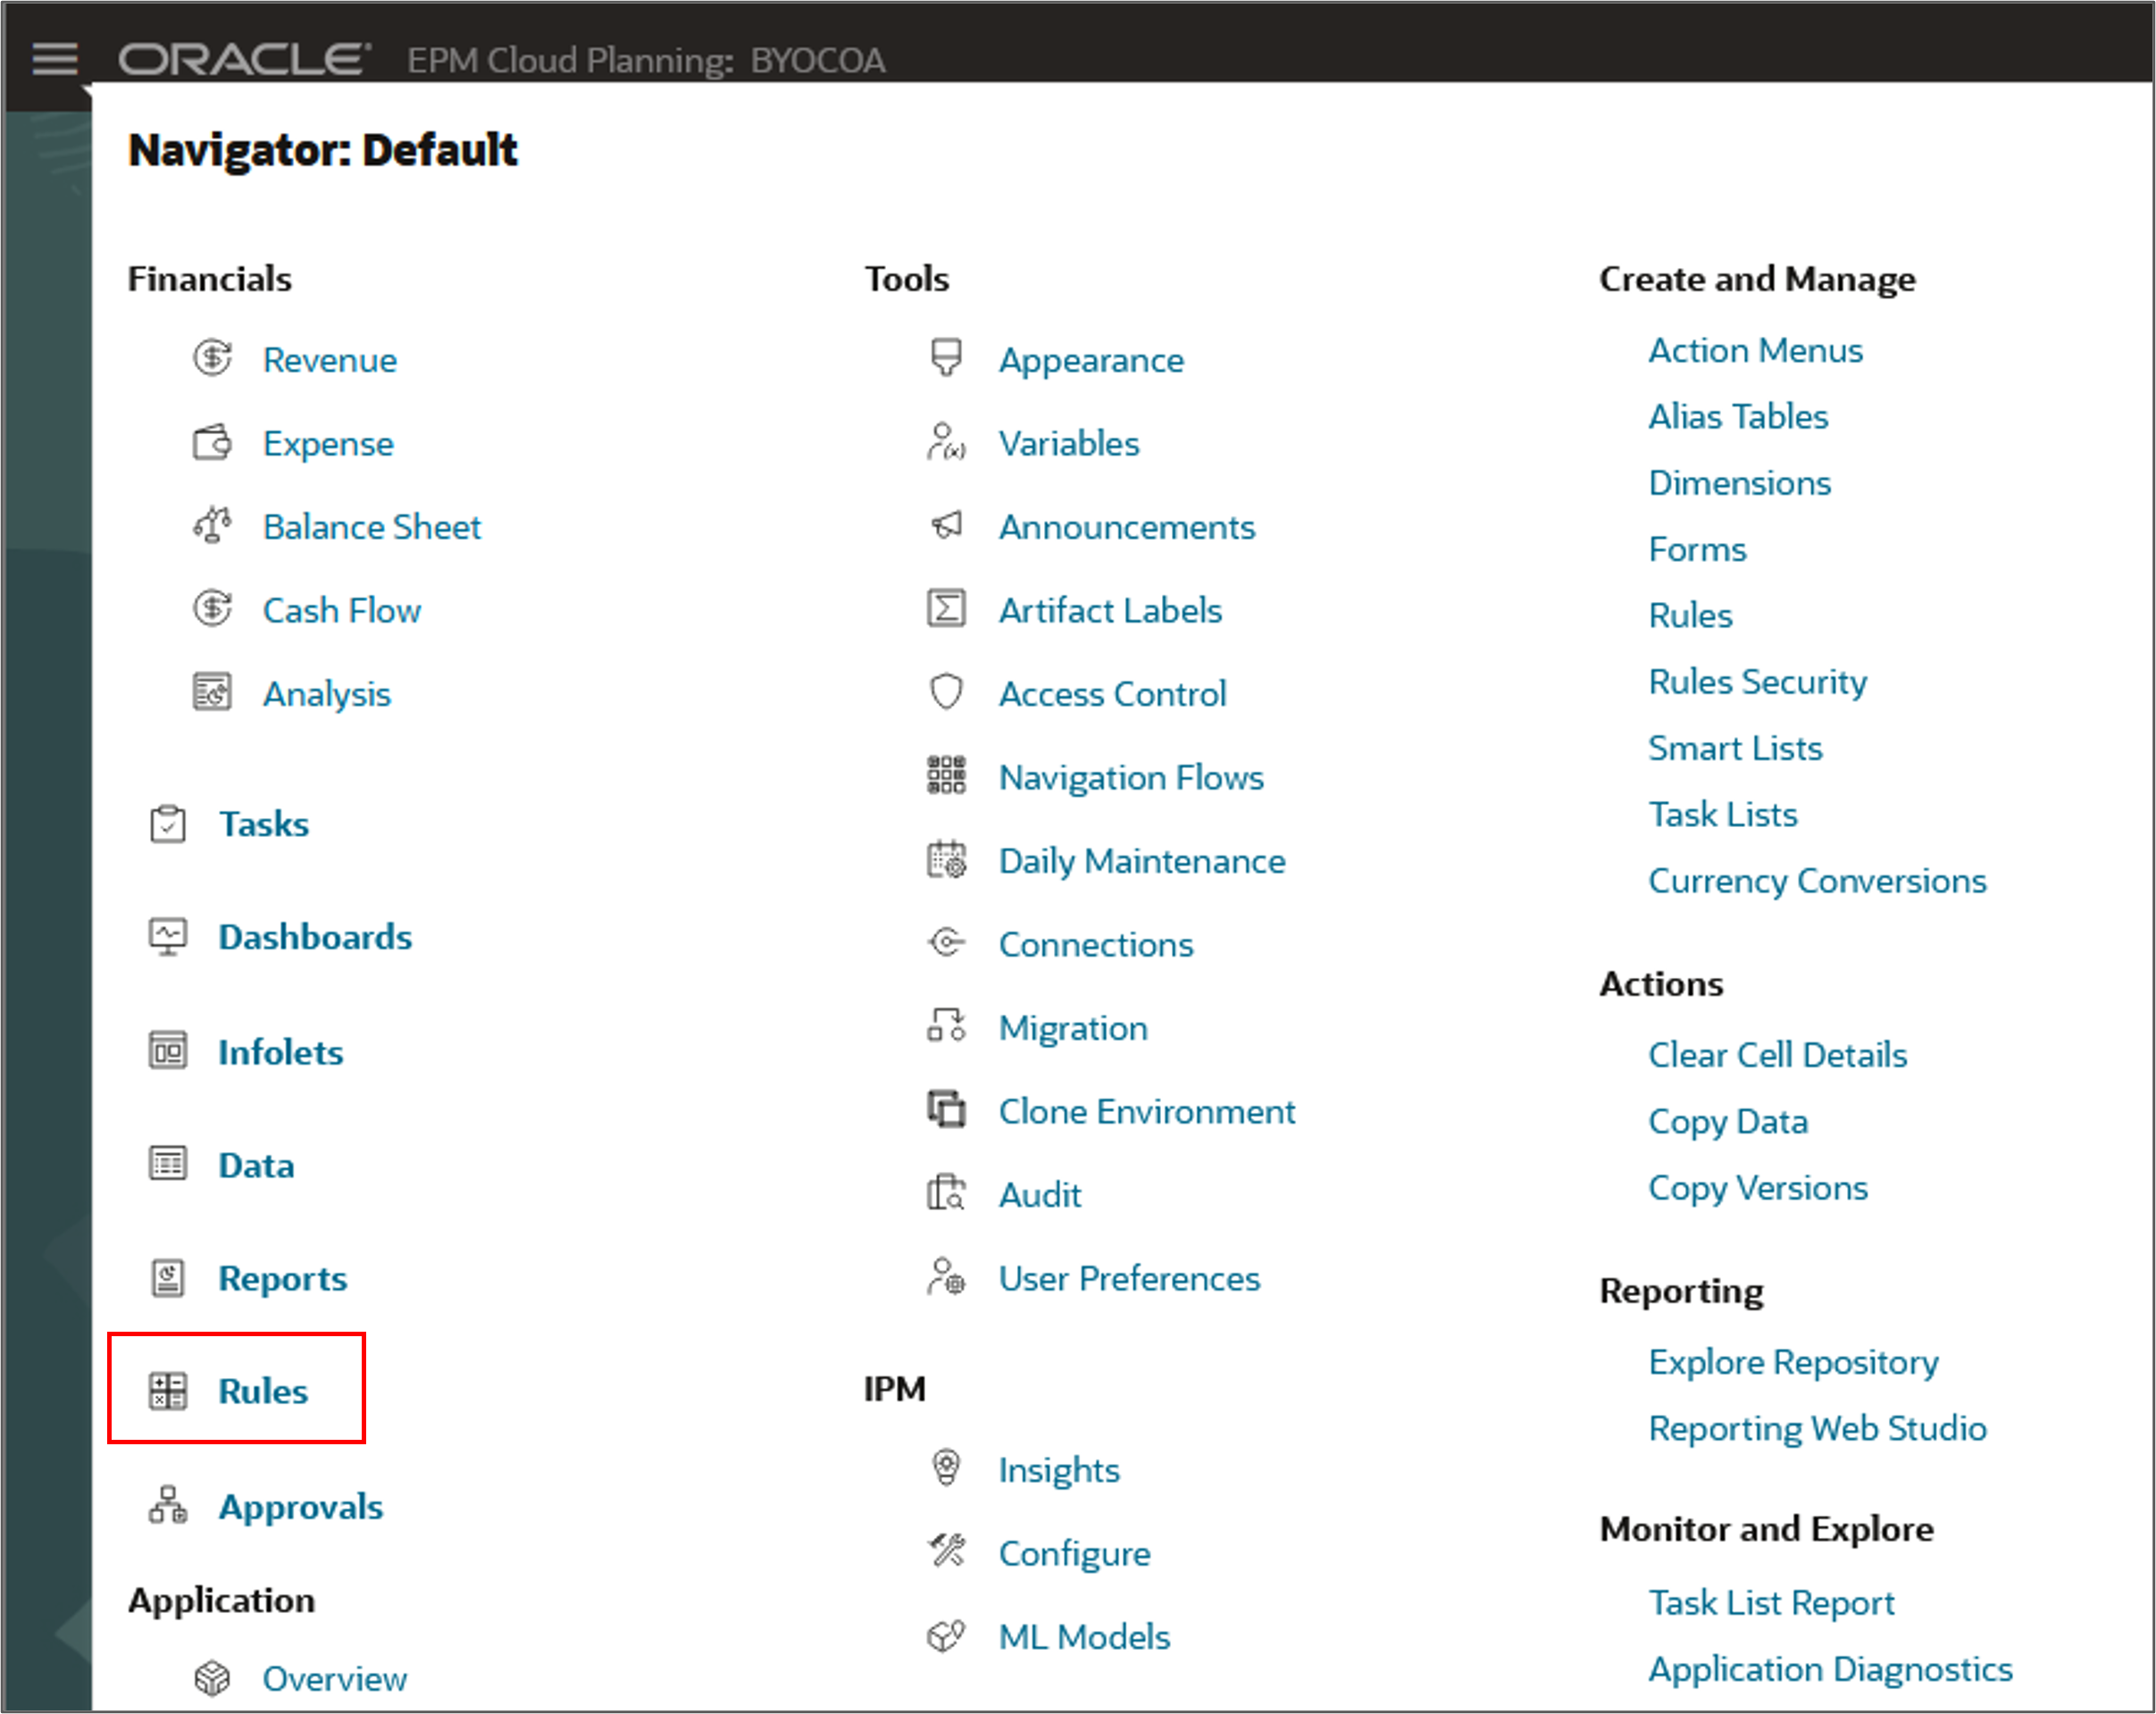
- Click
 (Navigator), and under Tools, select User Preferences.
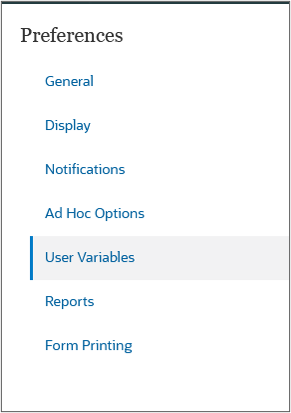
 - Click User Variables.
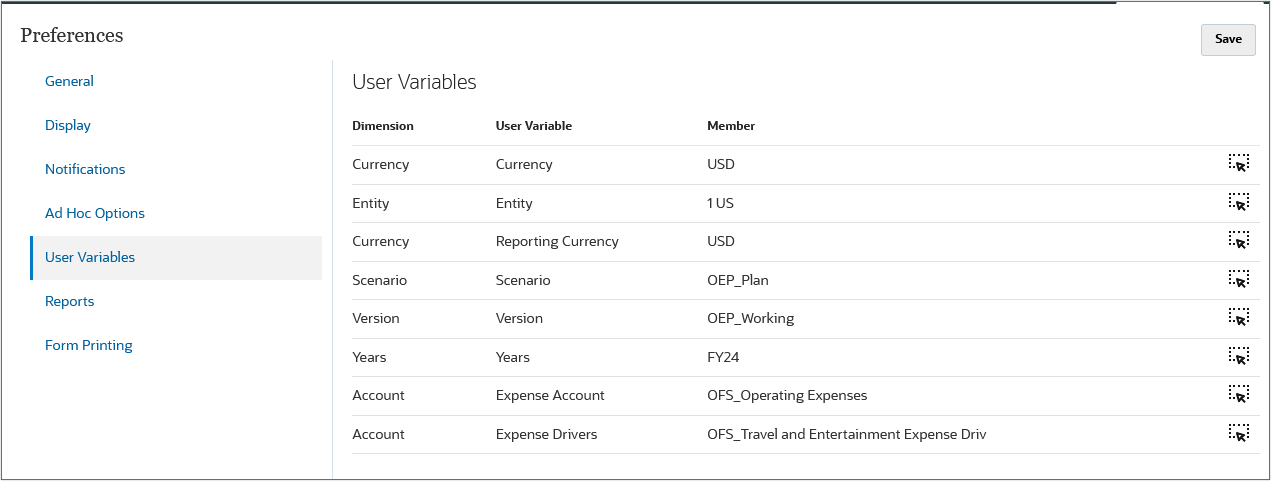
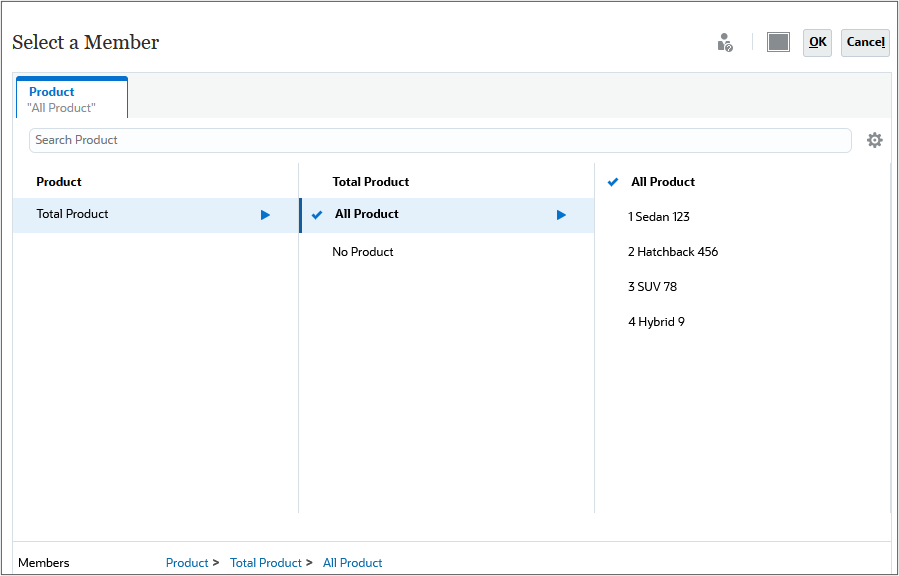
- For each variable click
 (Select Member) to set the variable's value as specified below:
- Currency: USD
- Entity: 1 US
- Reporting Currency: USD
- Scenario: OEP_Plan
- Version: OEP_Working
- Years: FY24
- Expense Account: OFS_Operating Expenses
- Expense Drivers: OFS_Travel and Entertainment Expense Drivers
- Click Save.
- At the information message, click OK.
- Click
 (Home).
Reviewing data in forms
In this section, you review revenue data.
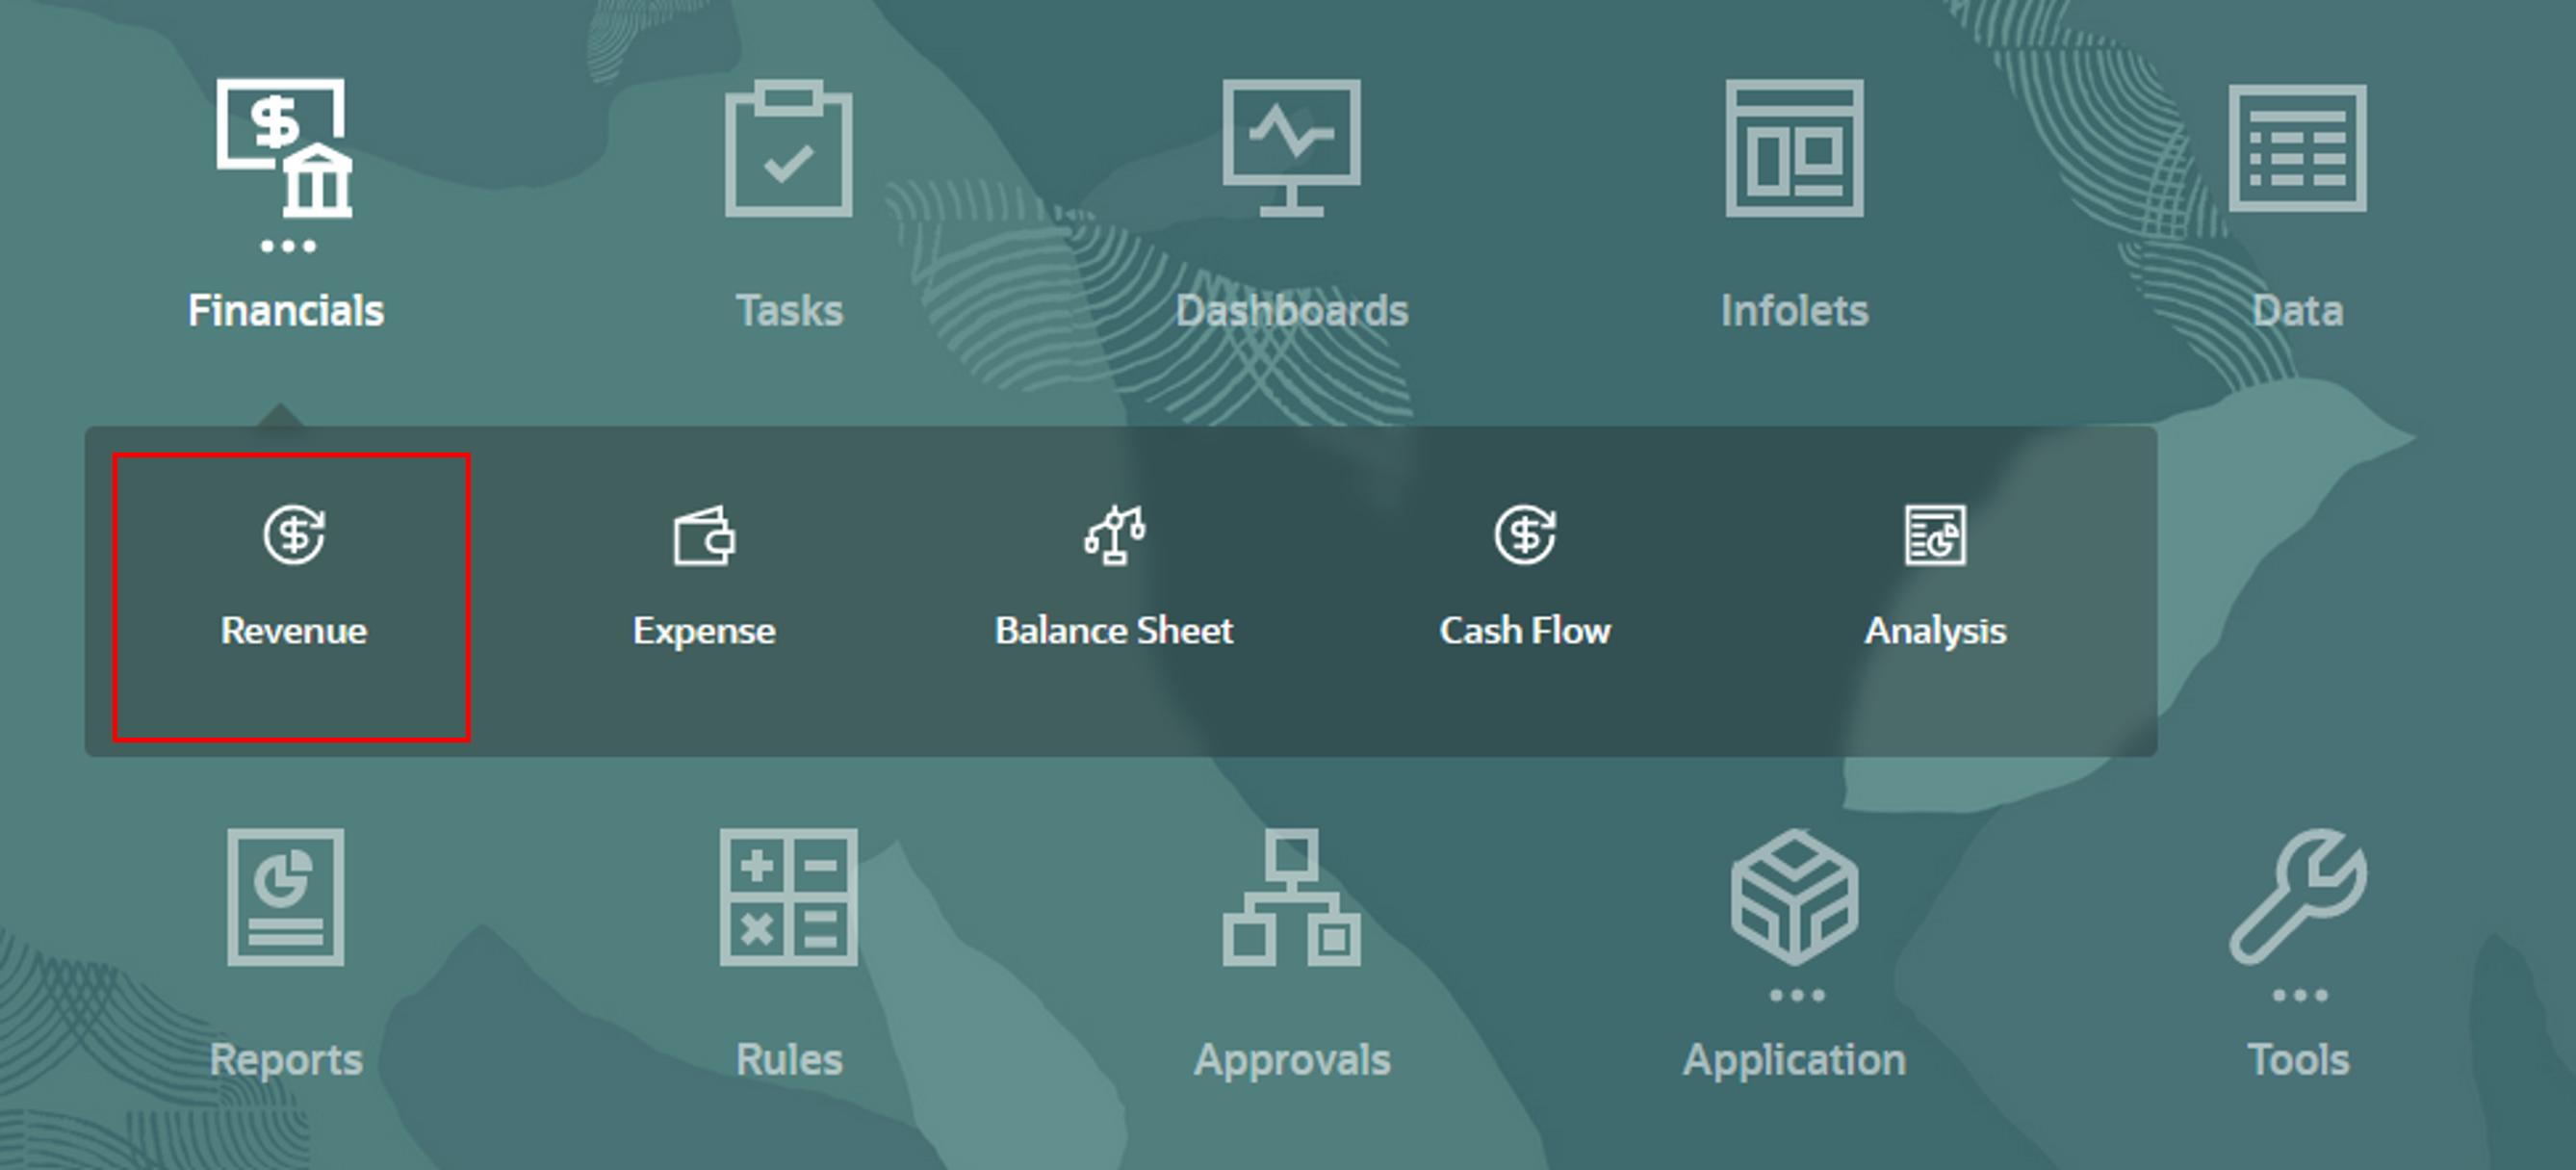
- On the Planning home page, click Financials, then Revenue.
- On the left, select the Driver and Trend Based vertical tab and select the Trend Based Revenue Planning horizontal tab.
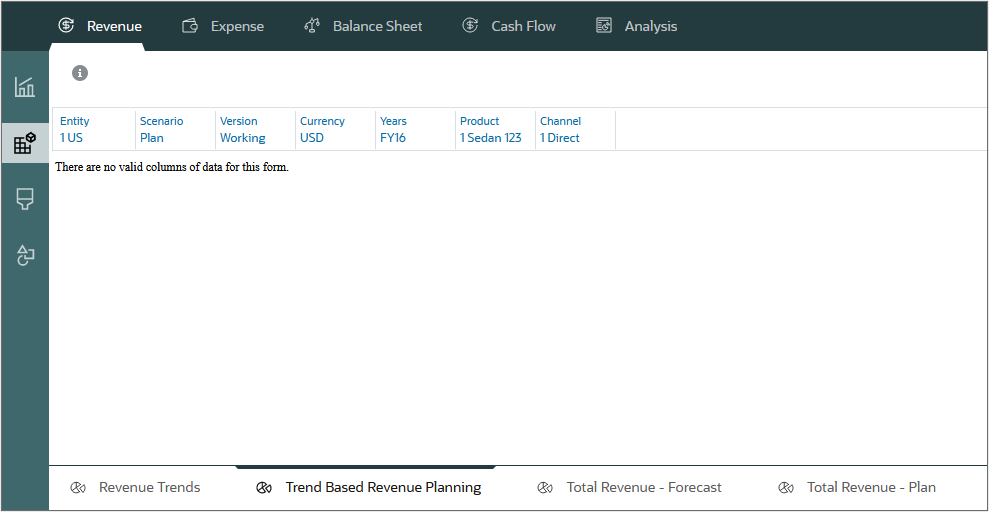
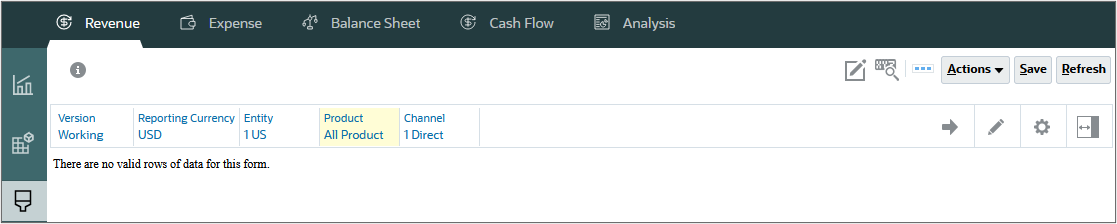
- Click (Home).
No data is displayed. Data needs to be loaded.
Loading and calculating actuals
By accessing and analyzing historical and current data, you can create planning targets and forecast more accurately. Actuals can contain accumulated historical data and market conditions that help predict financial outcomes for future months and years. Actual financial statements can be used to calculate variances or errors against plans.
Loading historical revenue data
In this section, you load actual revenue data to create a basis for your forecasts.
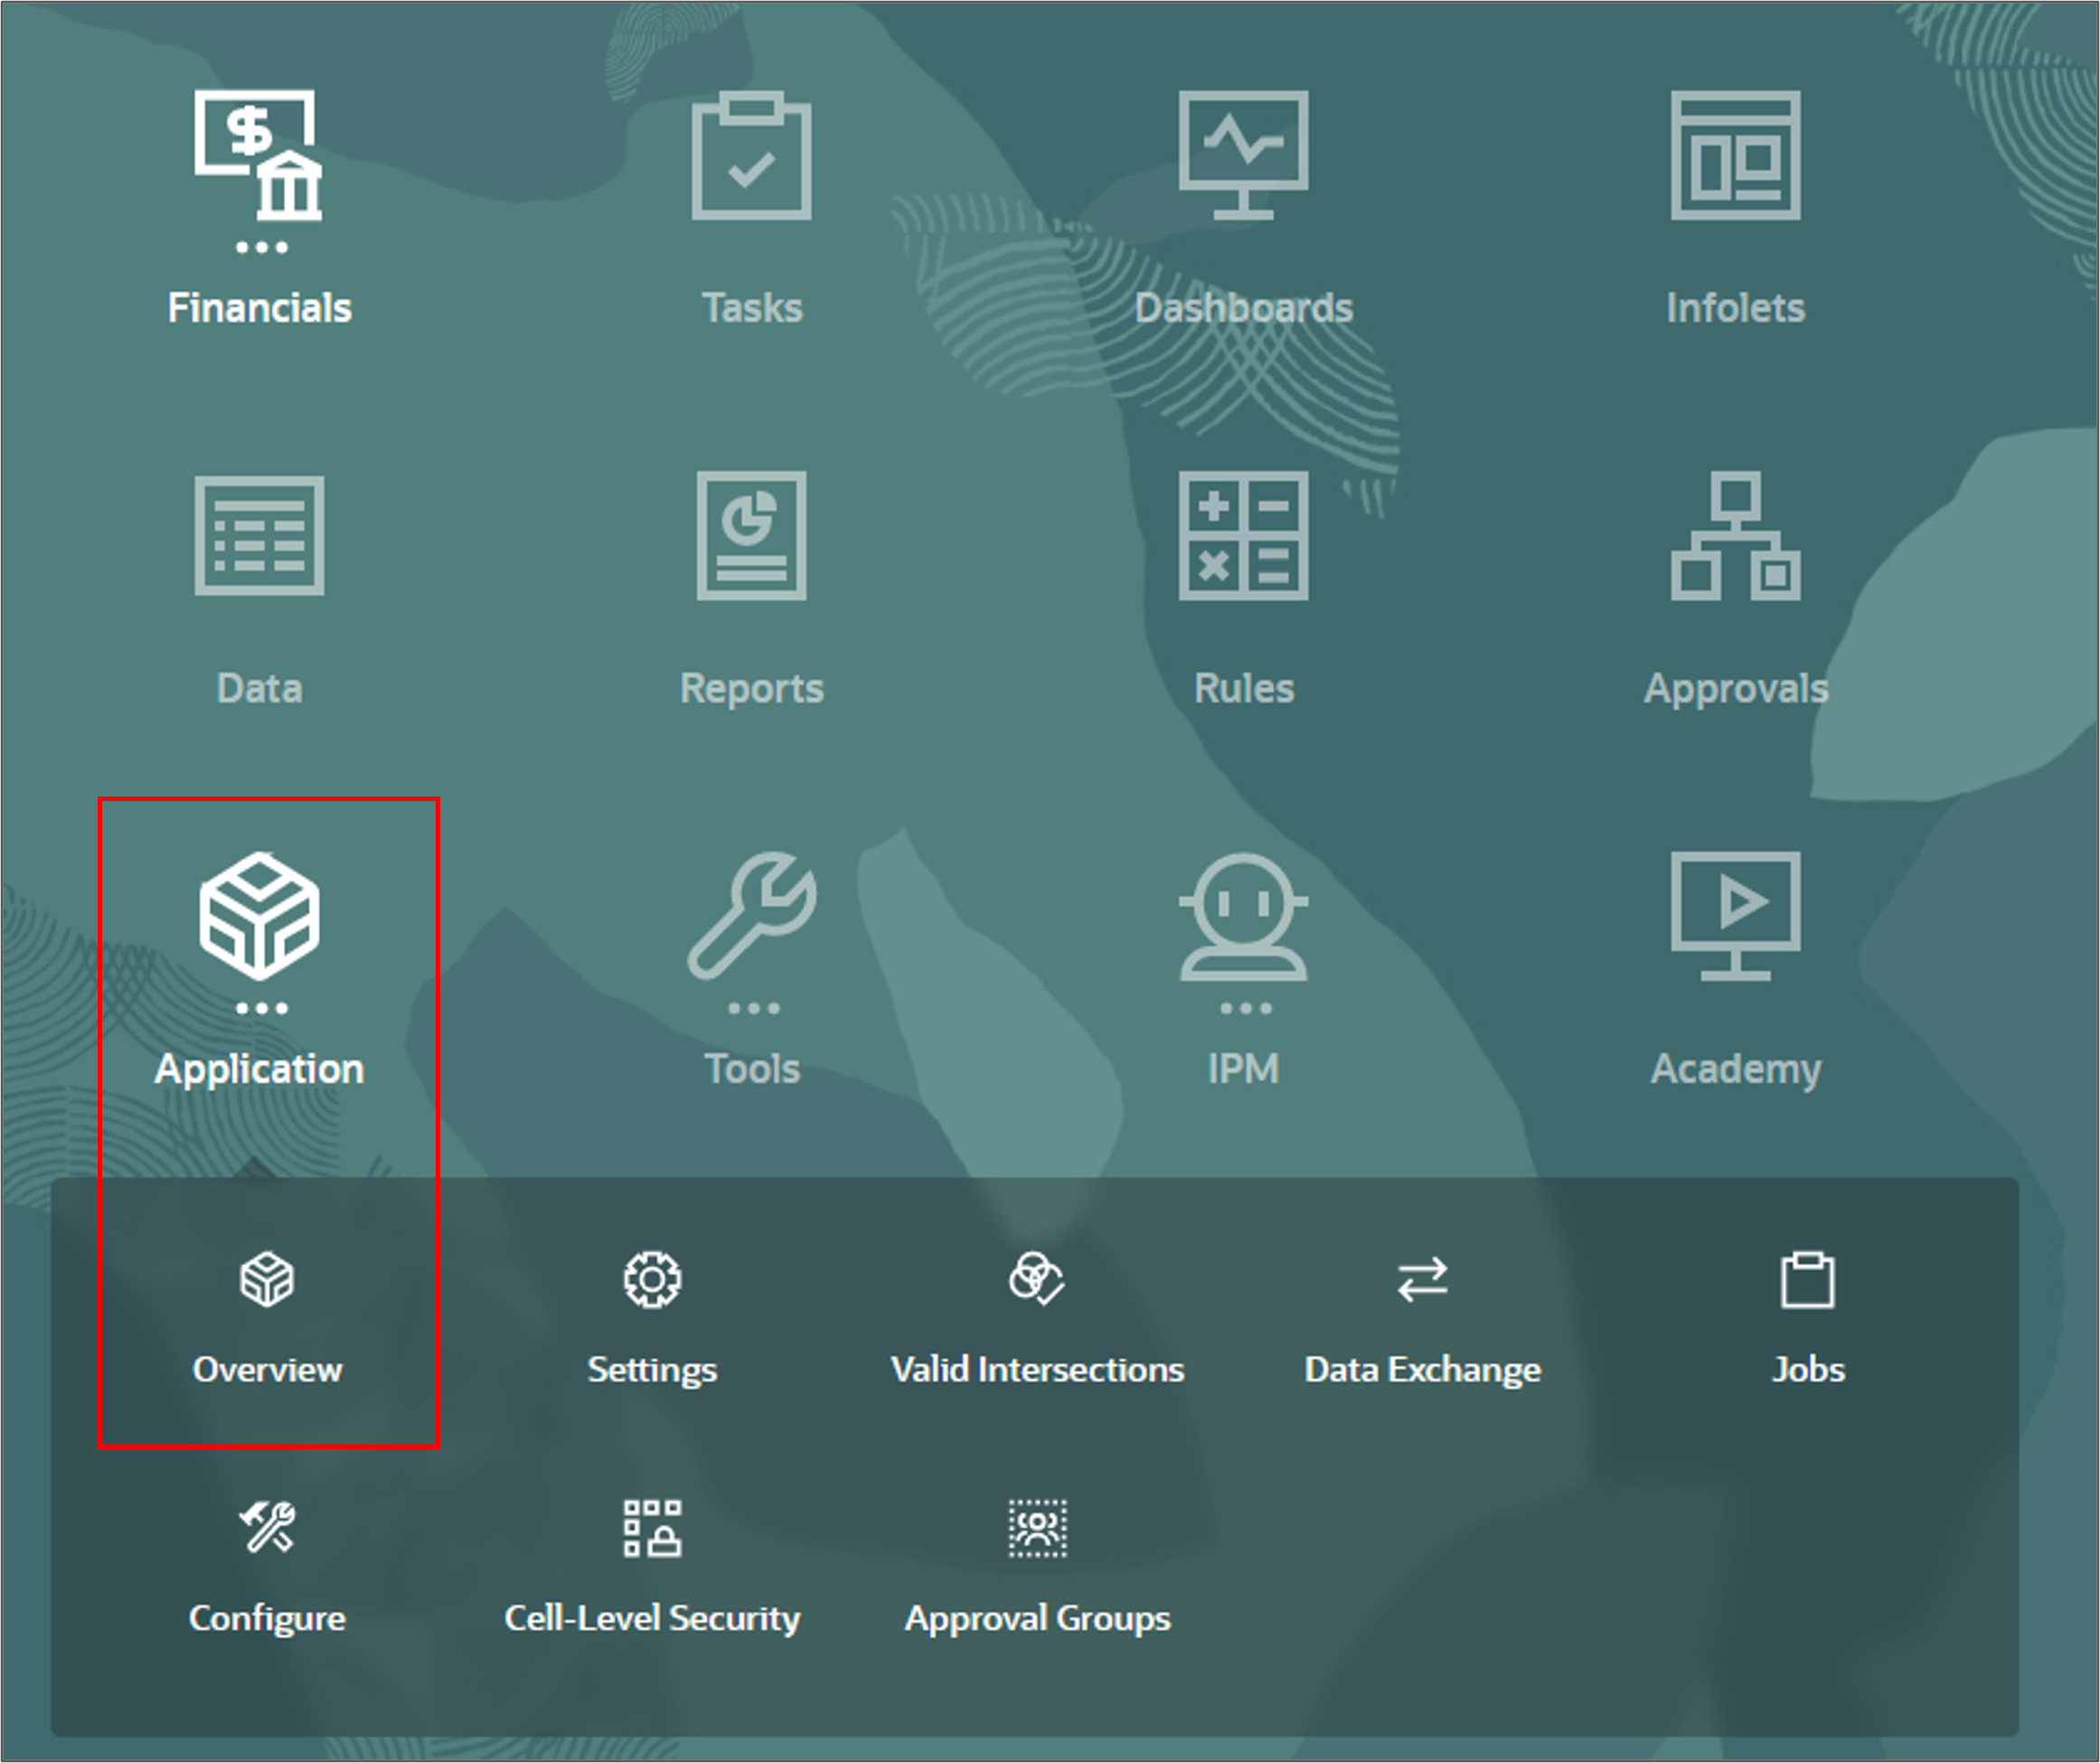
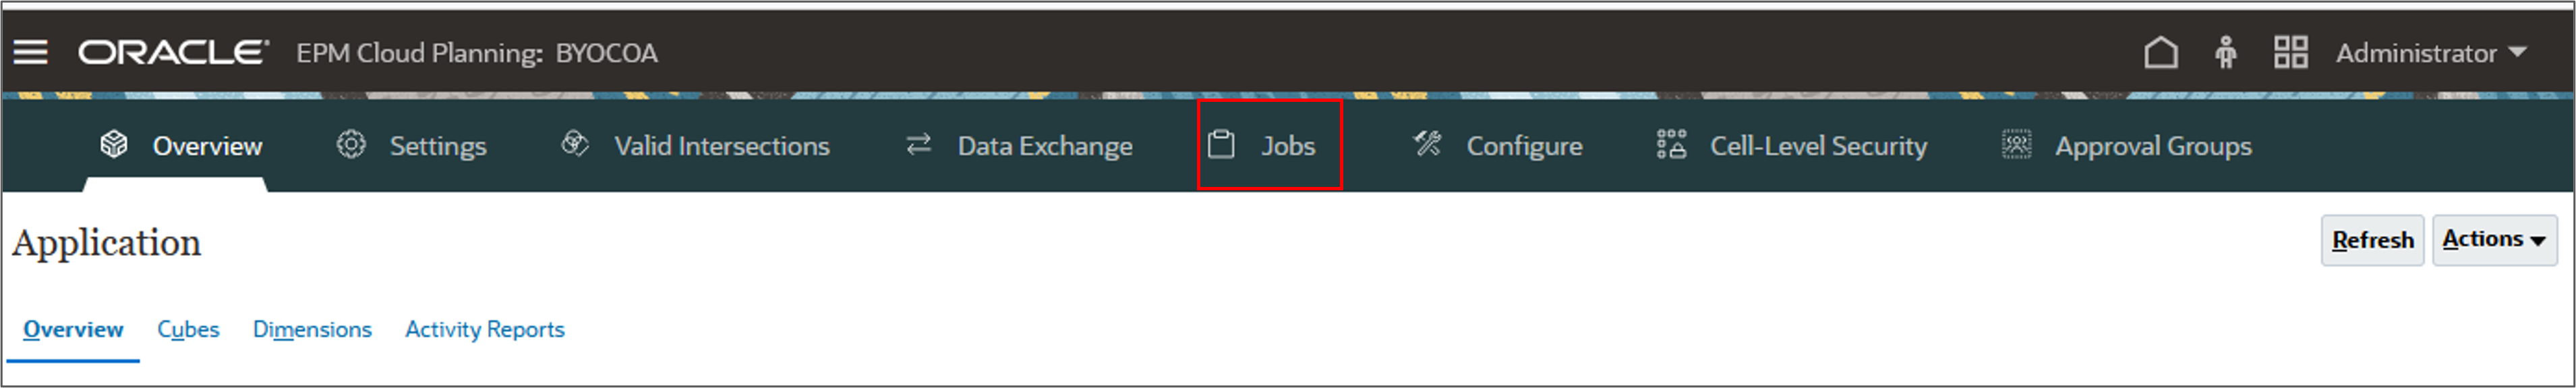
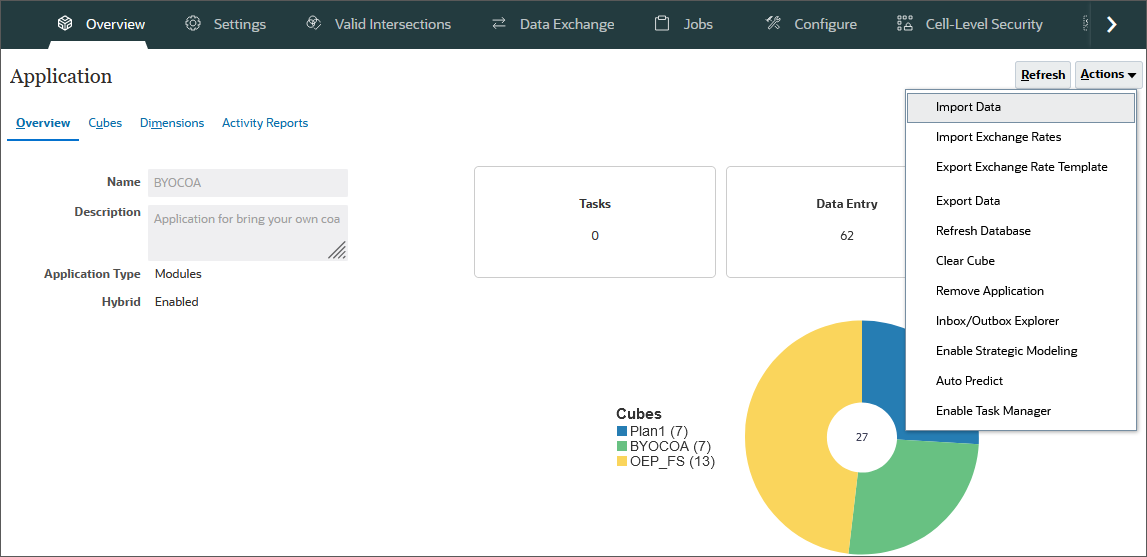
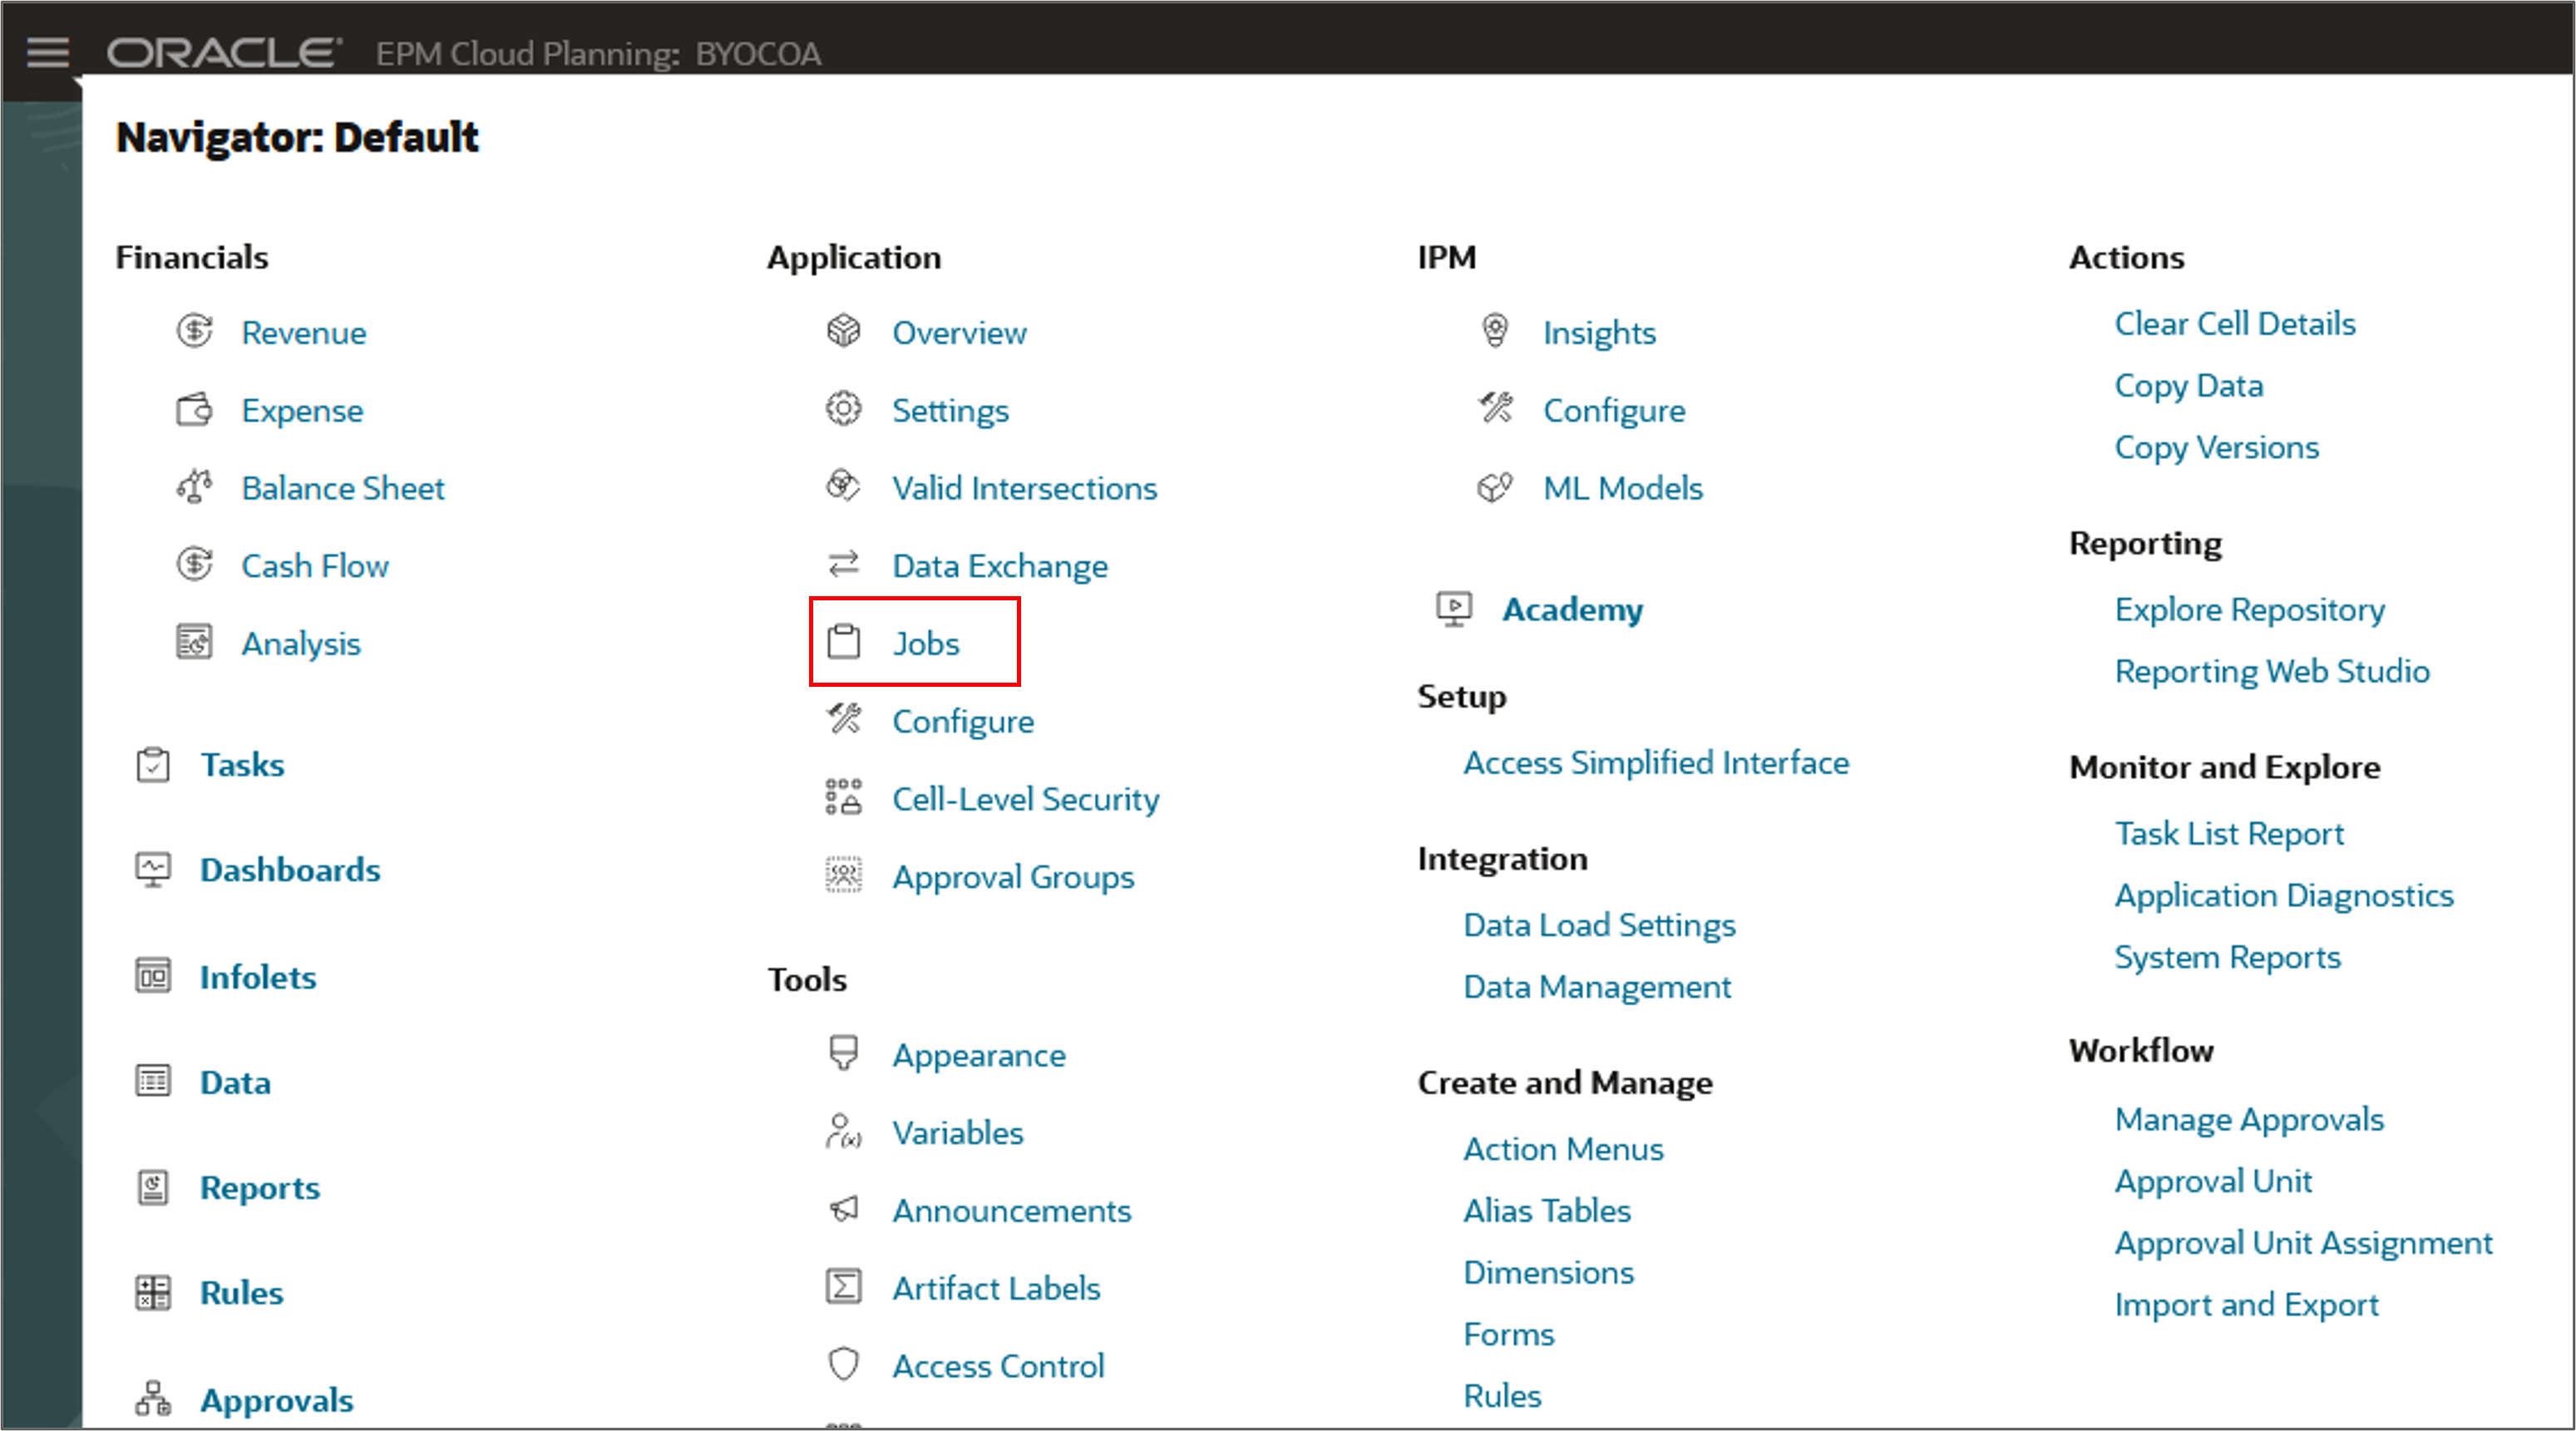
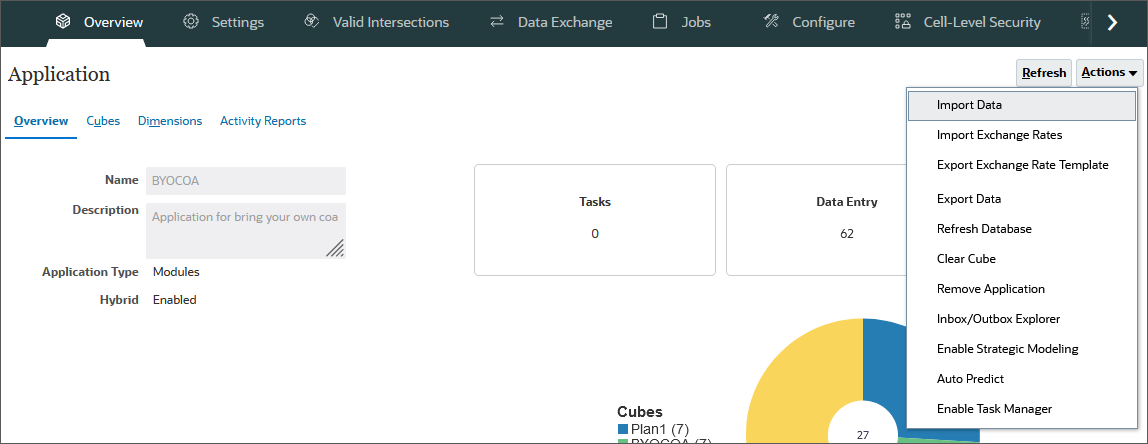
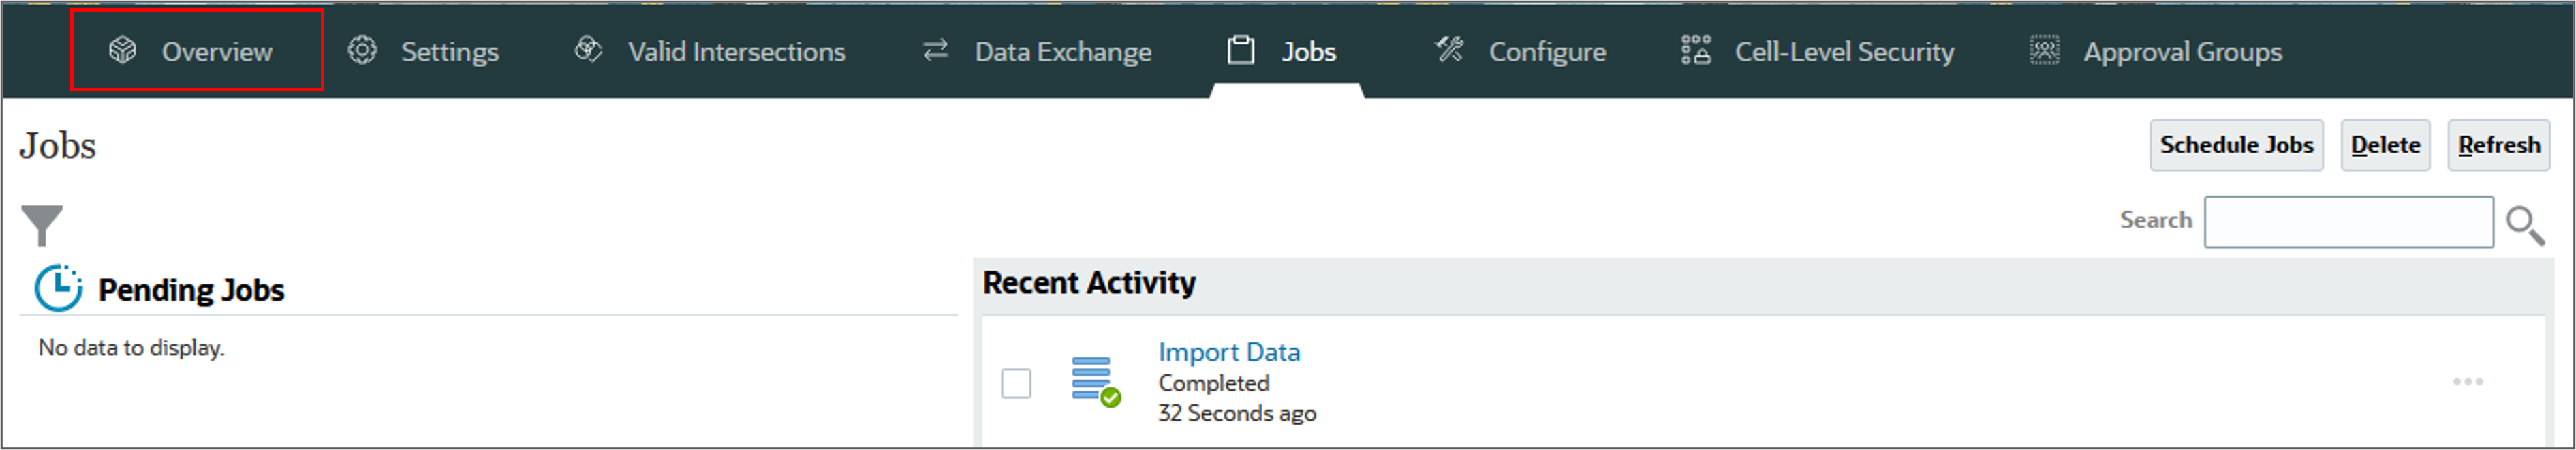
- On the Planning home page, click Application, then Overview.
- On the Application page, click Actions, and select Import Data.
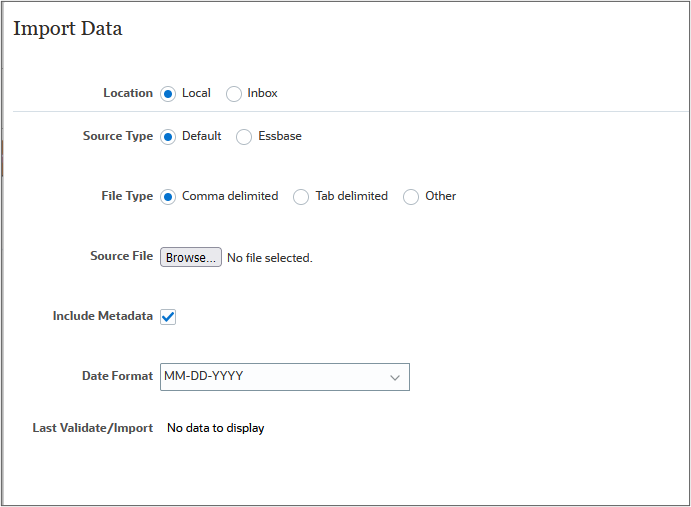
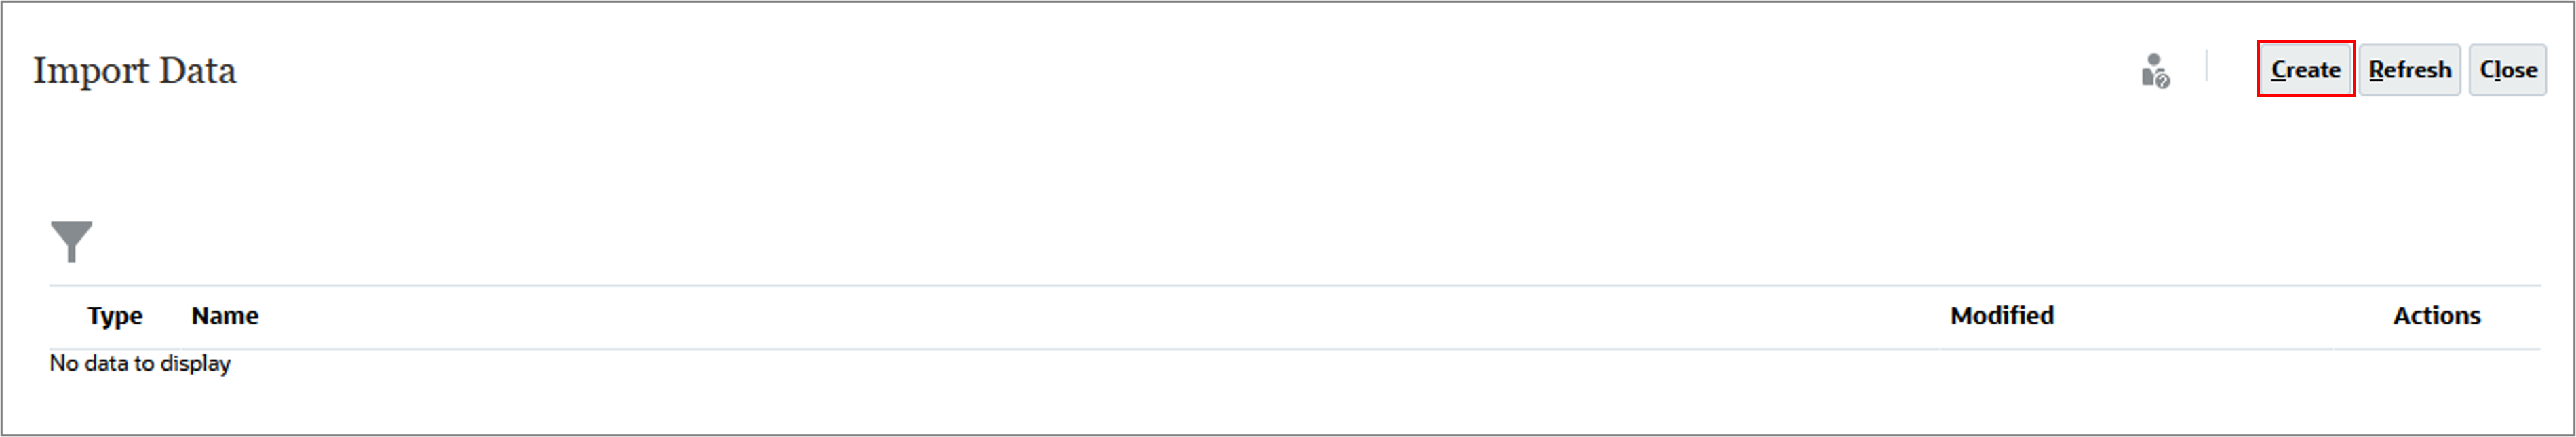
- In Import Data, click Create.
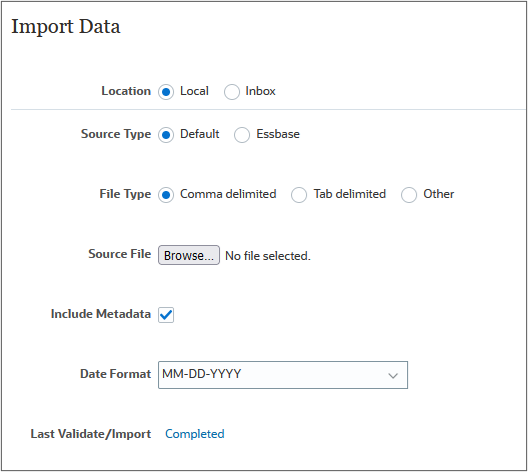
- Keep all the default selections, and select Include Metadata. Click Browse to select a file.
- Locate and select Revenue_Data FY23.csv, and click Open.
- Click Import.
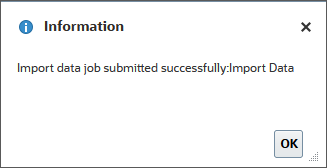
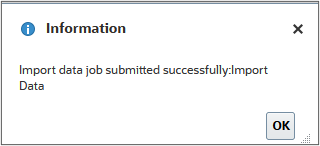
- At the information dialog, click OK.
- Click Close twice.
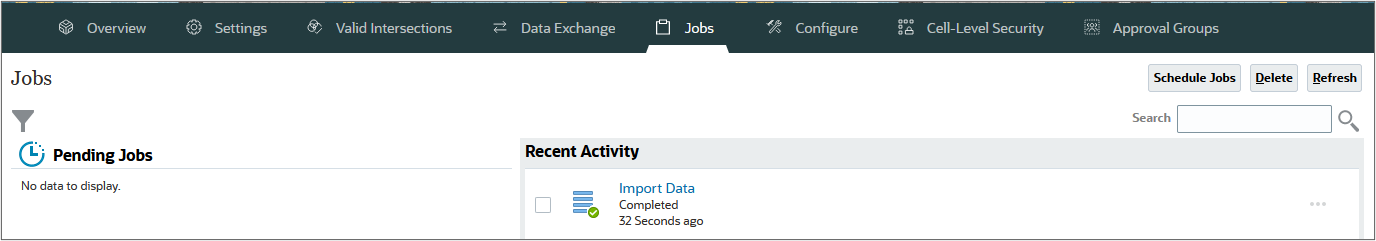
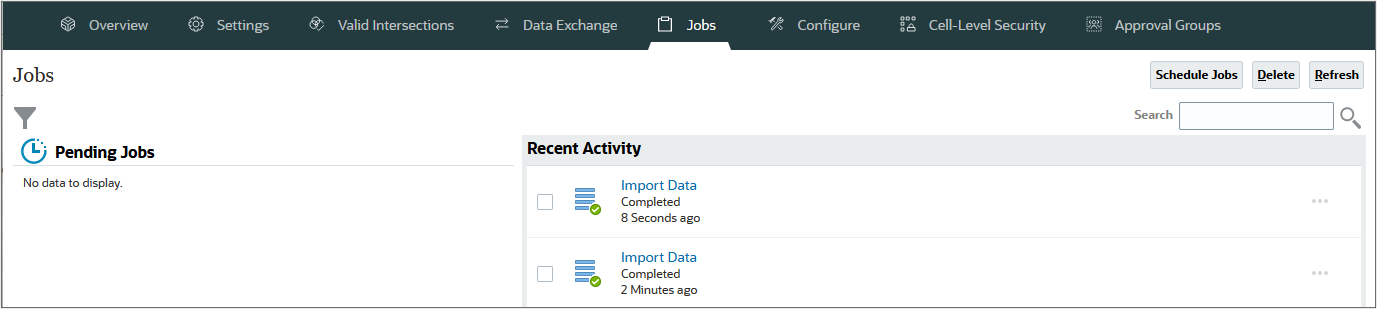
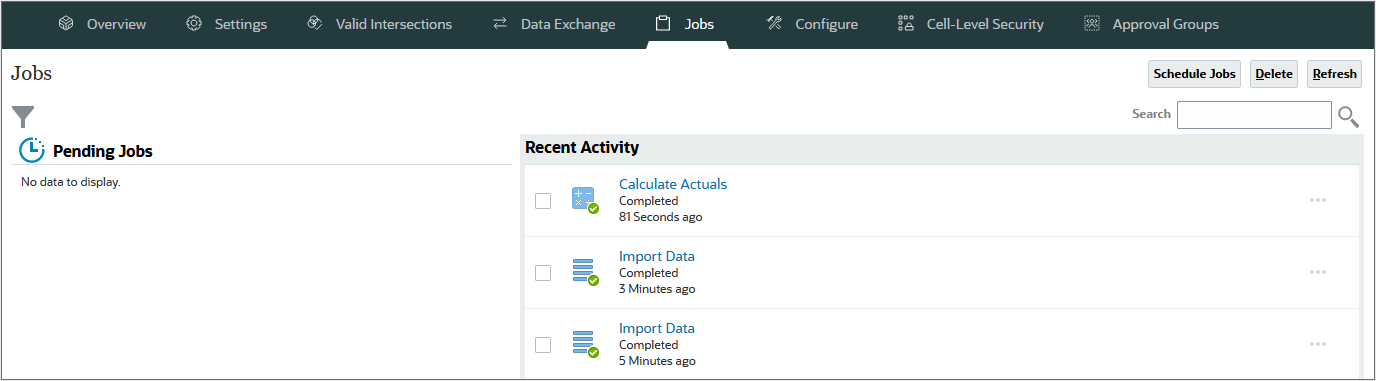
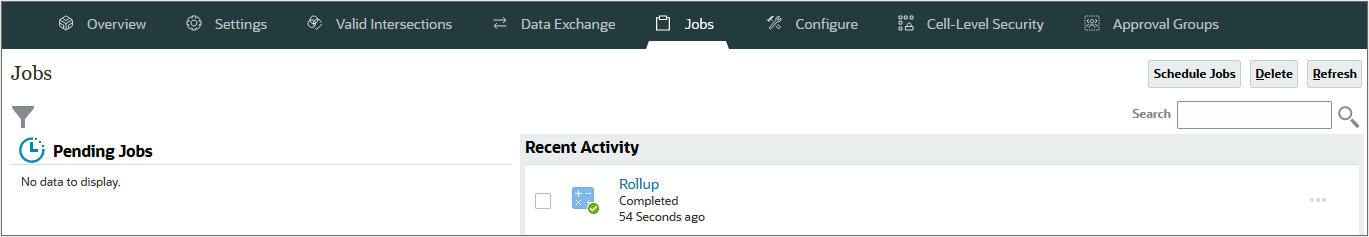
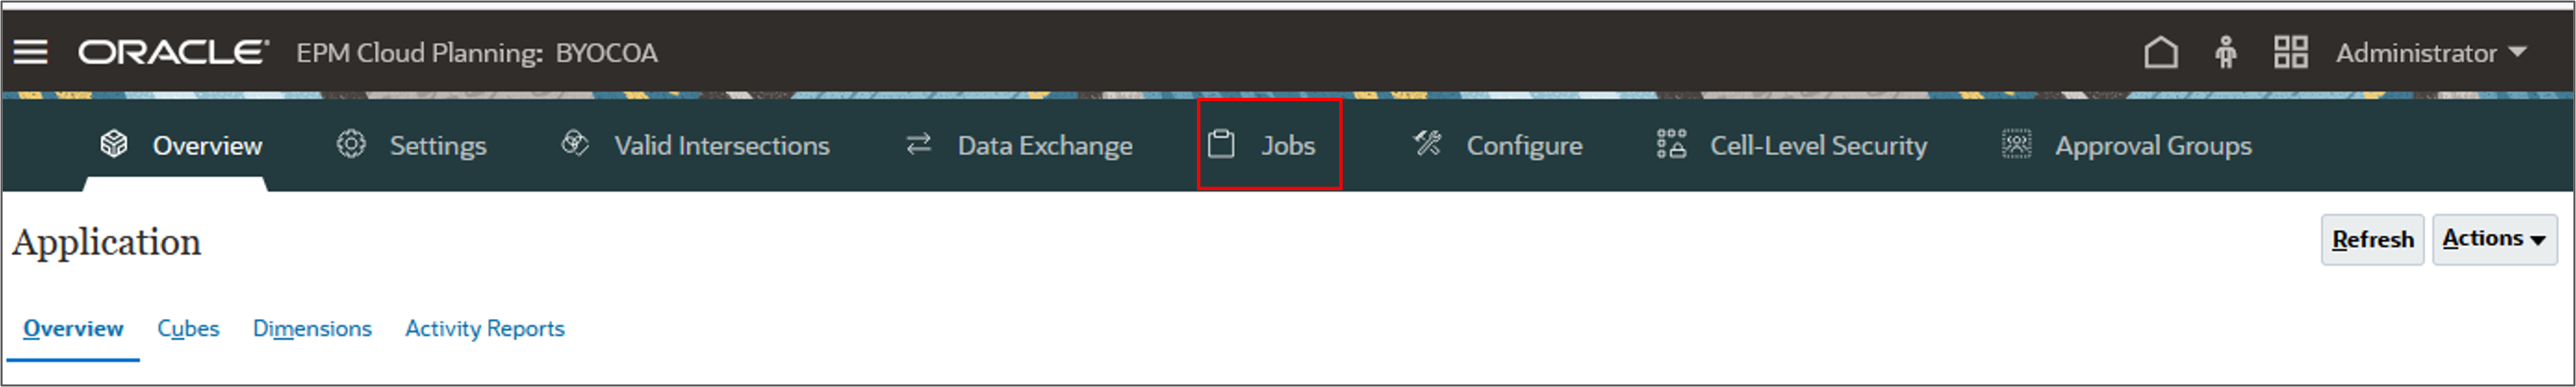
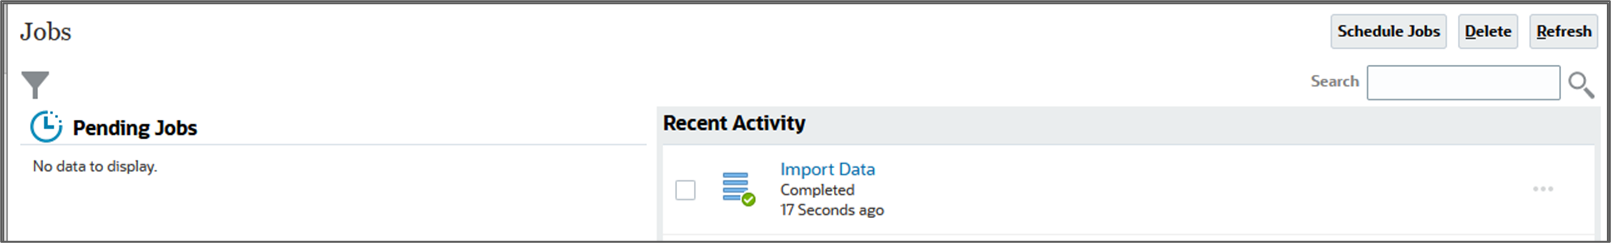
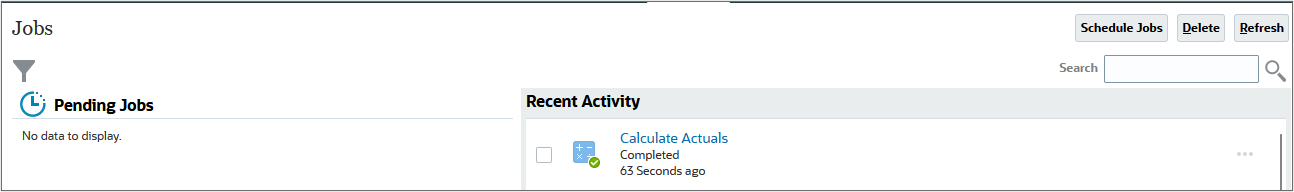
- Click Jobs.
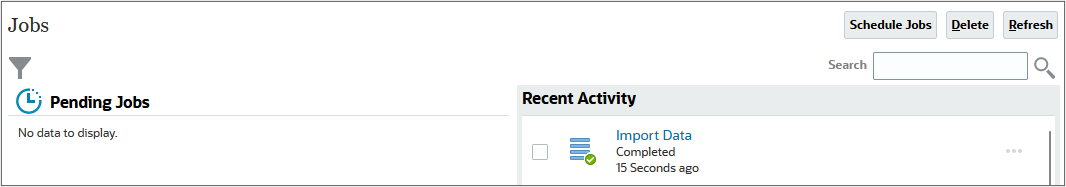
- Verify that the job completed successfully.


Note:
Depending on your browser, the button label may display Choose File or Browse.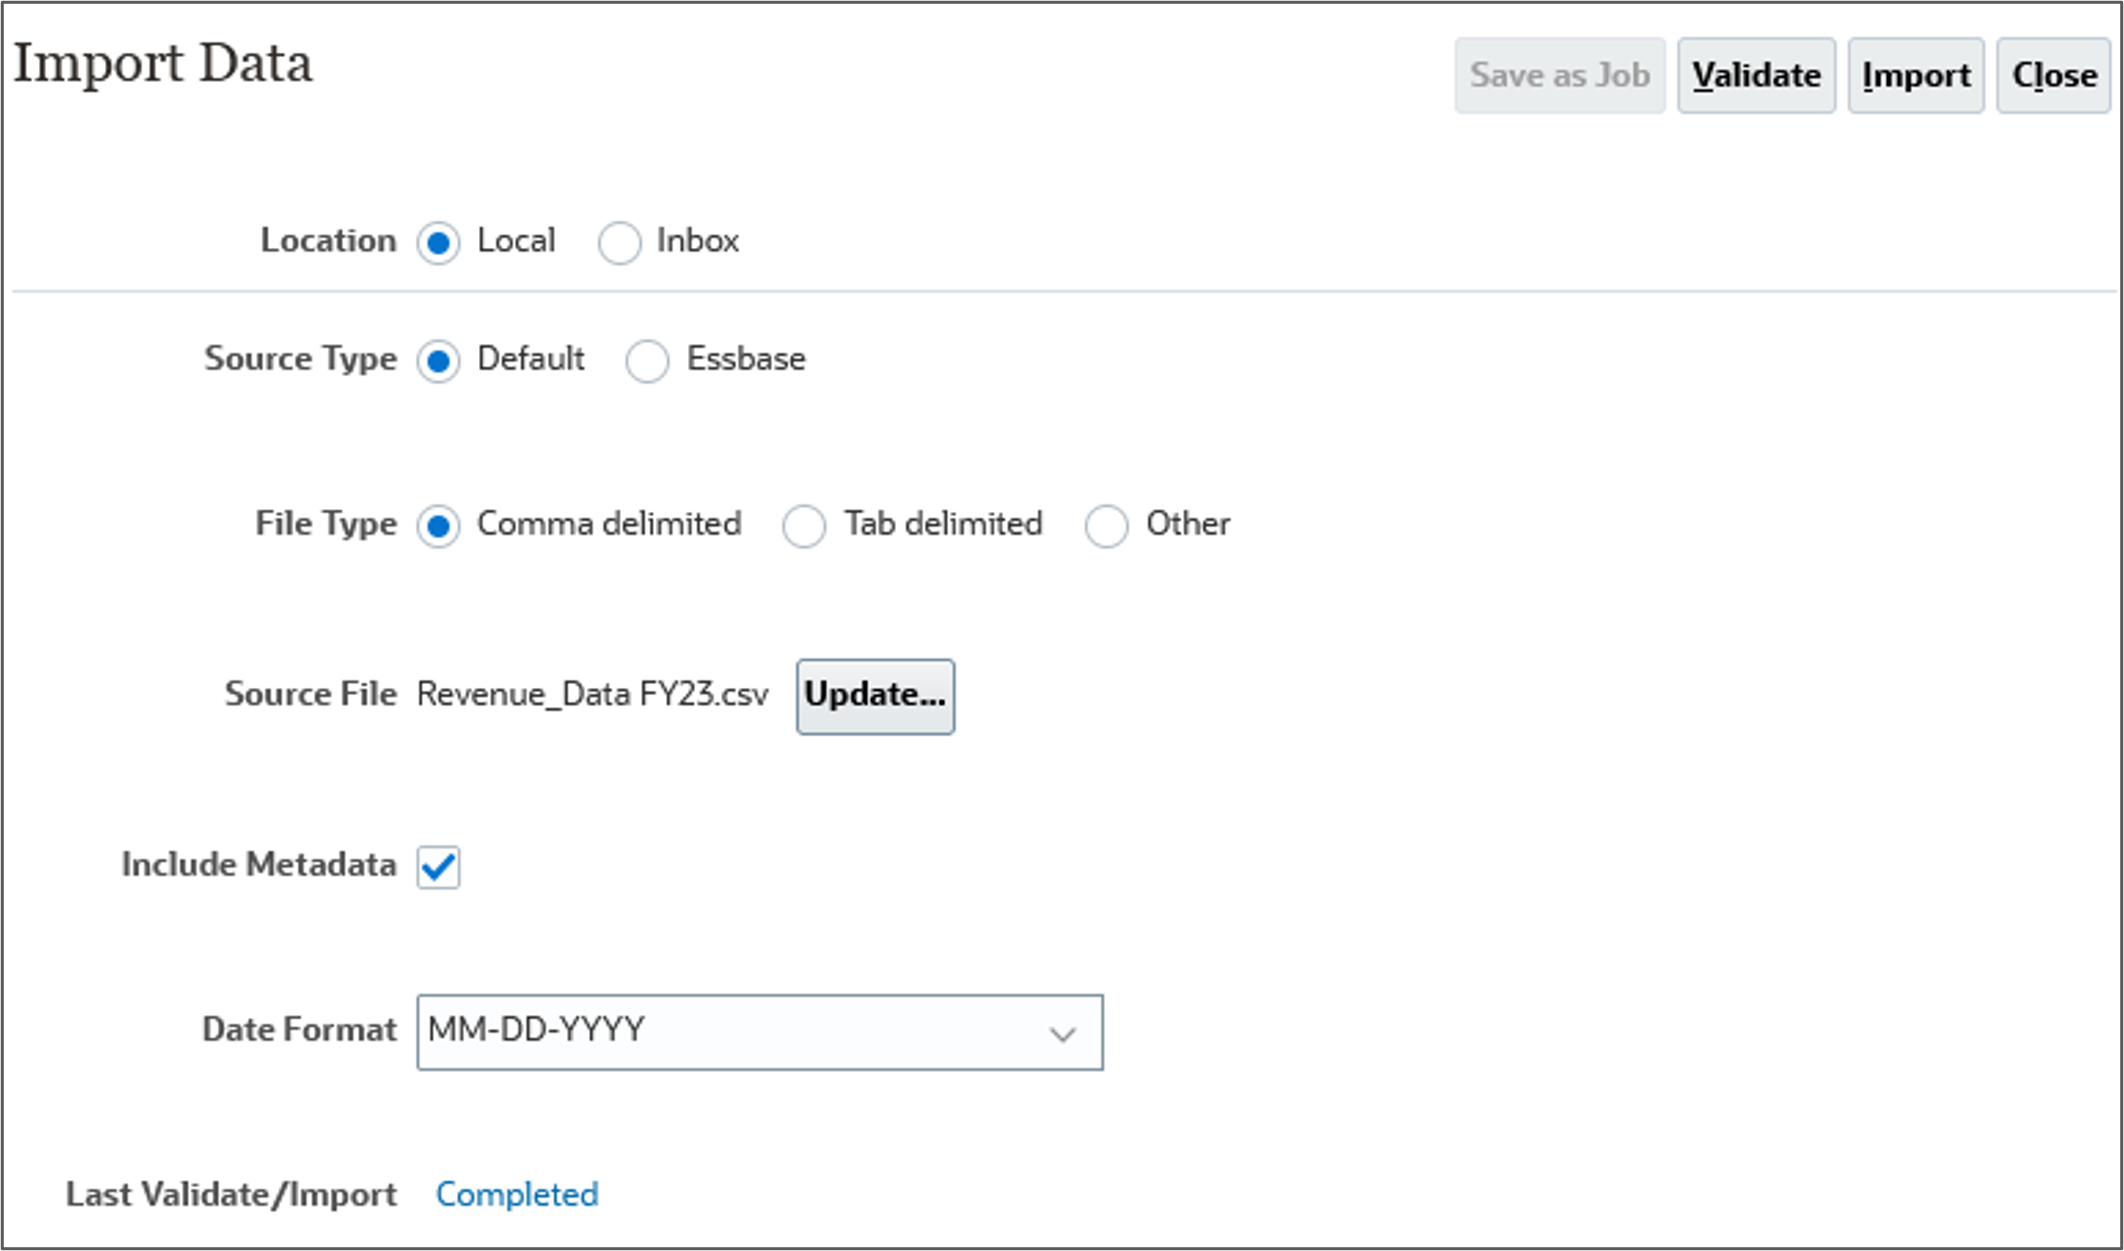
Loading historical expense data
In this section, you load expense data to create a basis for your forecasts.
- Click Overview.
- On the Application page, click Actions, and select Import Data.
- From the Import Data dialog, click Create.
- Keep all the default selections, and select Include Metadata. Click Browse to select a file.
- Locate and select Expense_Data FY23.csv, and click Open.
- Click Import.
- At the information dialog, click OK.
- Click Close twice.
- Click Jobs.
- Verify that the job completed successfully.
- Click (Home).

Note:
Depending on your browser, the button label may display Choose File or Browse.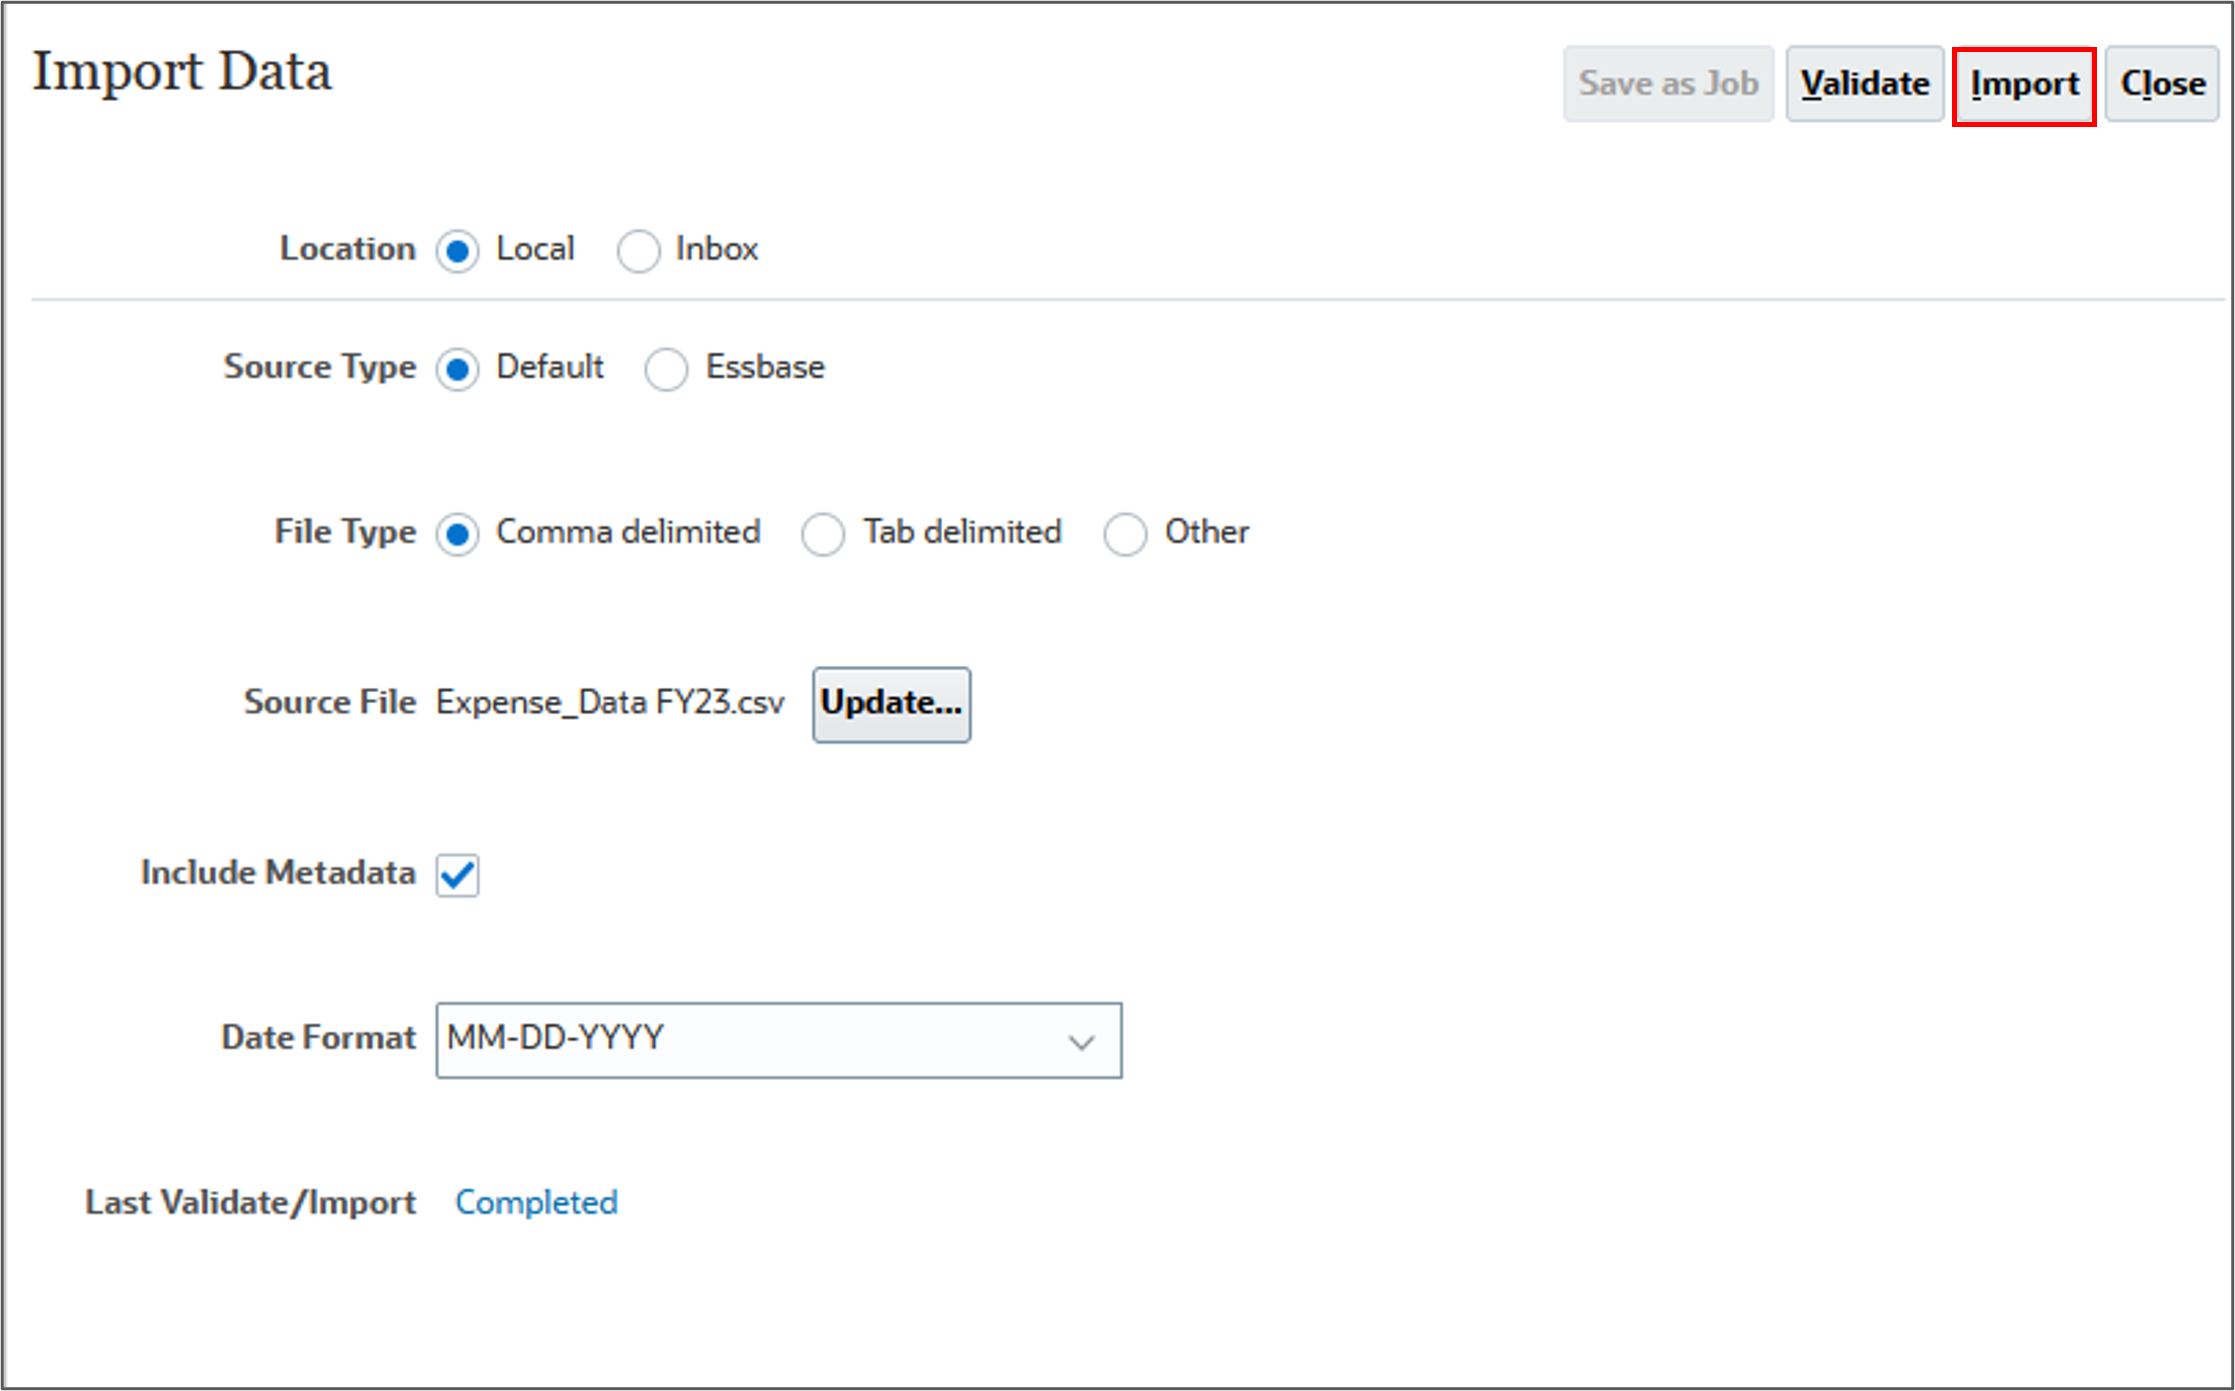

Calculating actuals
In this section, you calculate actual data to roll up the data.
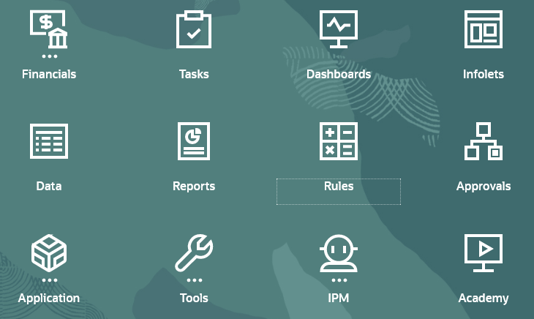
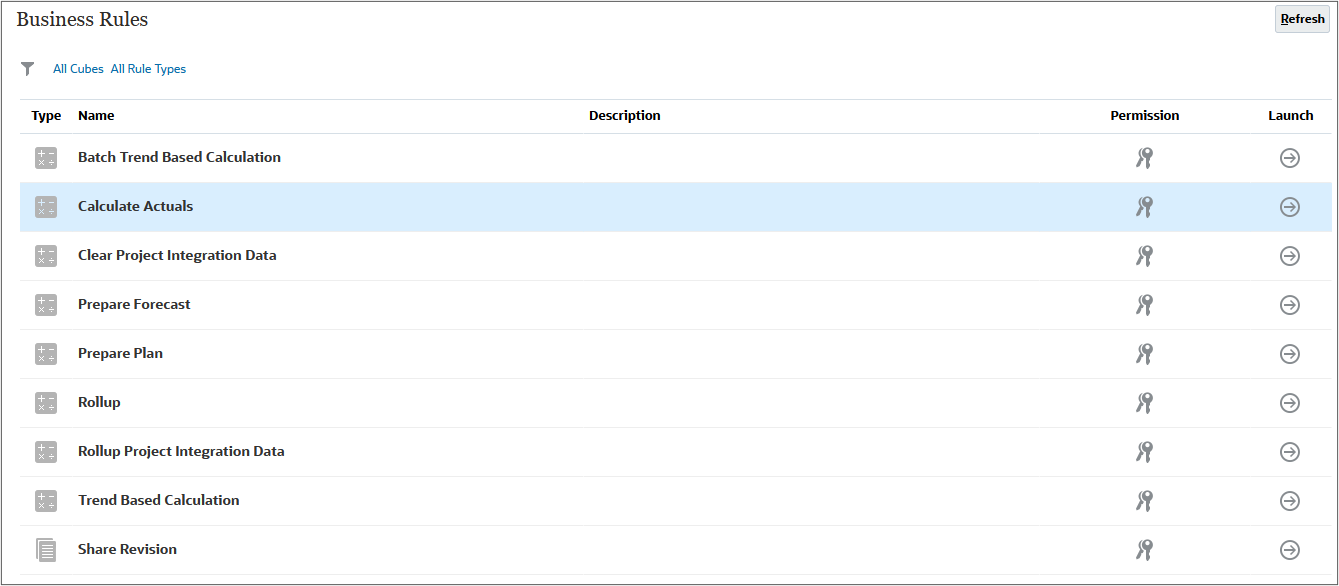
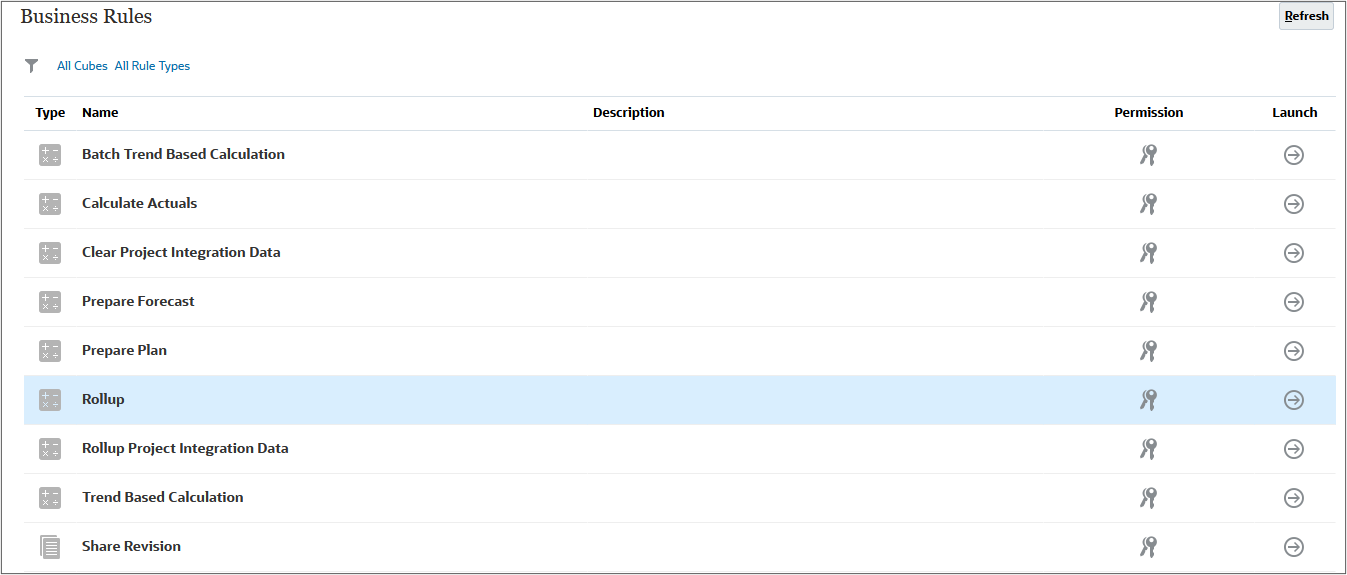
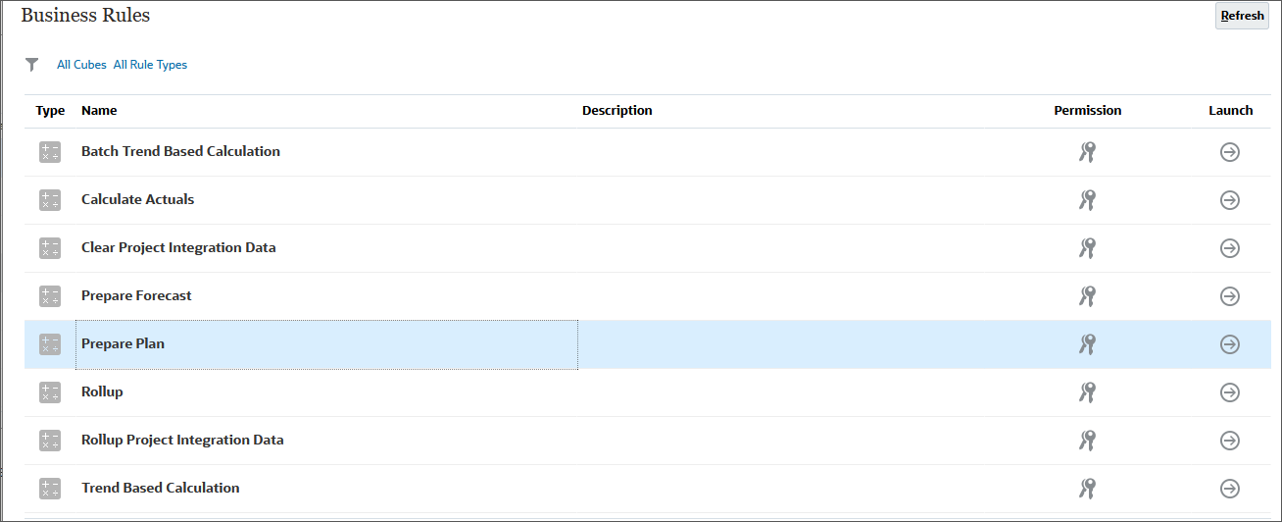
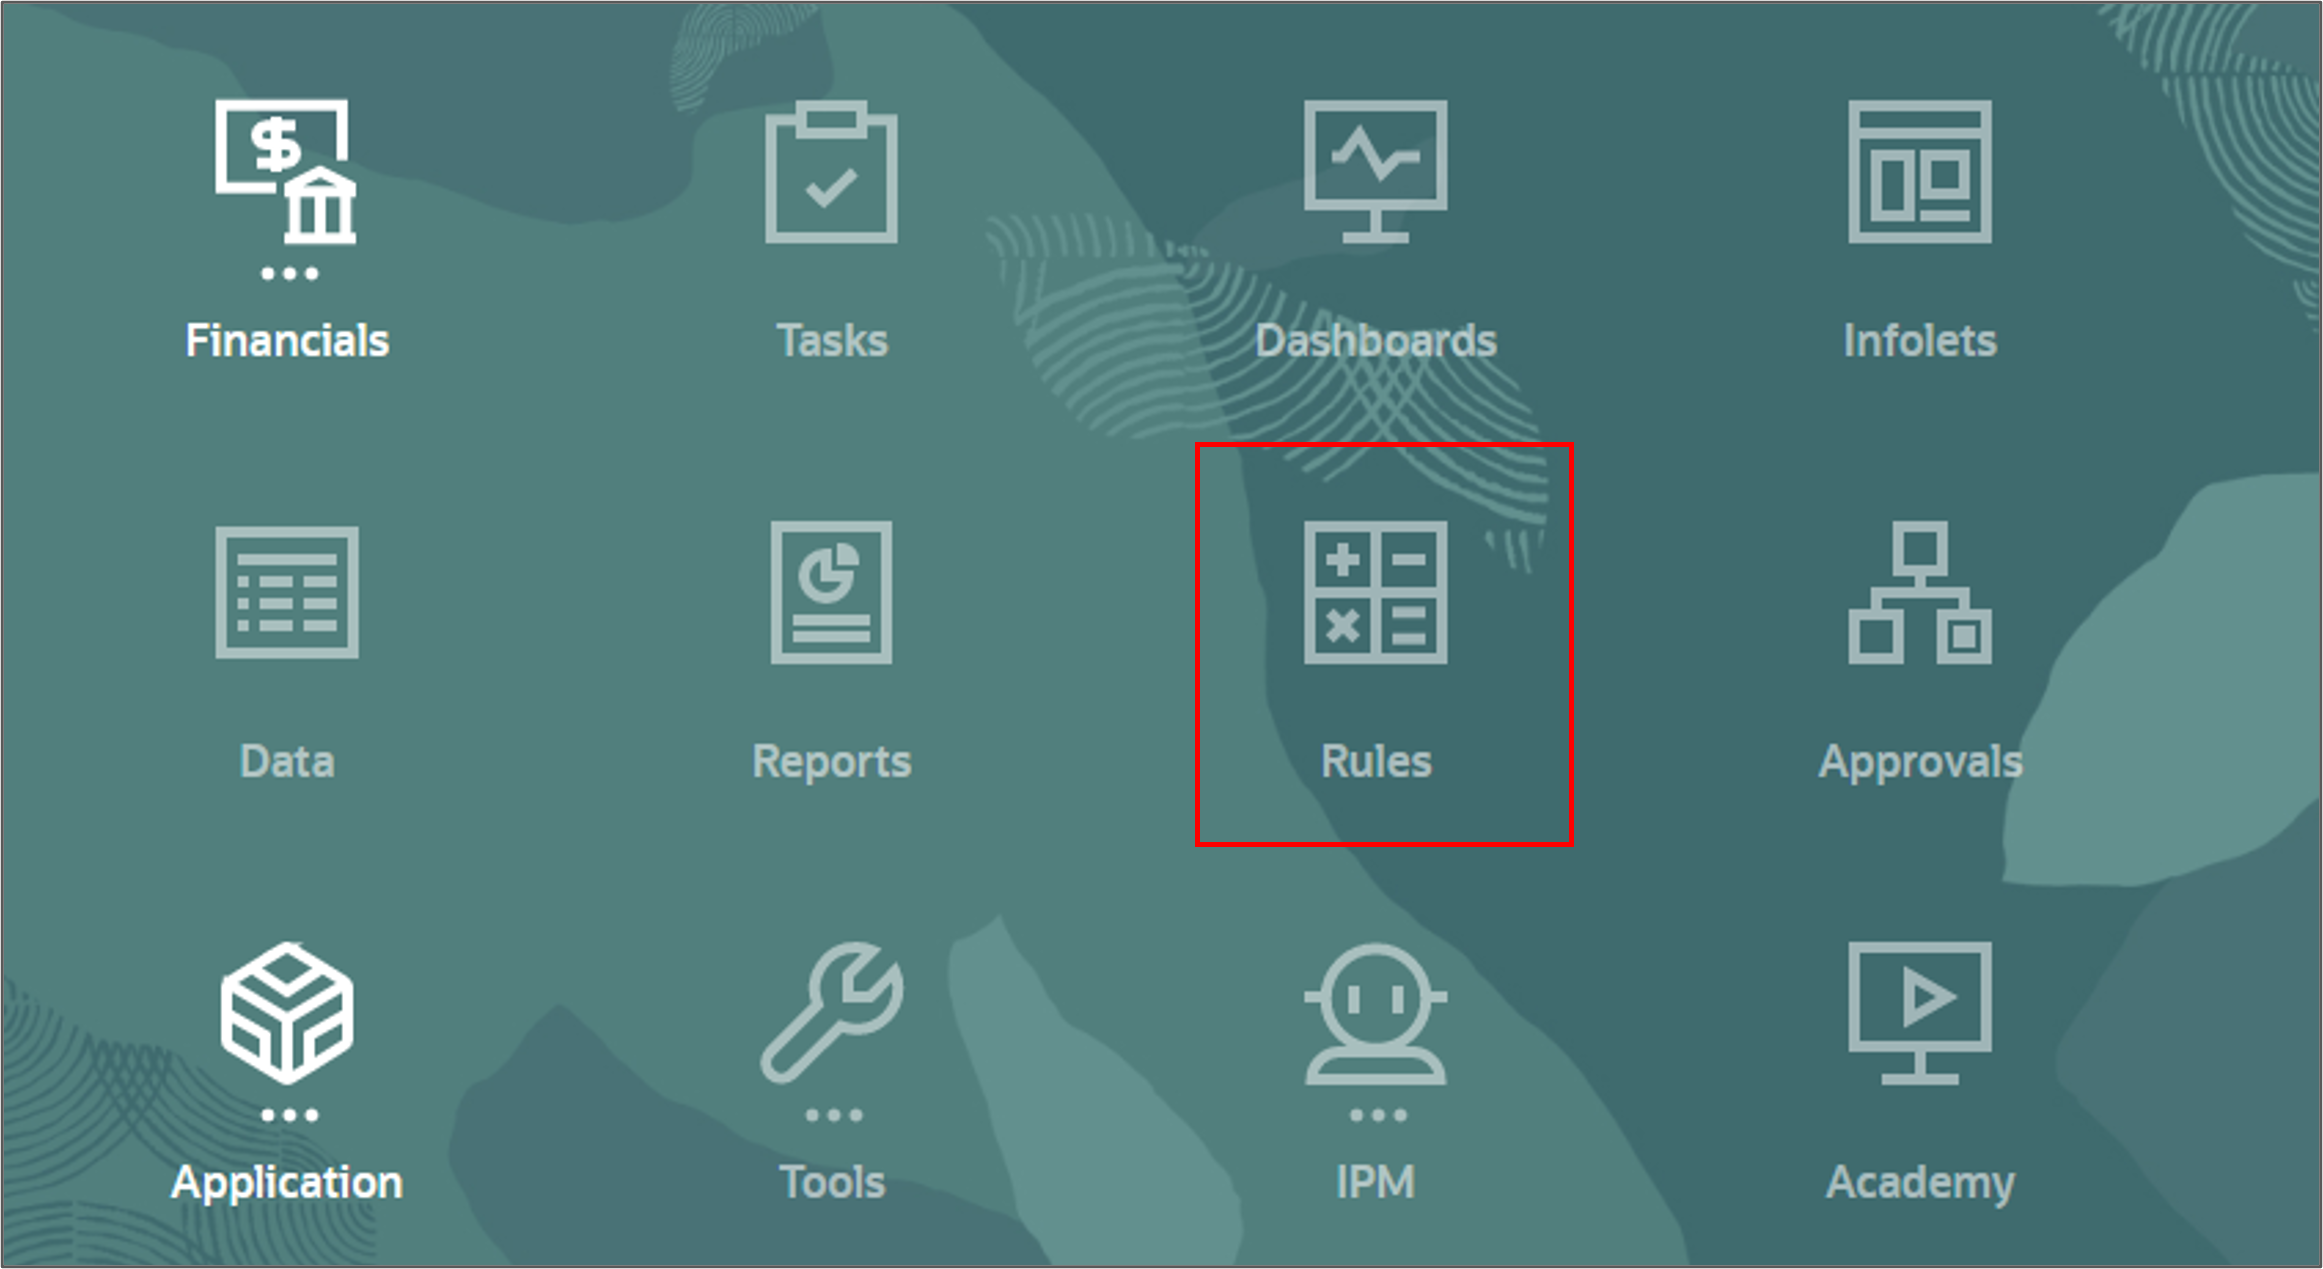
- From the Planning home page, click Rules.
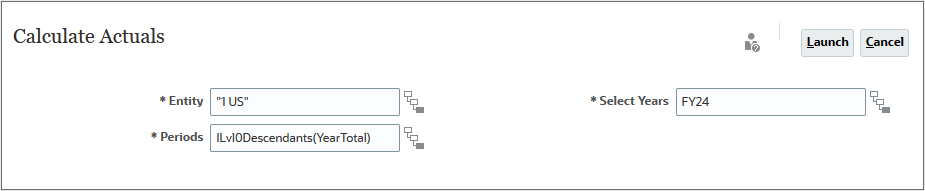
- On Business Rules, for the Calculate Actuals row, click Launch.
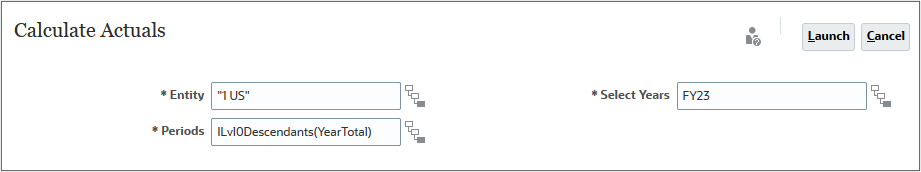
- For each item click
 (Select Member) to set the member's value as specified below, and then click Launch:
 - Entity: "1 US"
- Periods: ILev0Descendants(YearTotal)
- Years: FY23
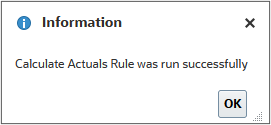
- At the Information dialog, click OK.
- Click (home).
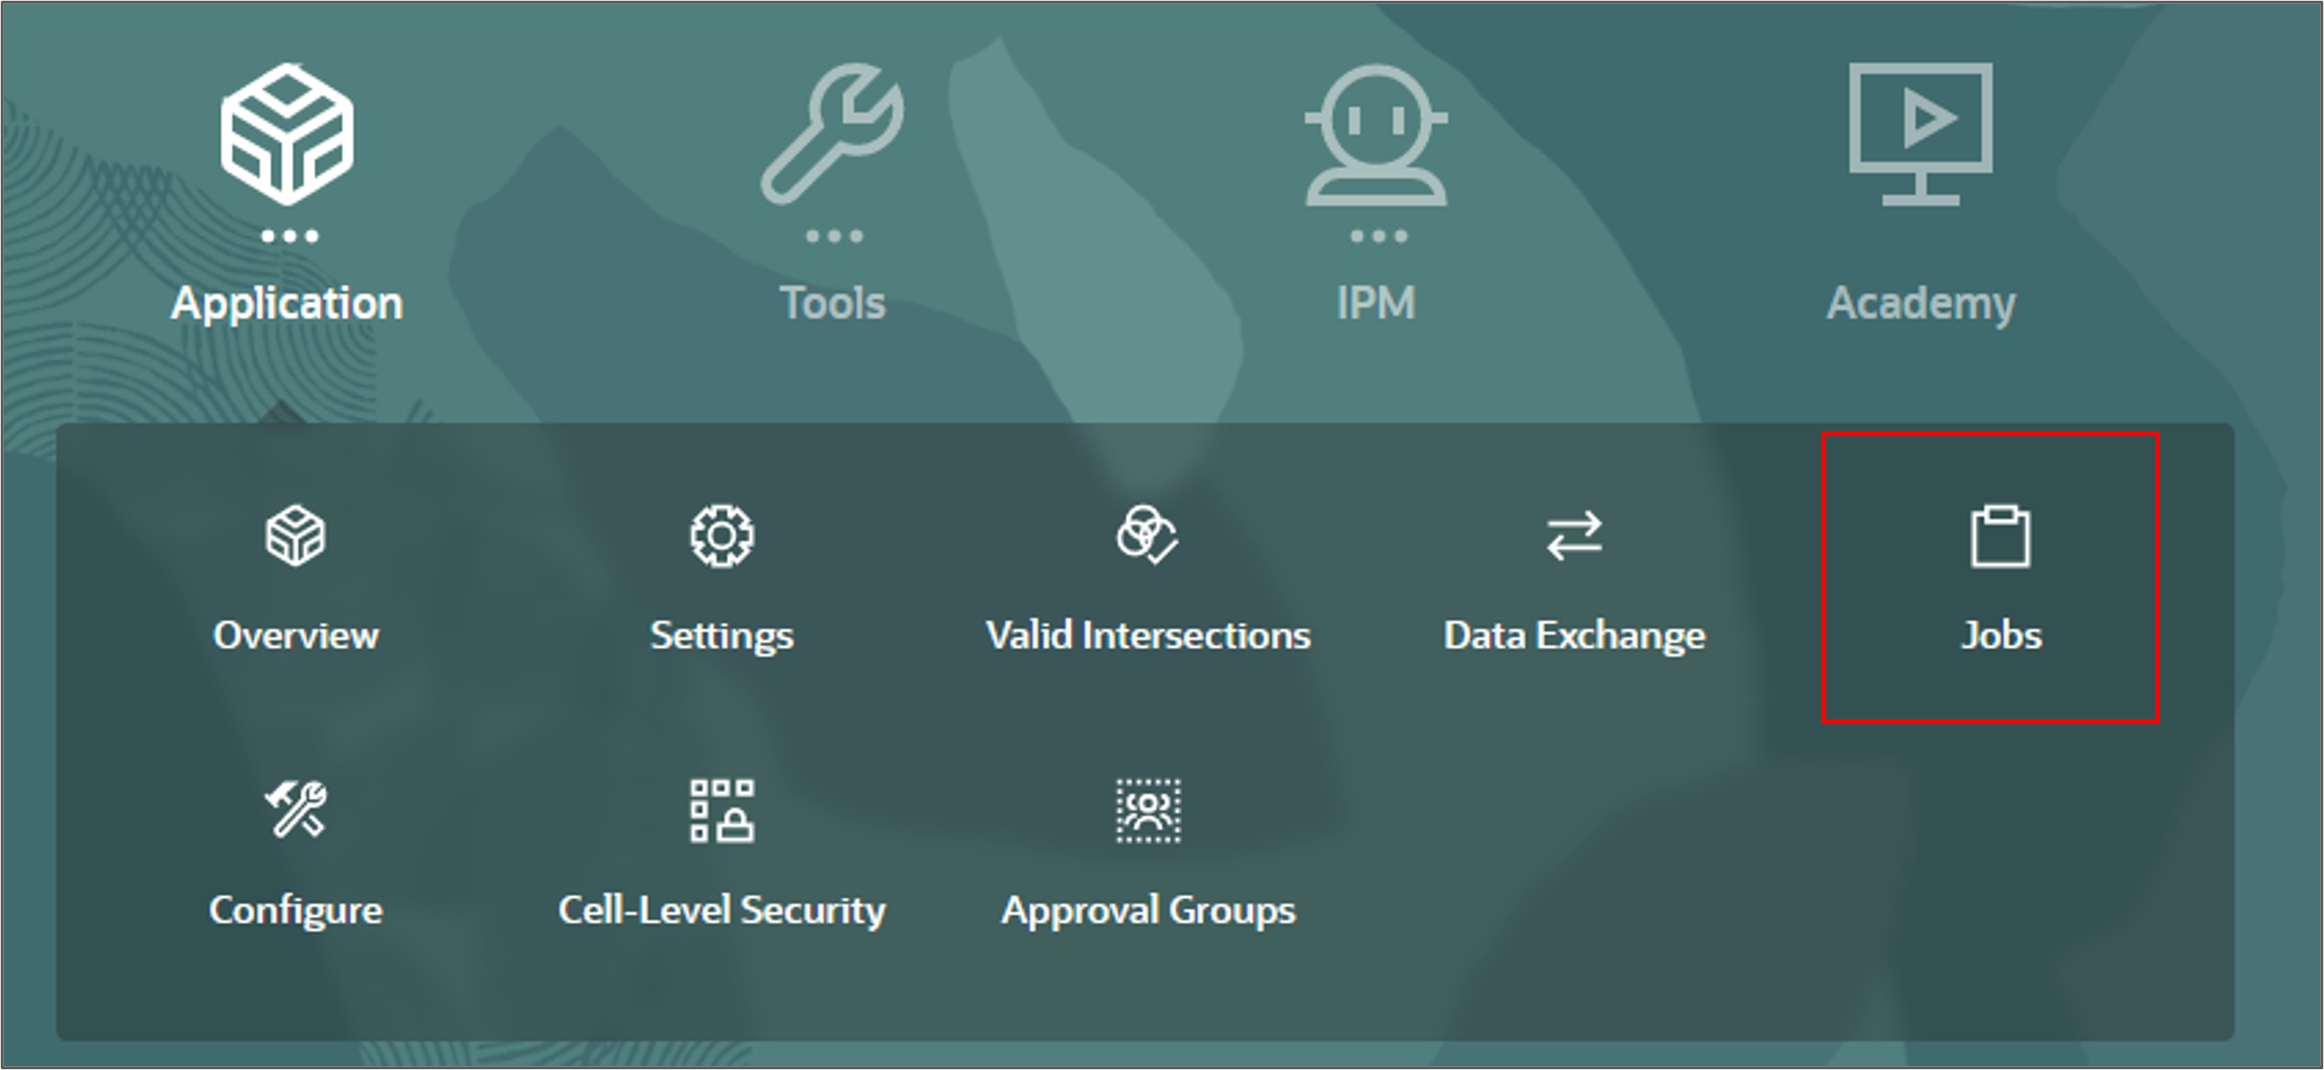
- From the Planning Home page, click Application then Jobs.
- Verify that the job completed successfully.
- Click (Home).
Rolling up data for scenarios
In this section, you run a rule to rollup data.
- On the Planning home page, click Rules.
- For Rollup, on the right, click Launch.
- For each item click (Select Member) to set the member's value as specified below, and then click Launch:
- Scenario: OEP_Actual
- Currency: USD
- Years: FY23
- At the information message, click OK.
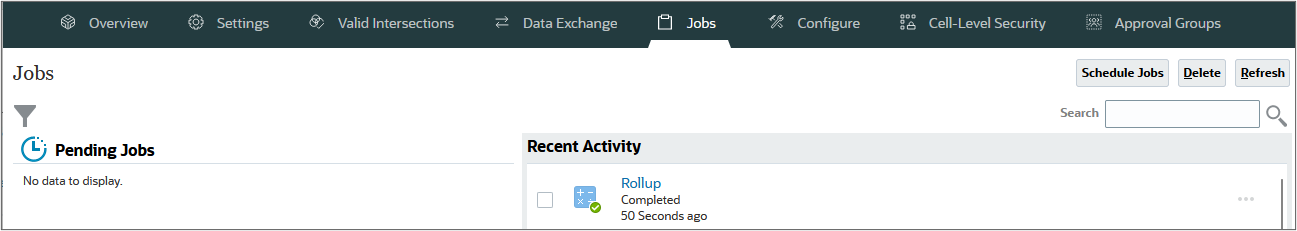
- Click Navigator, and under Application, select Jobs.
- Click (Home).
Tip:
Change the value of the scenario dimension first.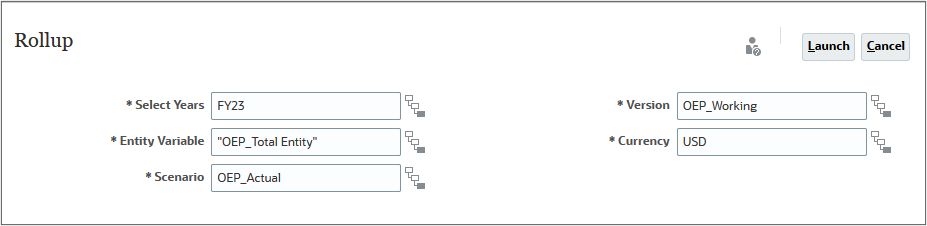

The rollup job completed successfully.
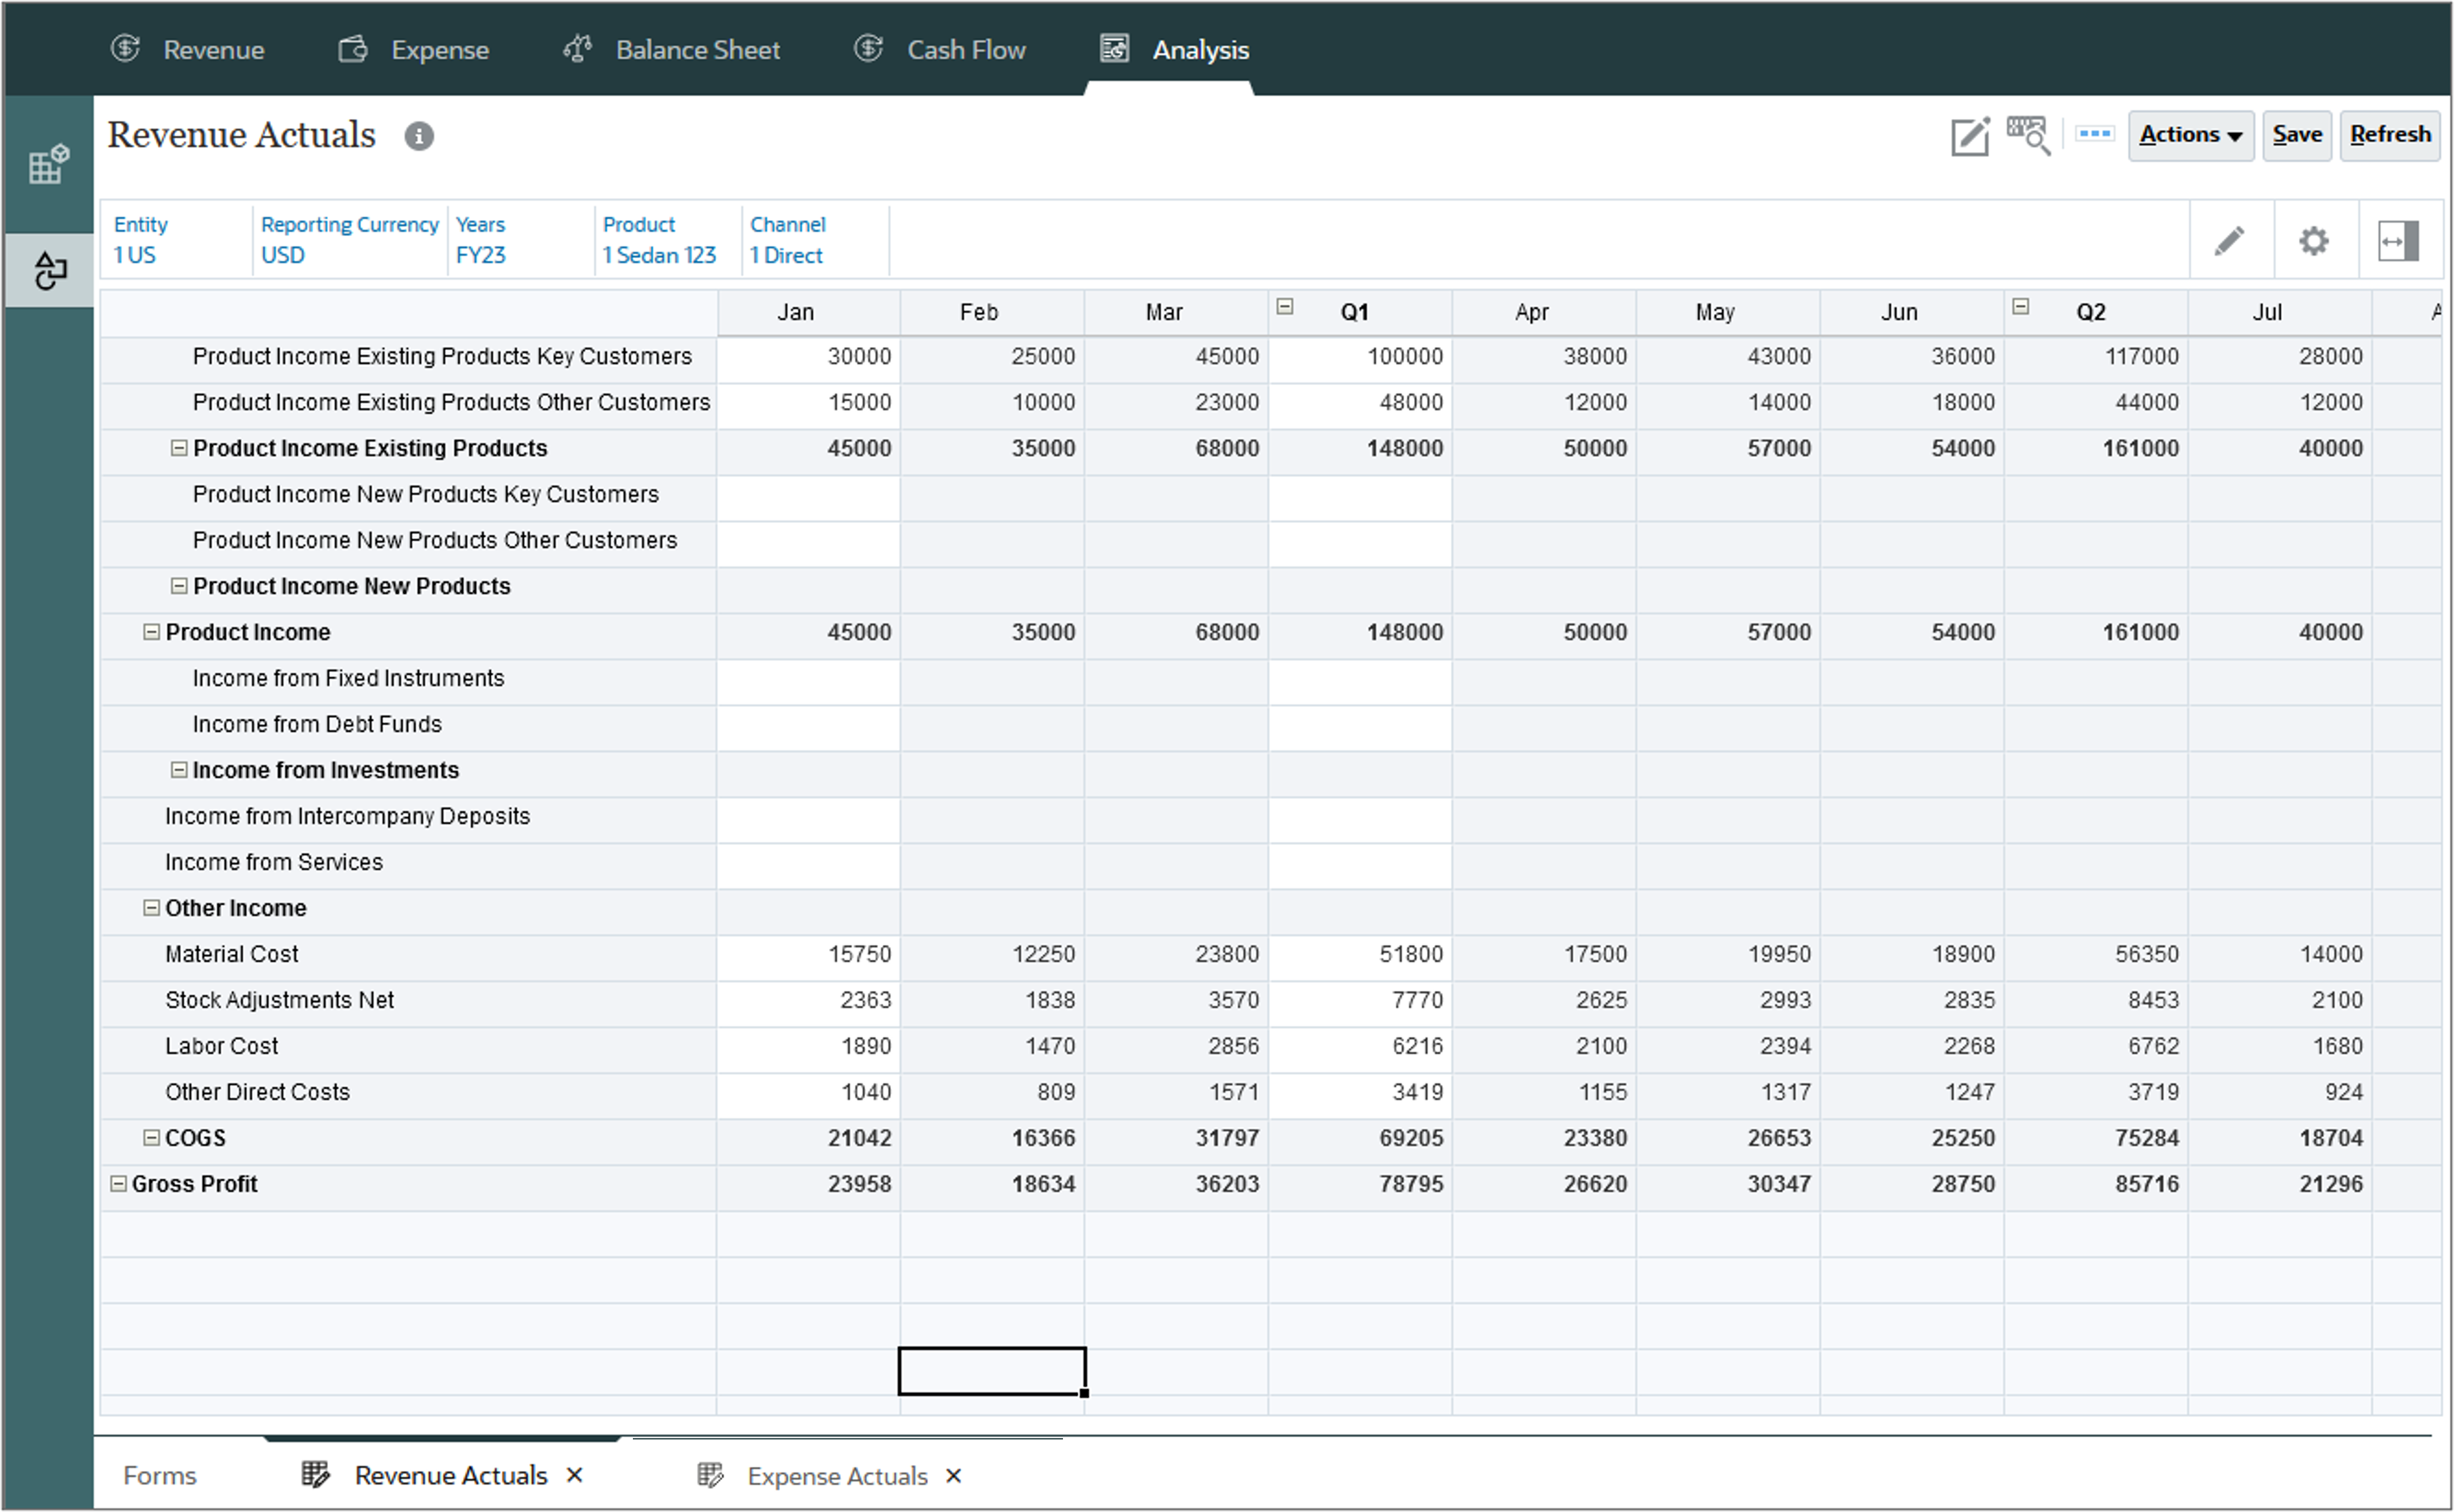
Reviewing loaded data
In this section, you verify that actual data was loaded.
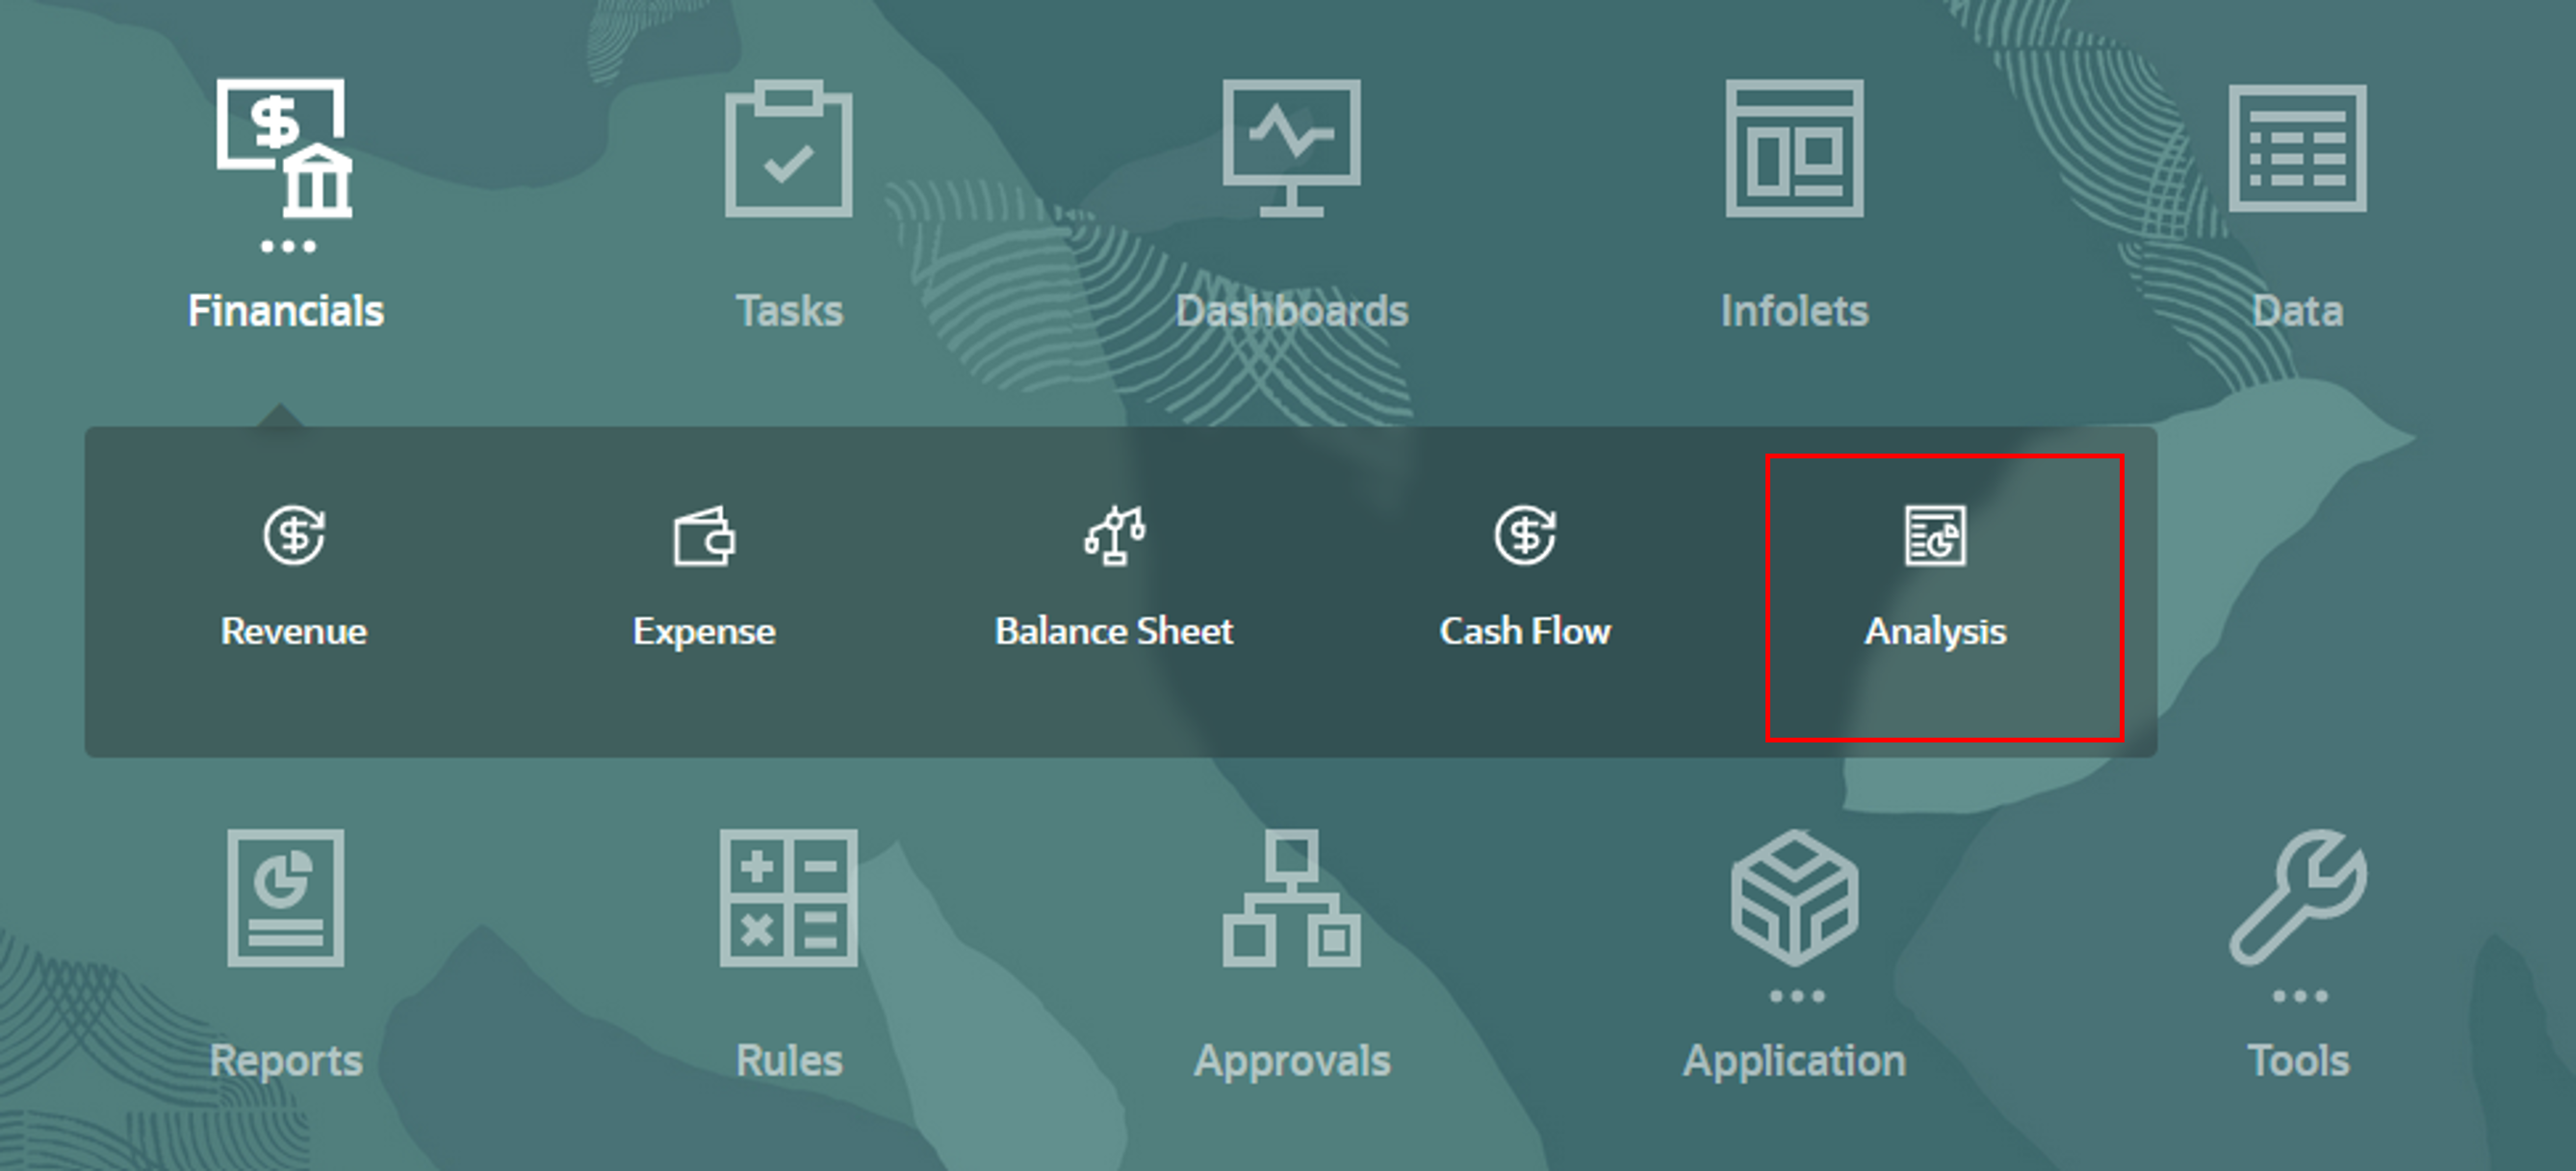
- On the Planning home page, click Financials, then Analysis.
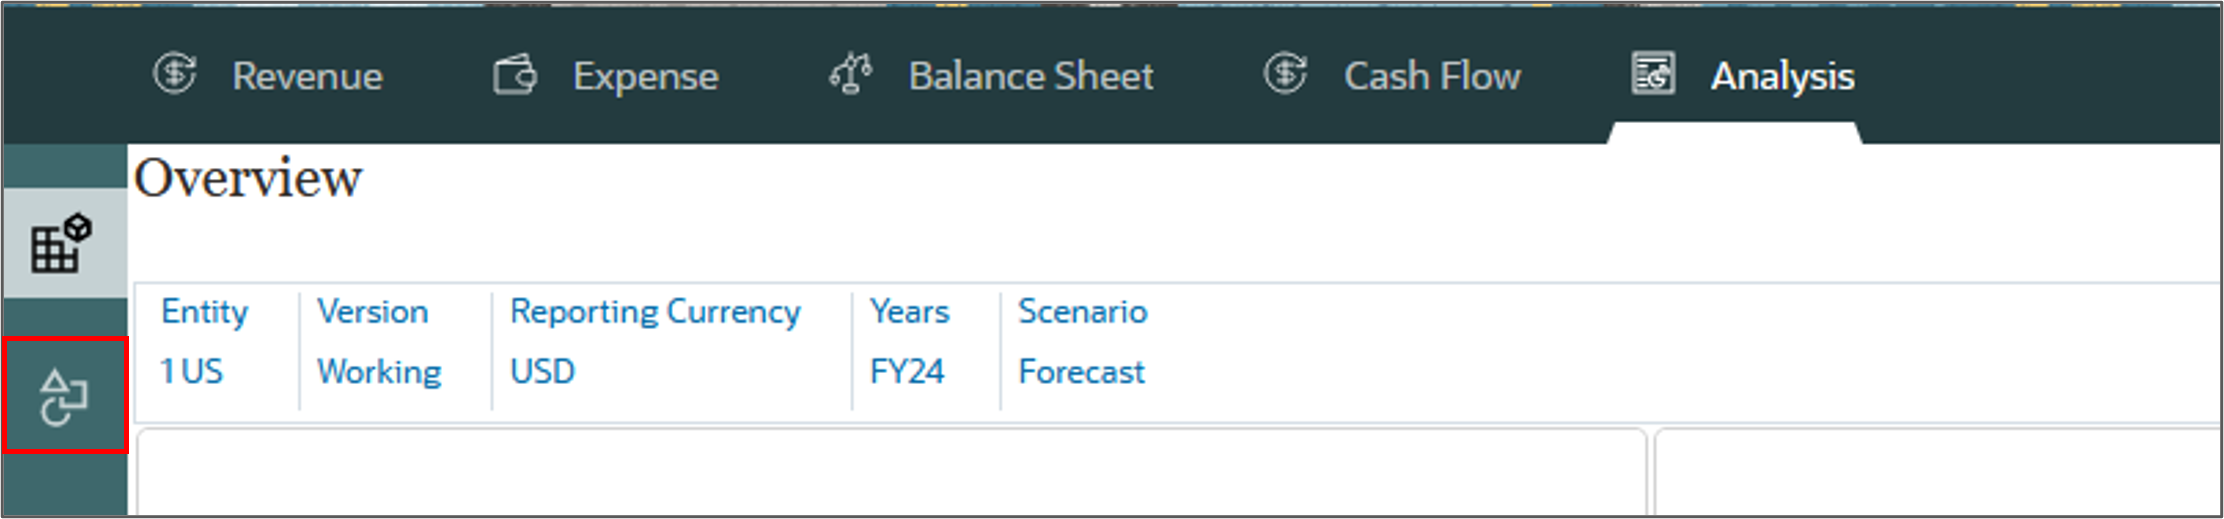
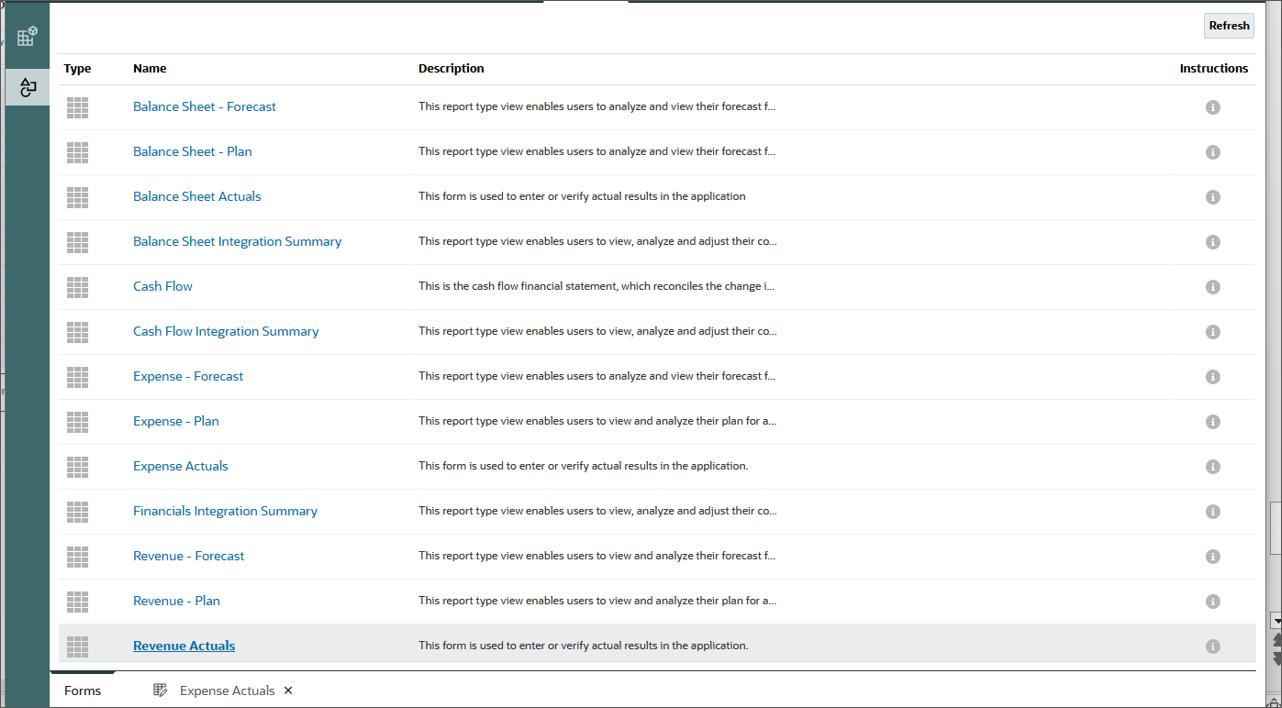
- Select the Forms vertical tab.
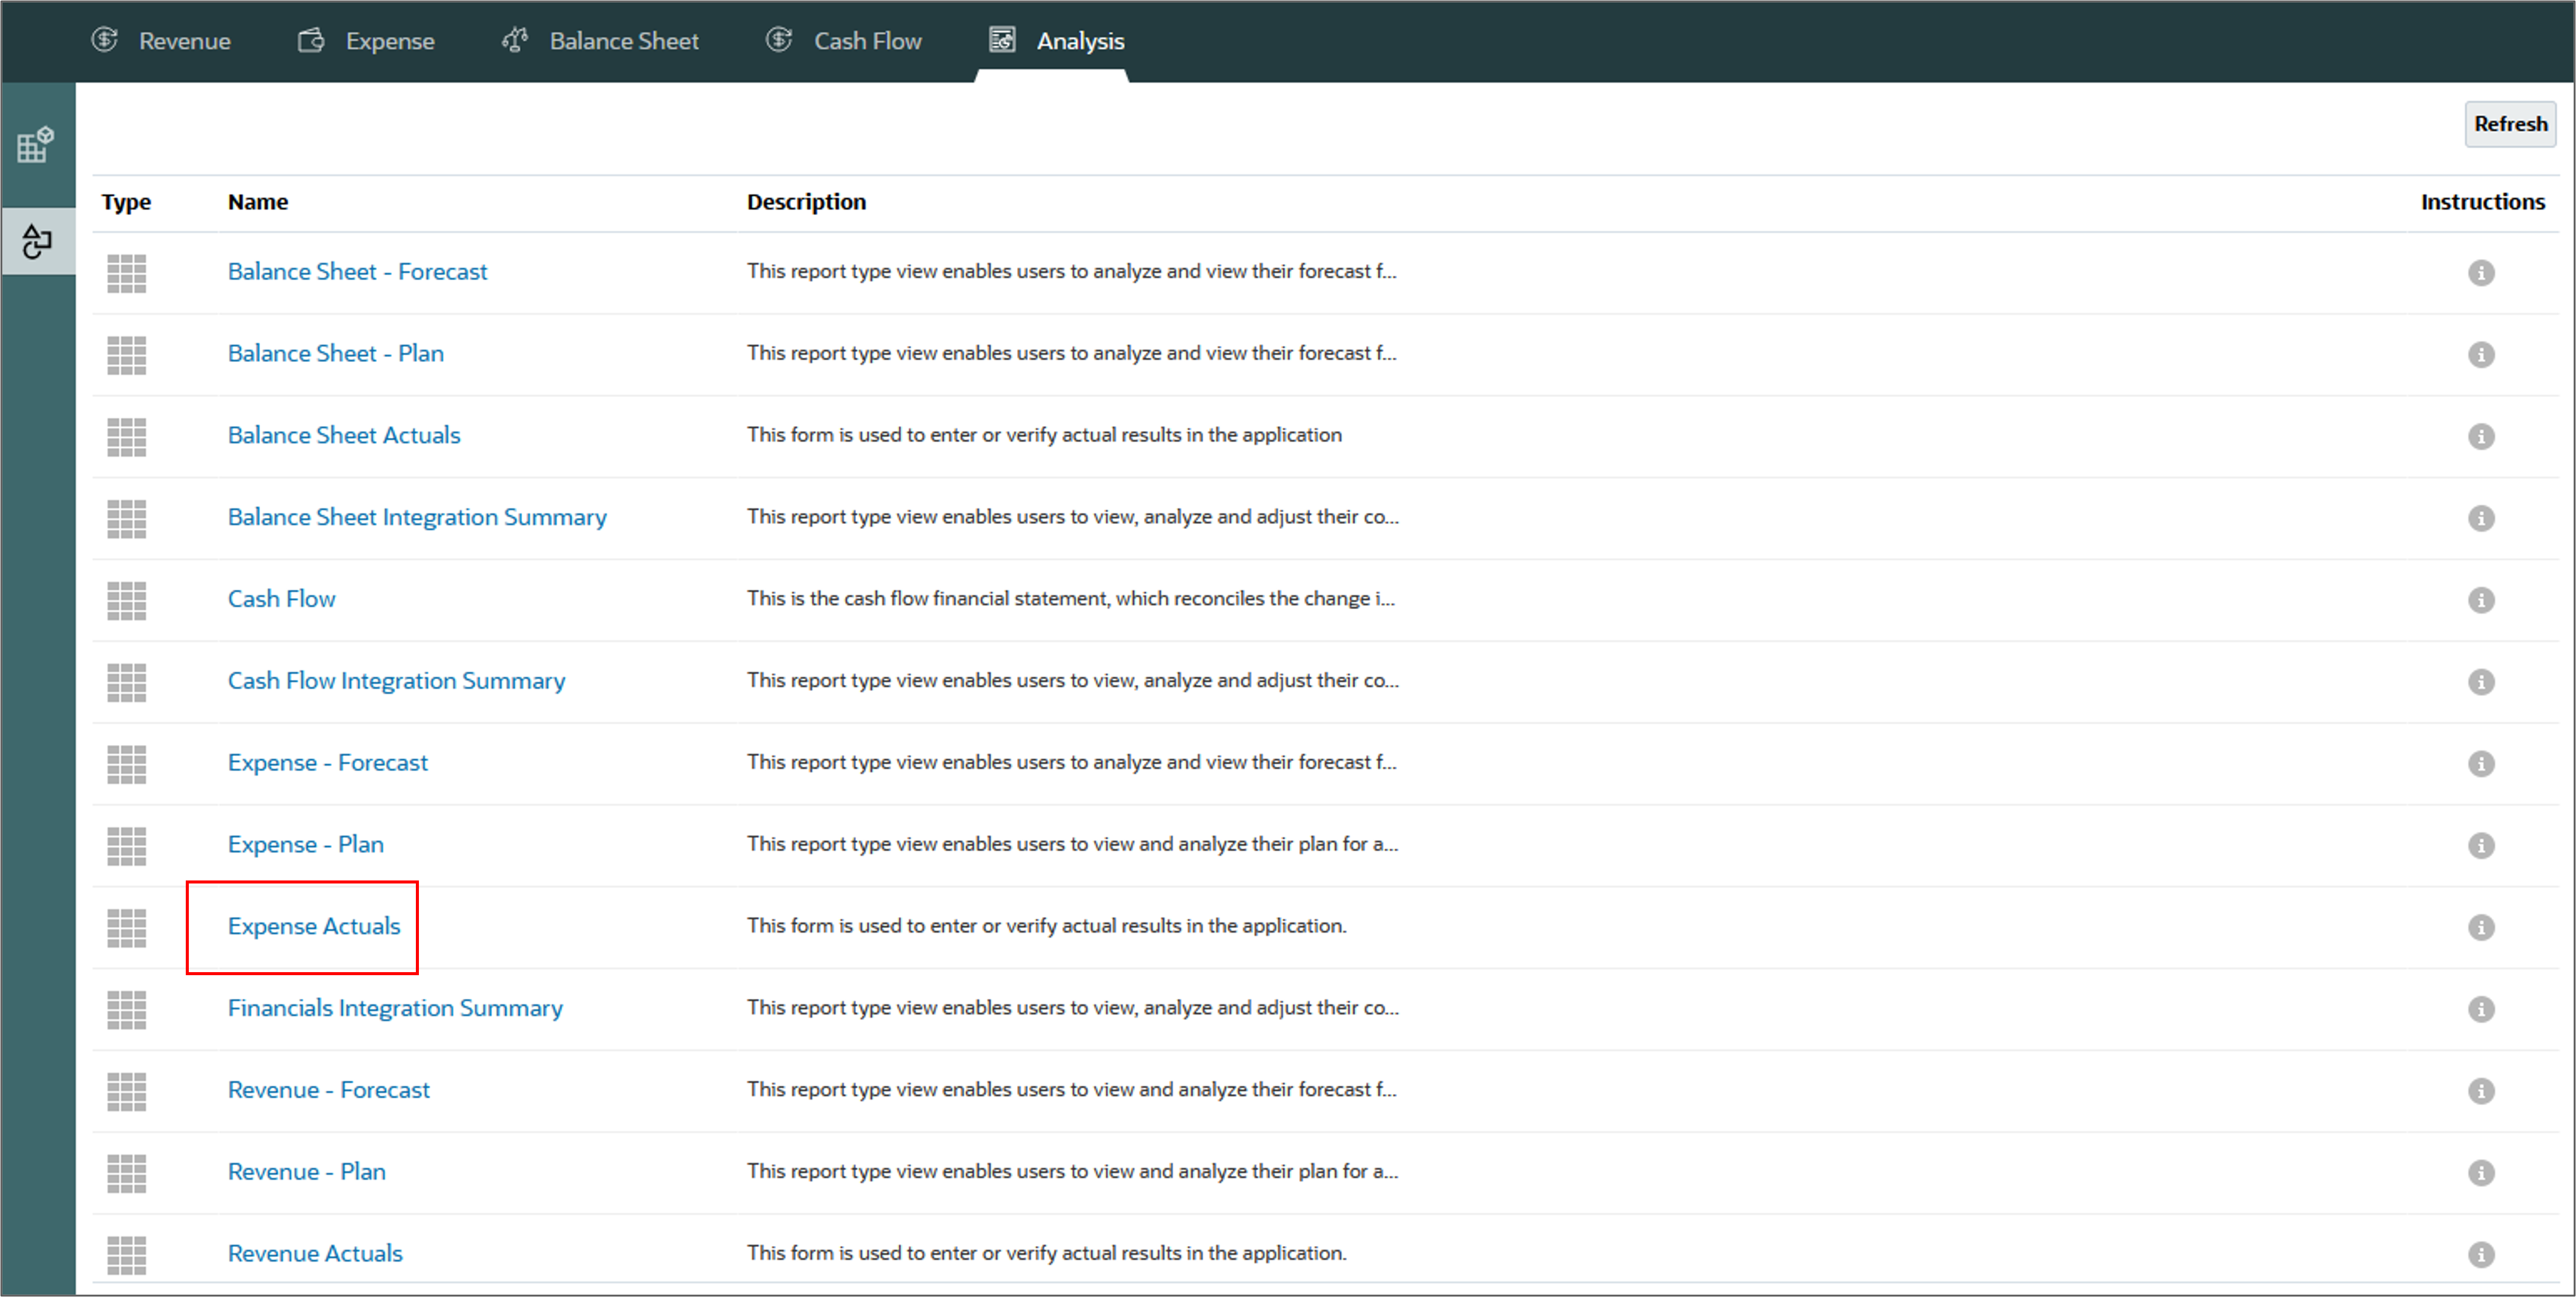
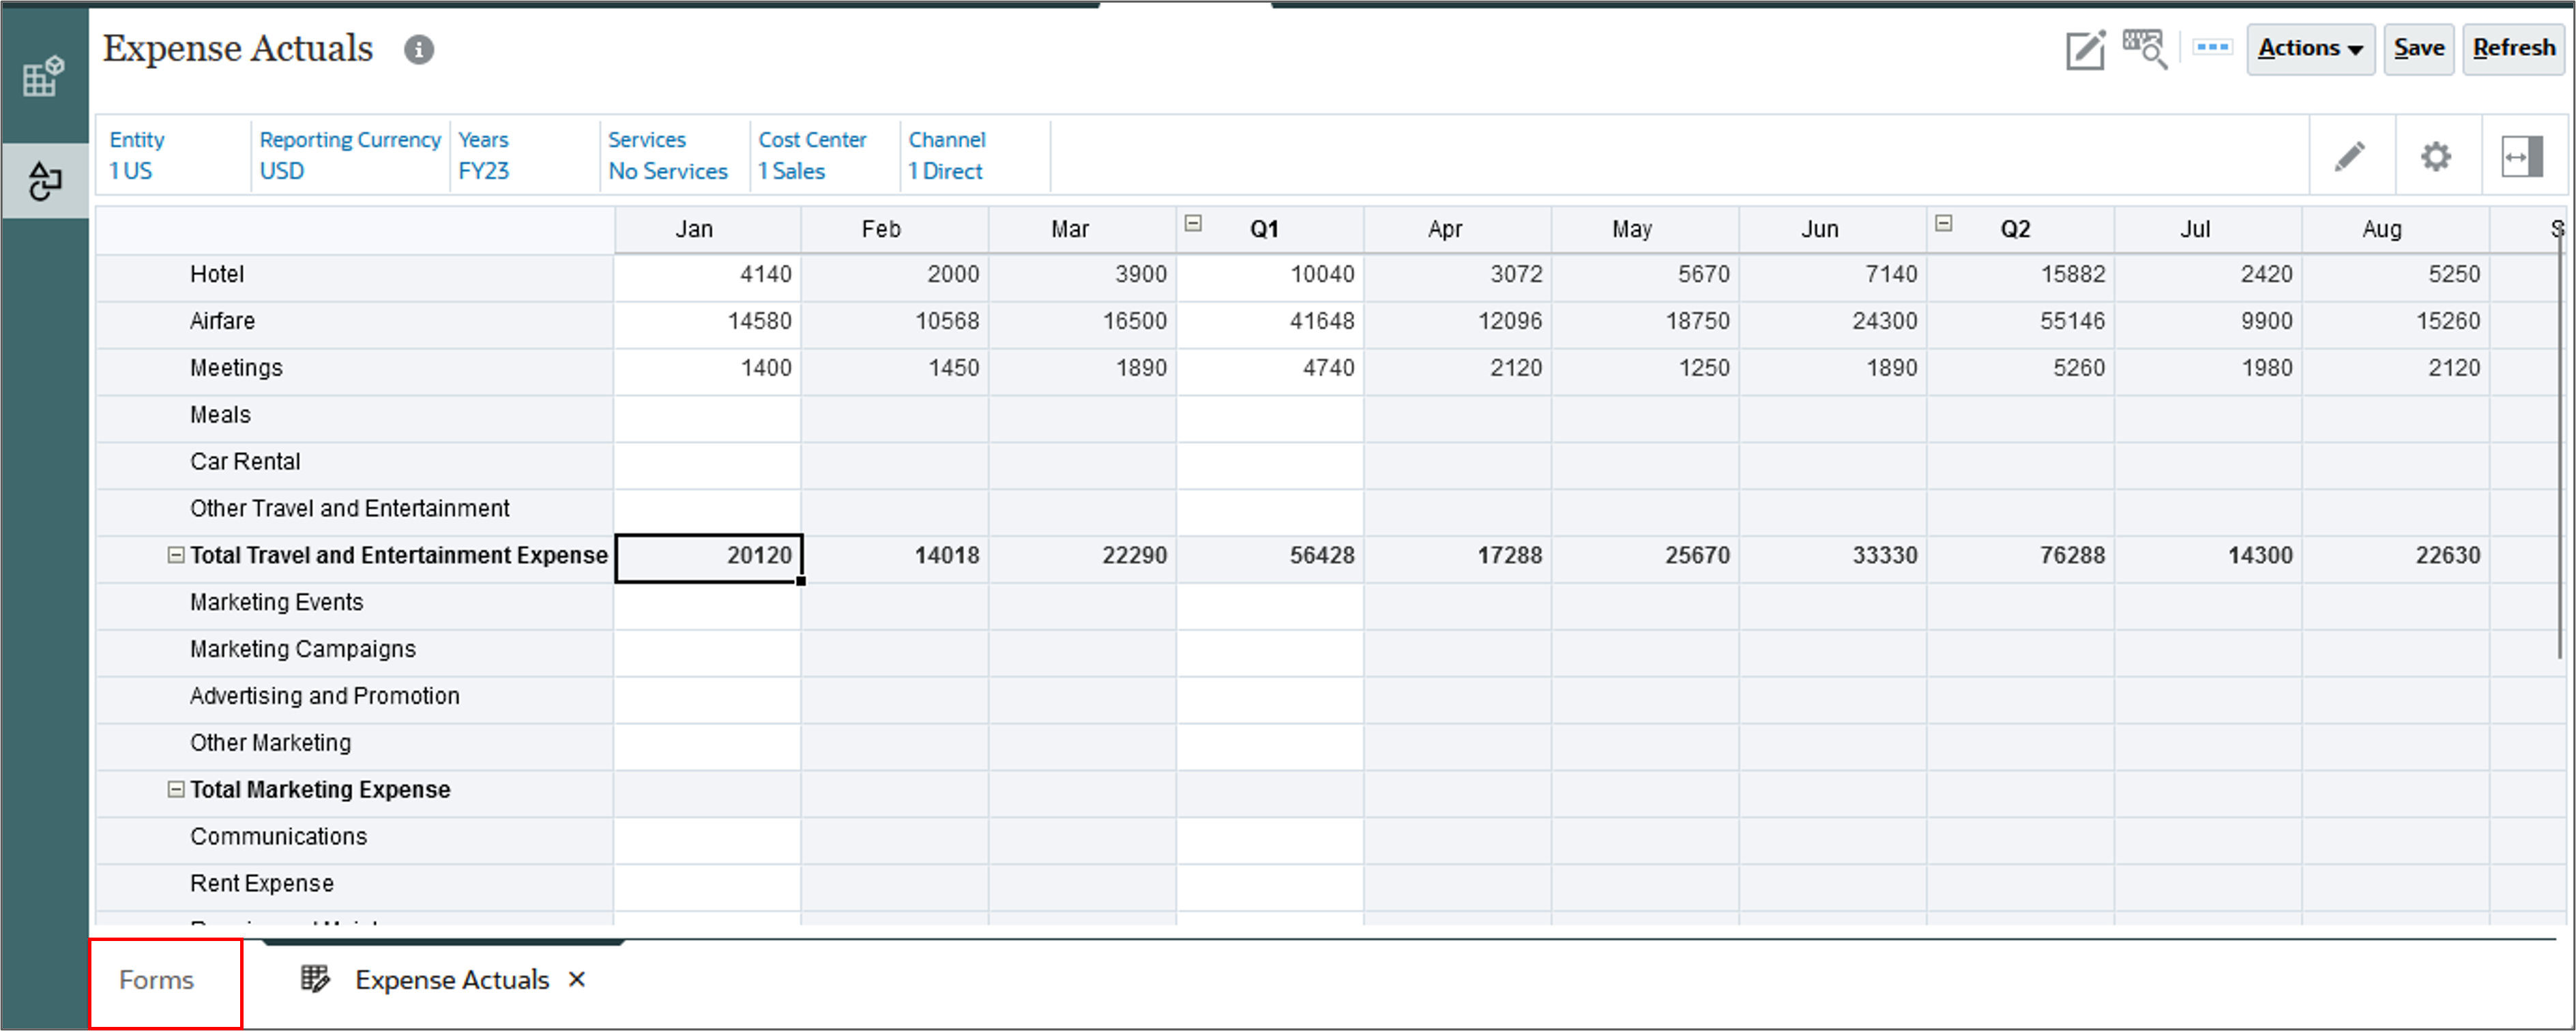
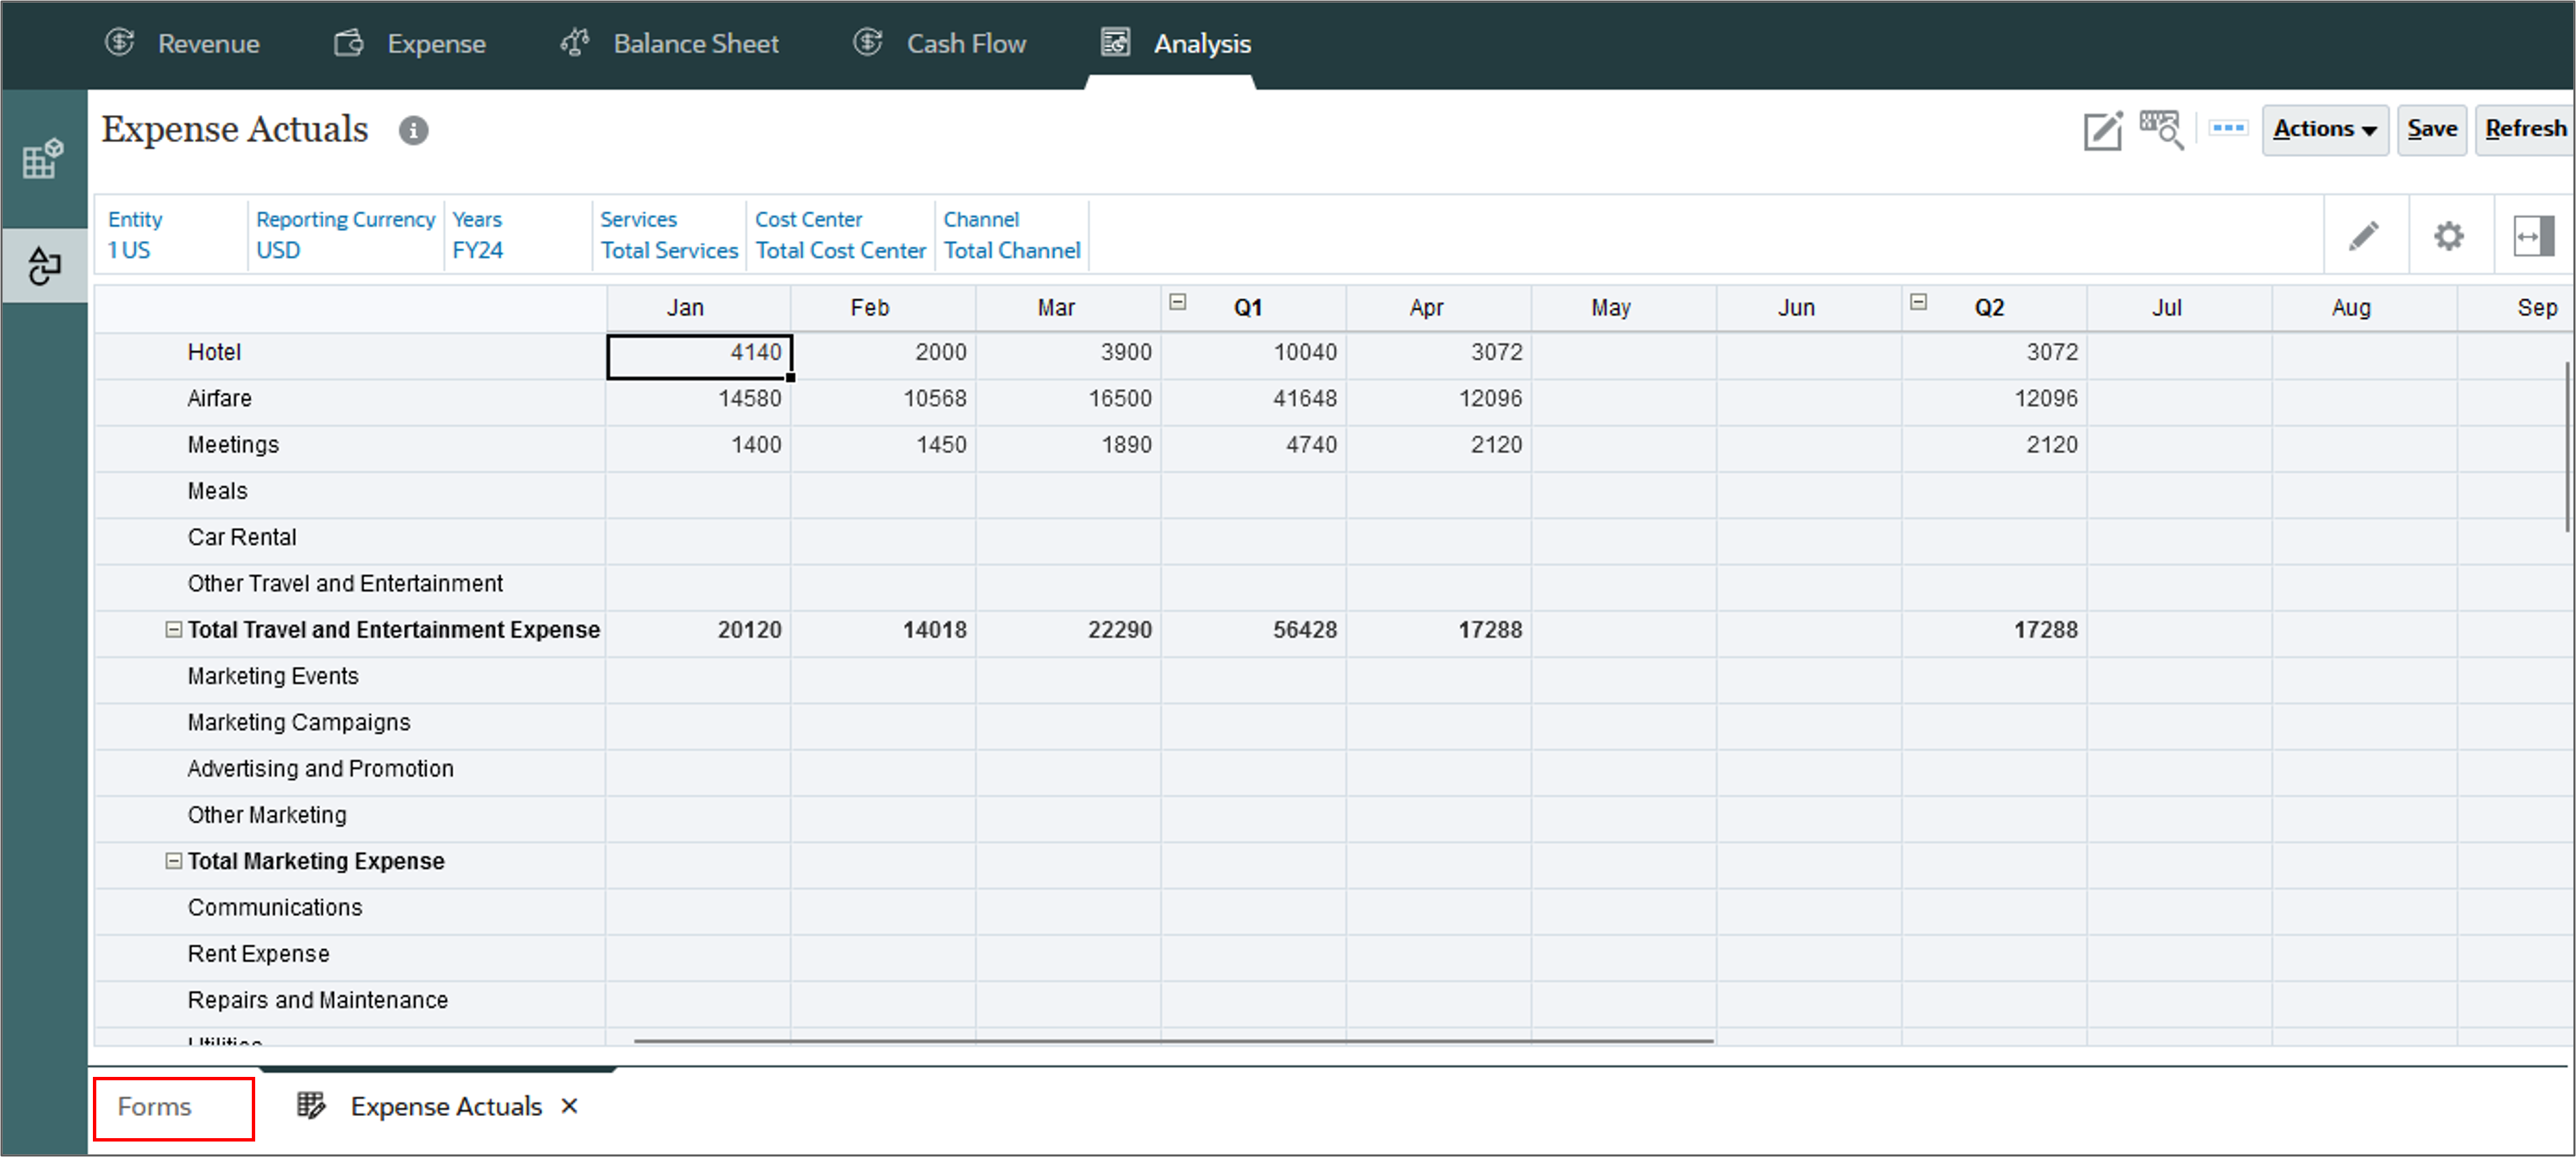
- Click Expense Actuals.
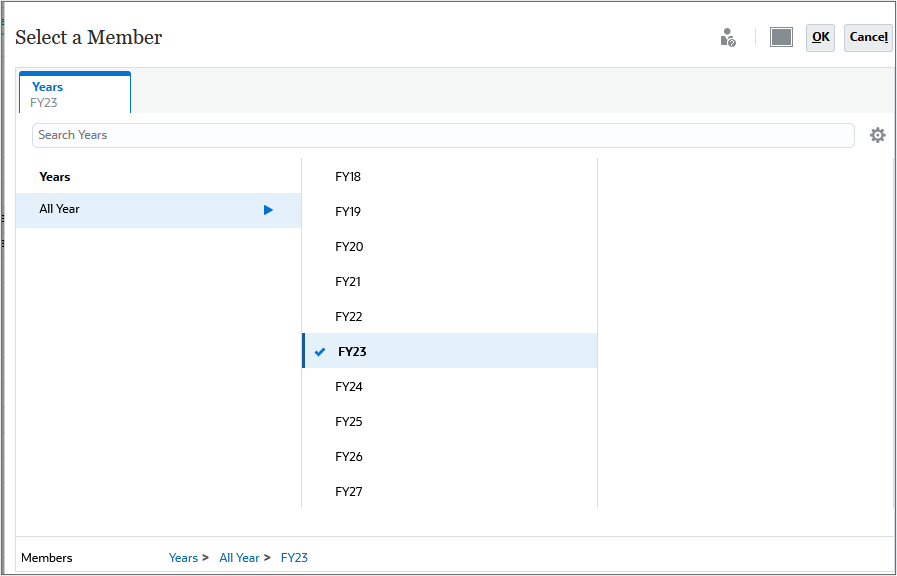
- Click Years, select FY23, and click OK.
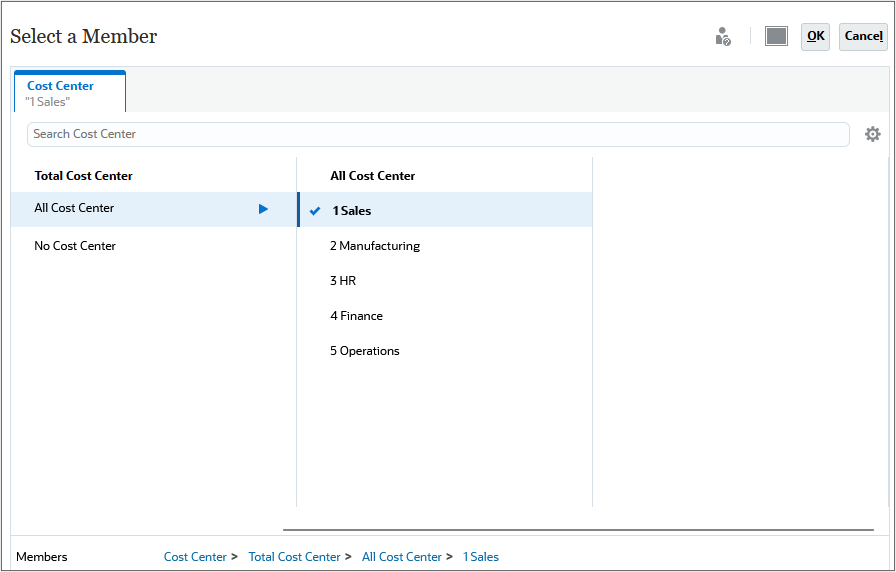
- Click Cost Center, and under All Cost Center, select 1 Sales, and click OK.
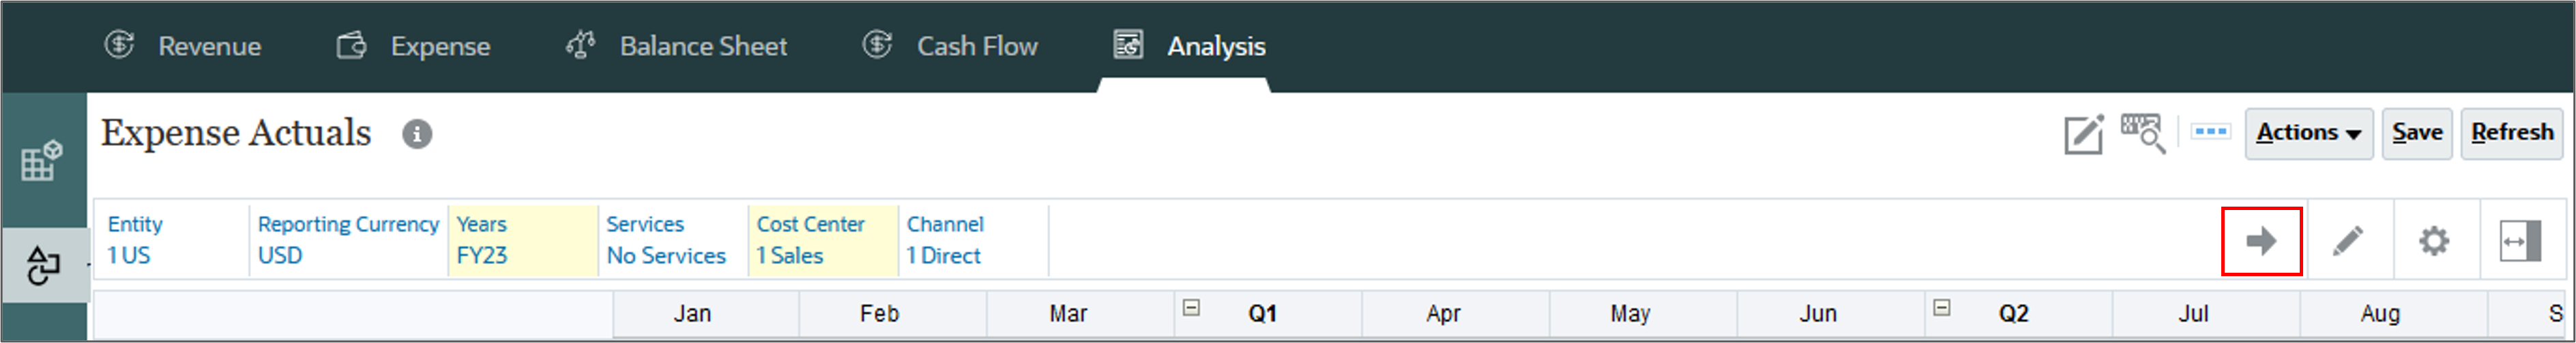
- Click
 (Go).
(Go). - Click Forms at the bottom-left to go back to the Forms page.
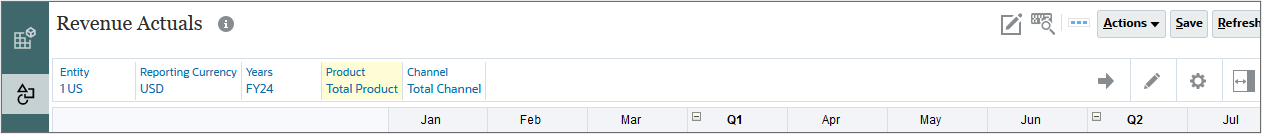
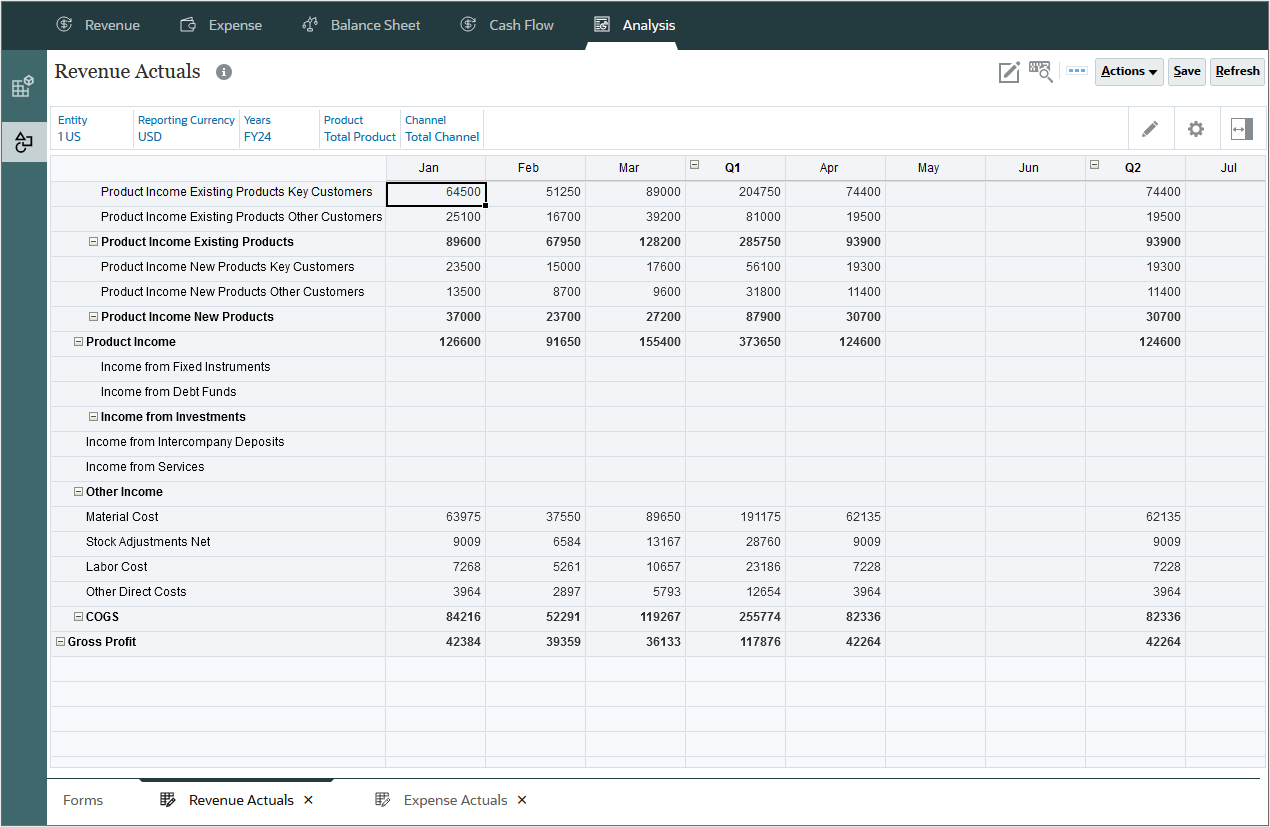
- Click Revenue Actuals.
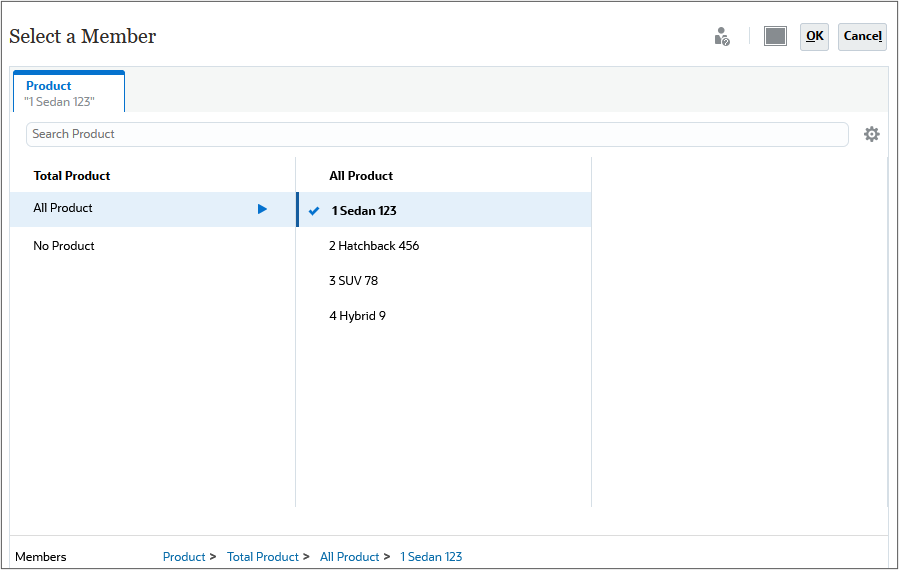
- Click Product, and under All Product, select 1 Sedan 123, and click OK.
- Click (Go).
- Close the Forms.
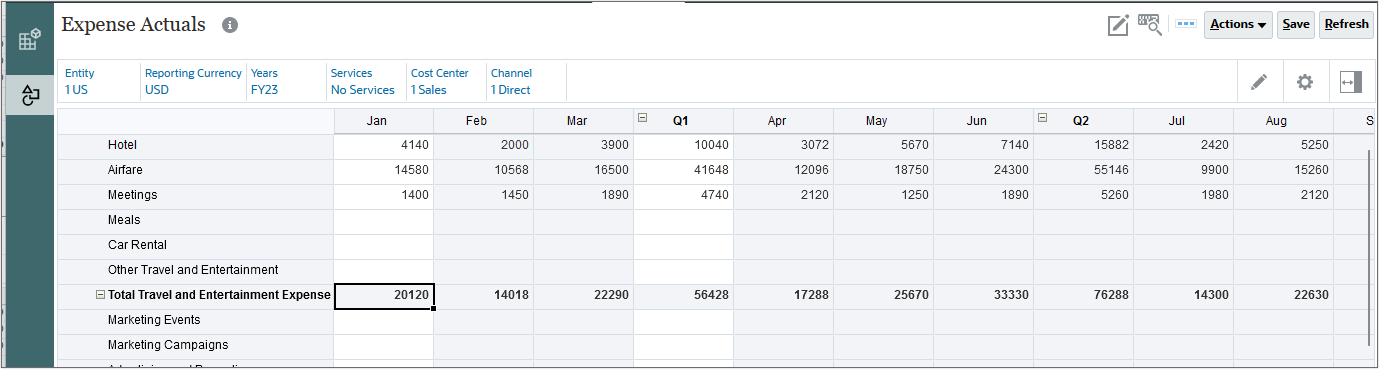
The loaded expense data is displayed.
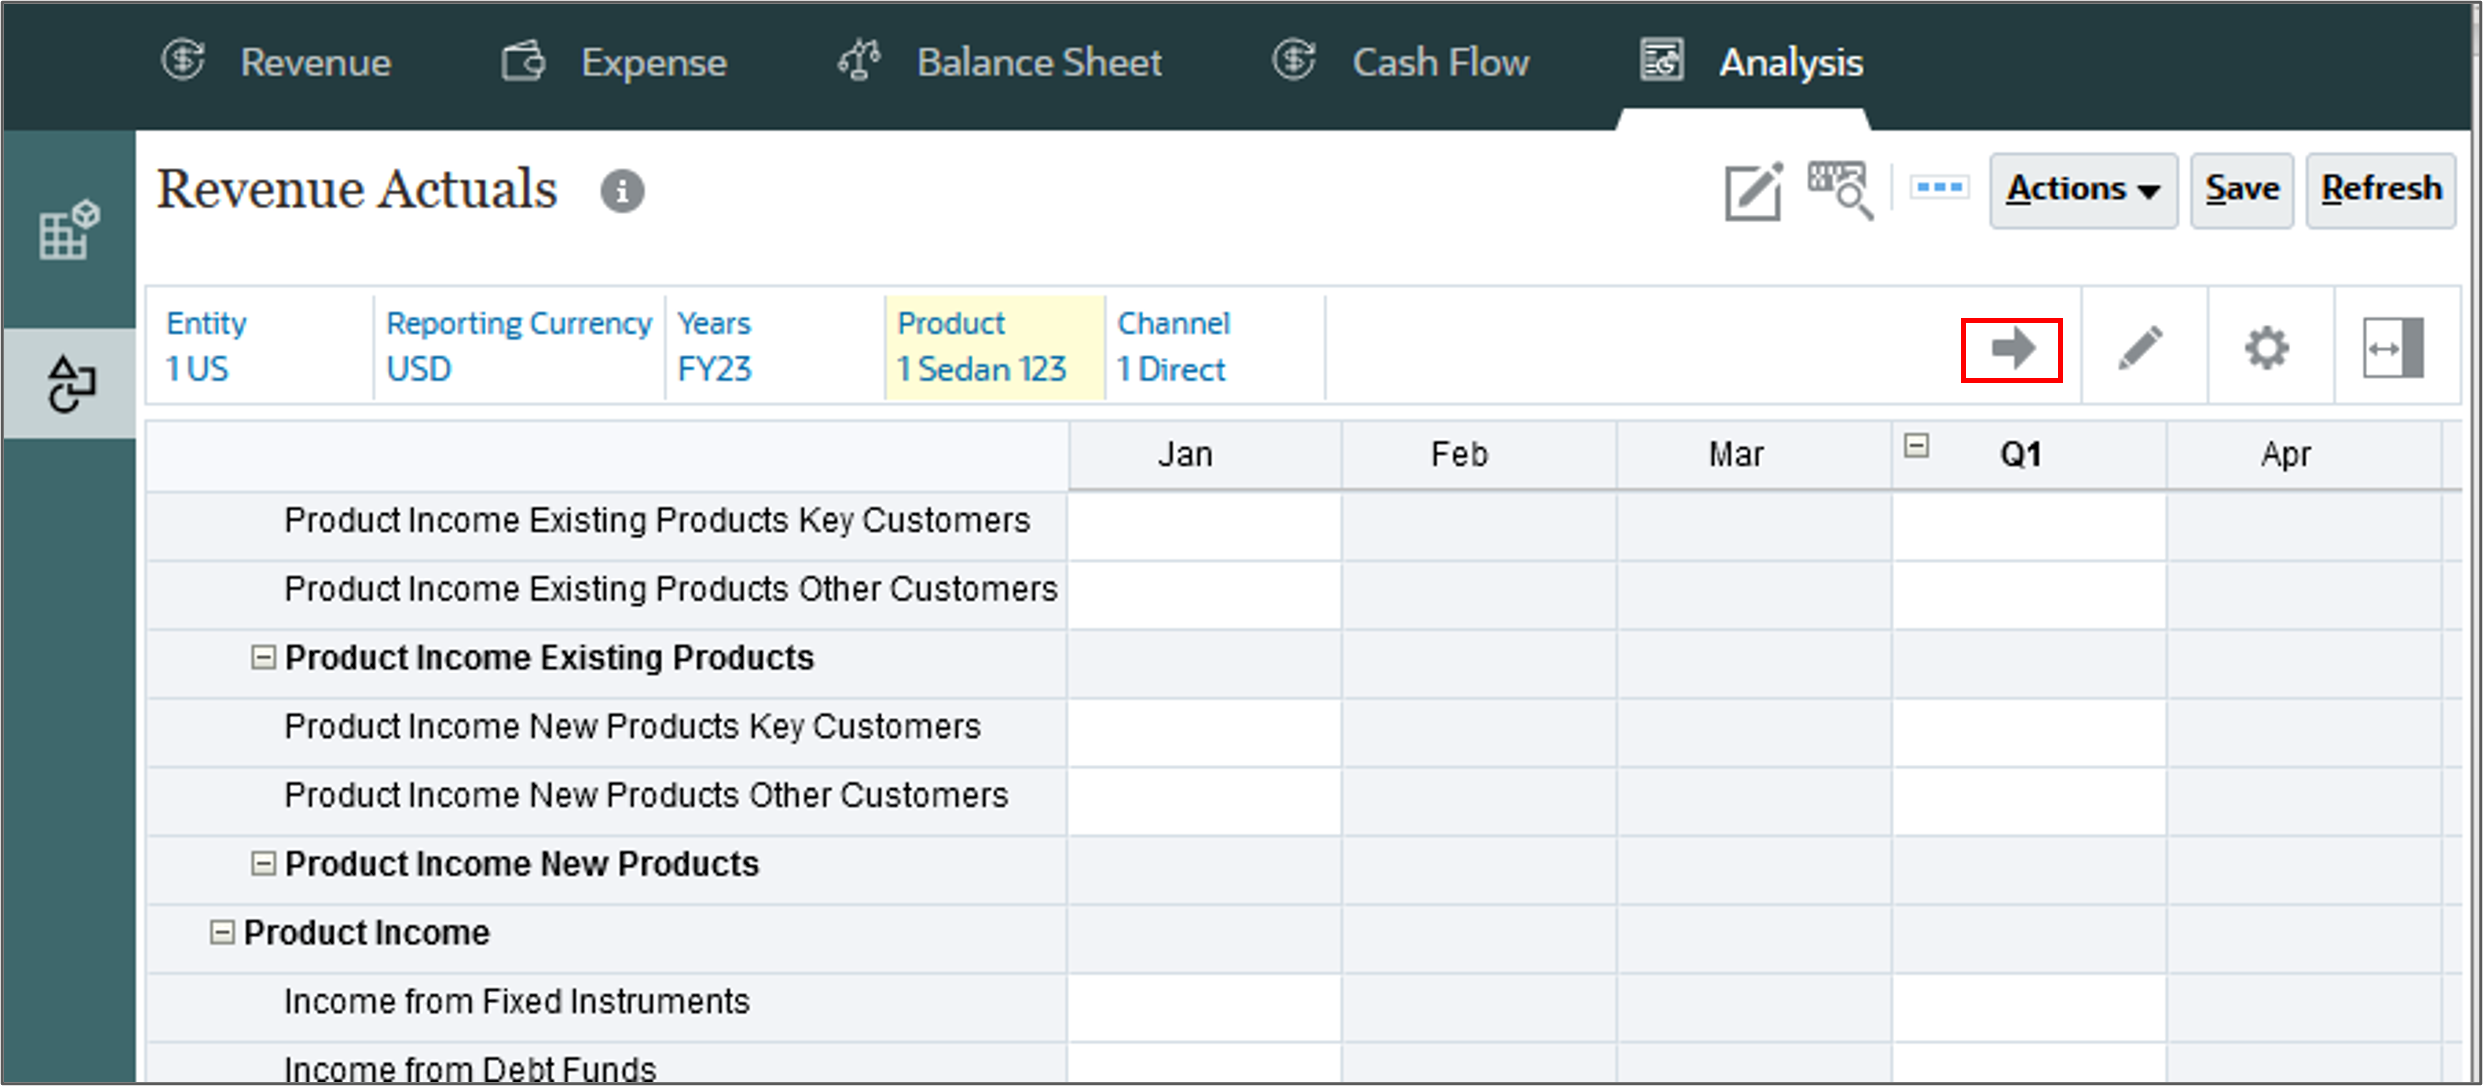
The loaded revenue data is displayed.
Preparing plans
After loading data, you can start preparing plans that can be executed on a calendar based on your organization requirements. Develop planning targets, and set up your budget at the beginning of a calendar or fiscal year, while leaving room for adjustments as revenues grow or decline.
Calculating plans
In this section you calculate all driver and trend based data by running a business rule.
- Click (Navigator), and under Financials, click Rules.
- In the Prepare Plan row, click
 (Launch).
 - For each item, click its
 (Select Member) to select a member as its value, based on the following, and then click Launch:
- Entity: "1 US"
- Currency: USD
- Years: FY24
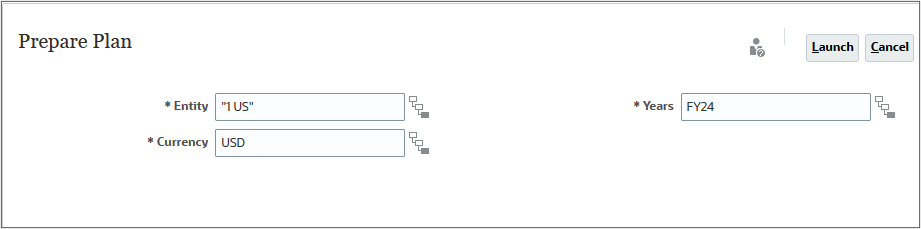
- At the Information message, click OK.
- Click Home.
Planning with revenue trends for products
You can plan revenue based on trends and increase or decrease those values to calculate plan data.
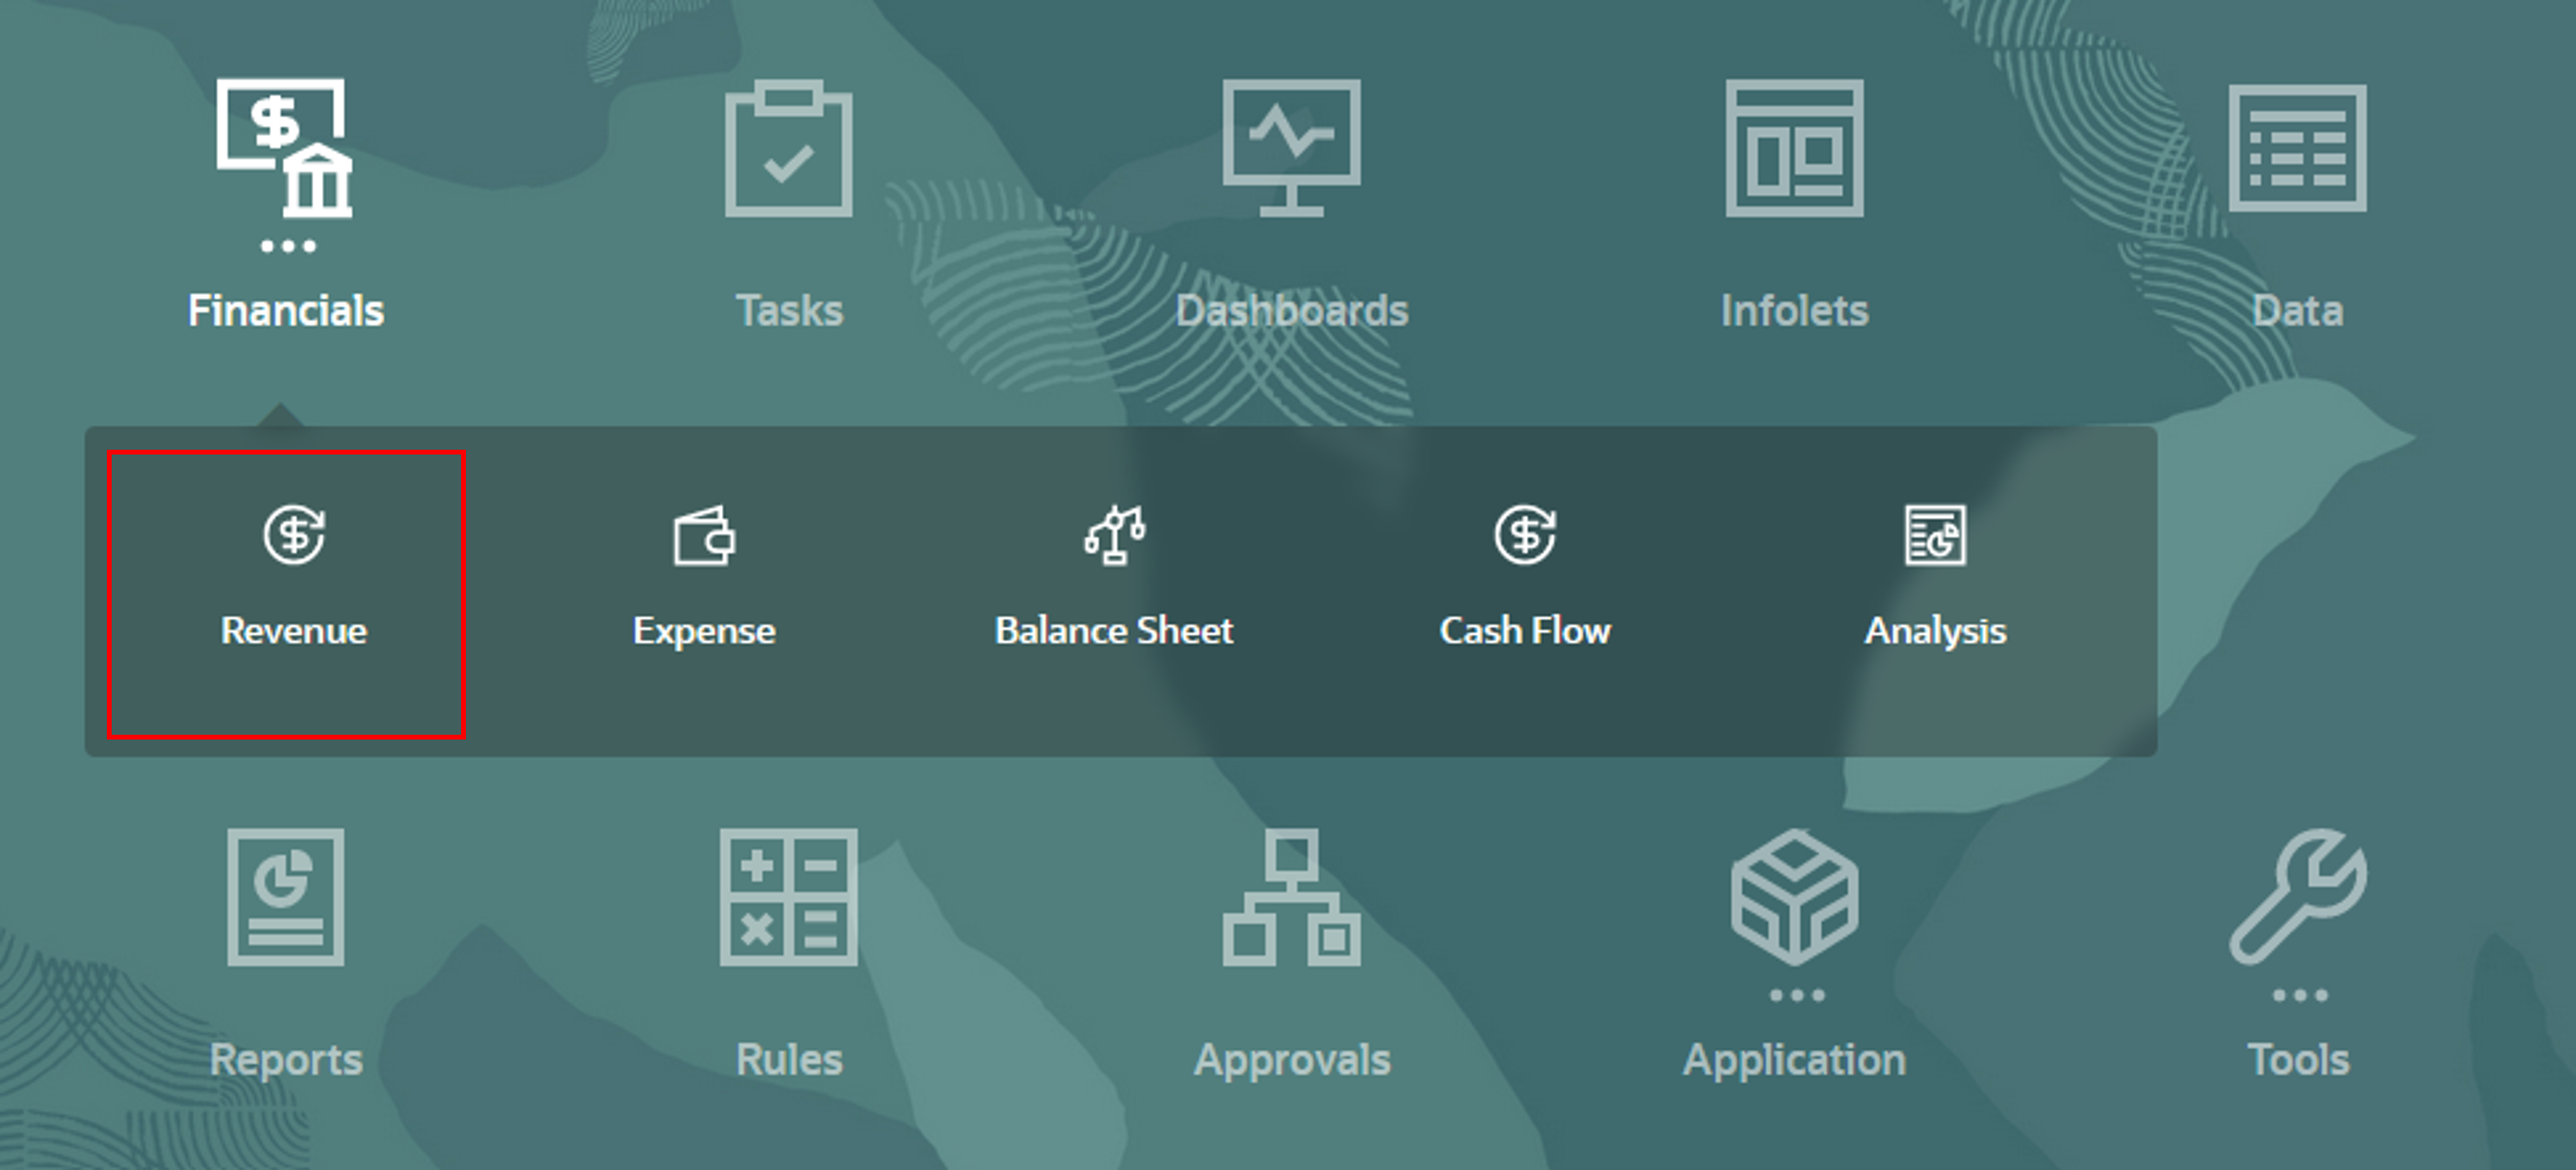
- On the Planning home page, click Financials then Revenue.
- Ensure you are on the Driver and Trend Based vertical tab, and the Trend Based Revenue Planning horizontal tab.
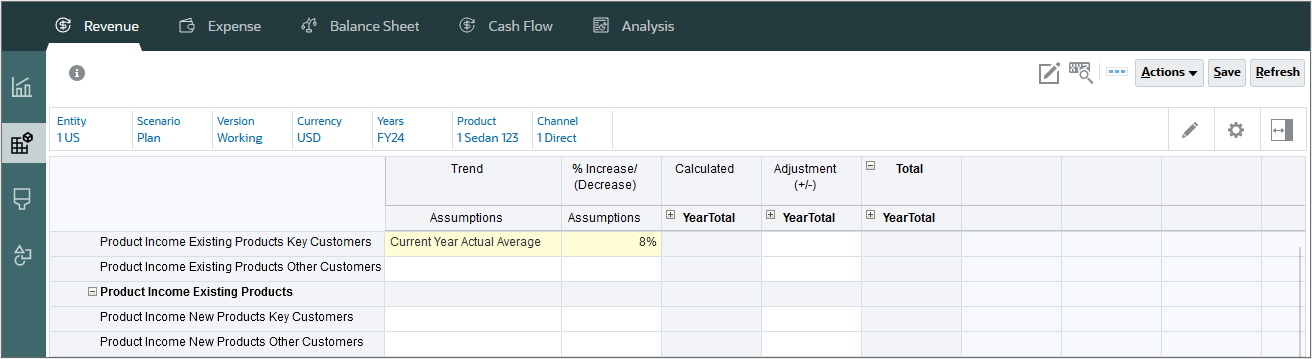
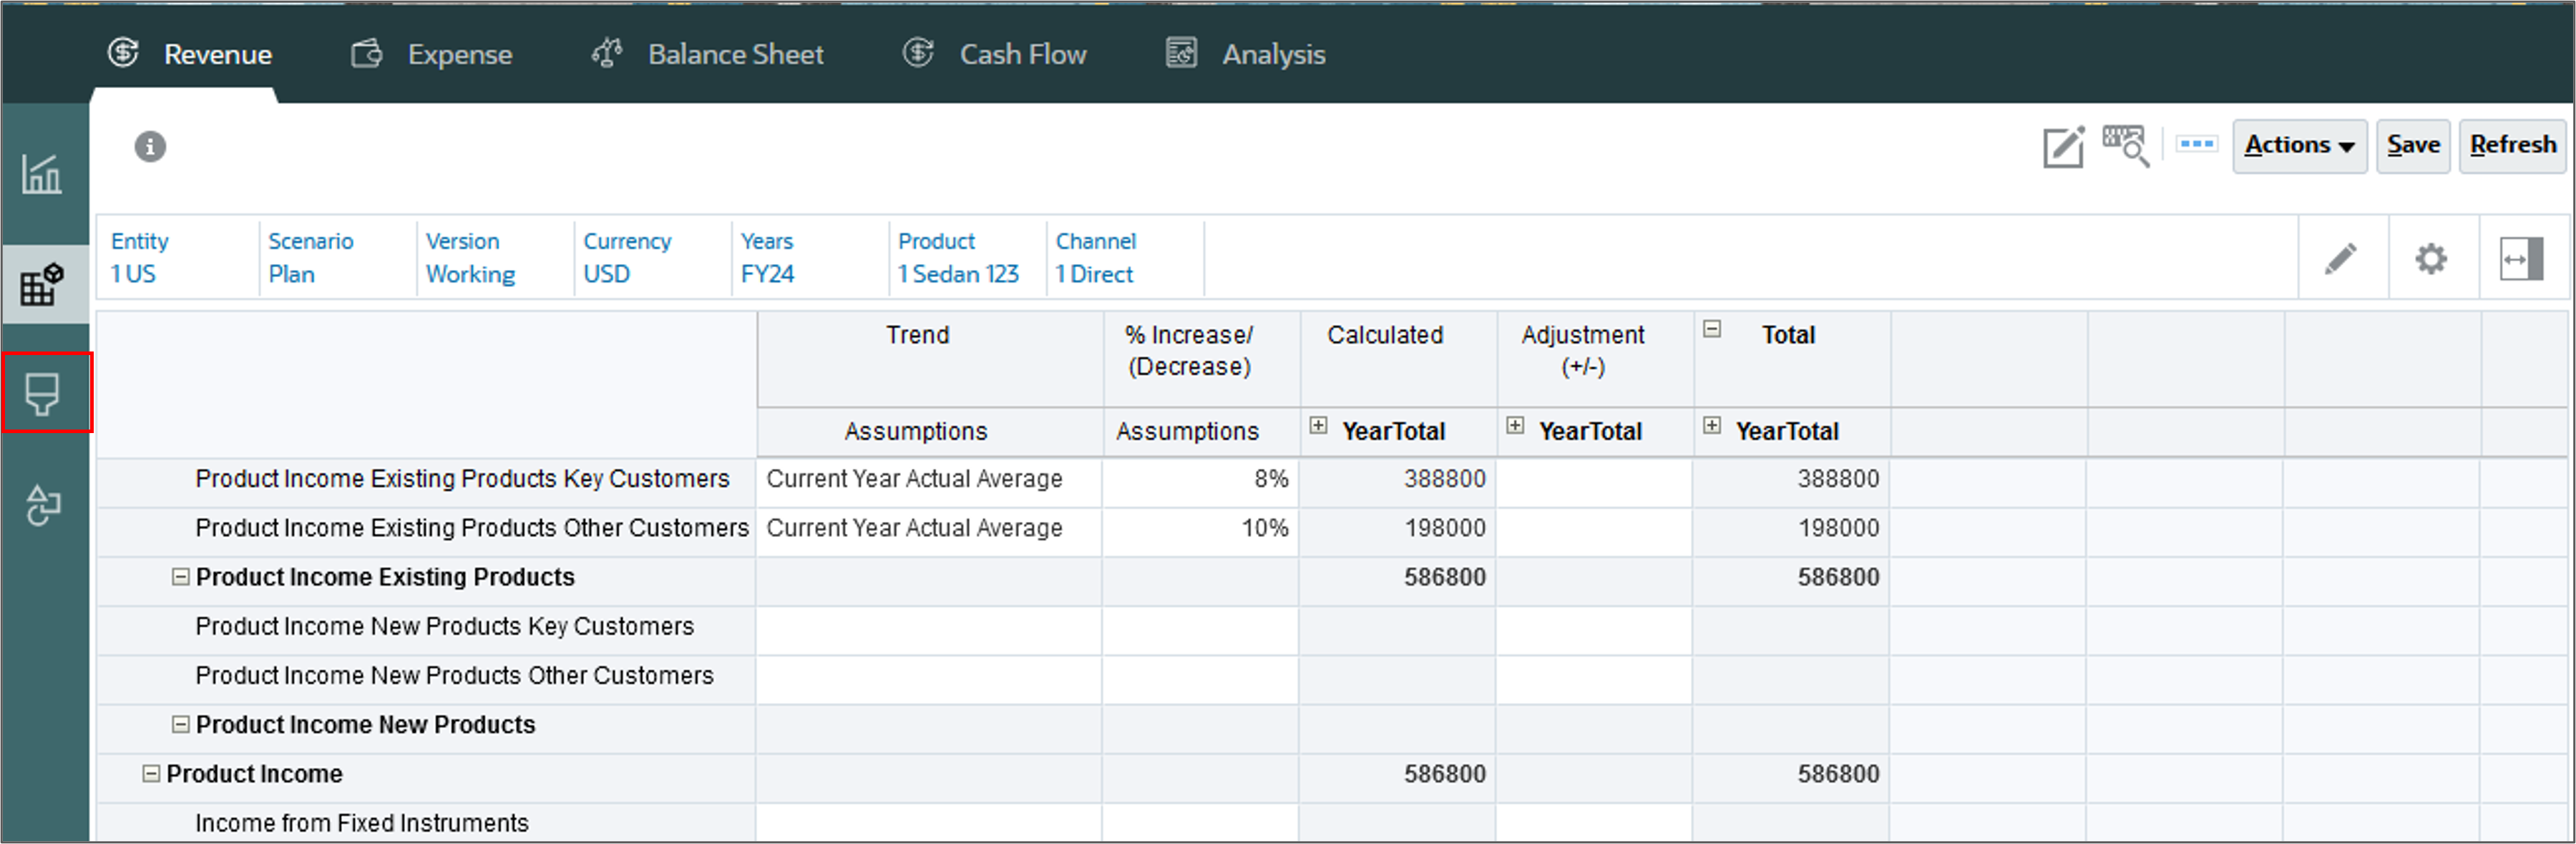
- In the POV, for Years, select FY24, and click (Go):
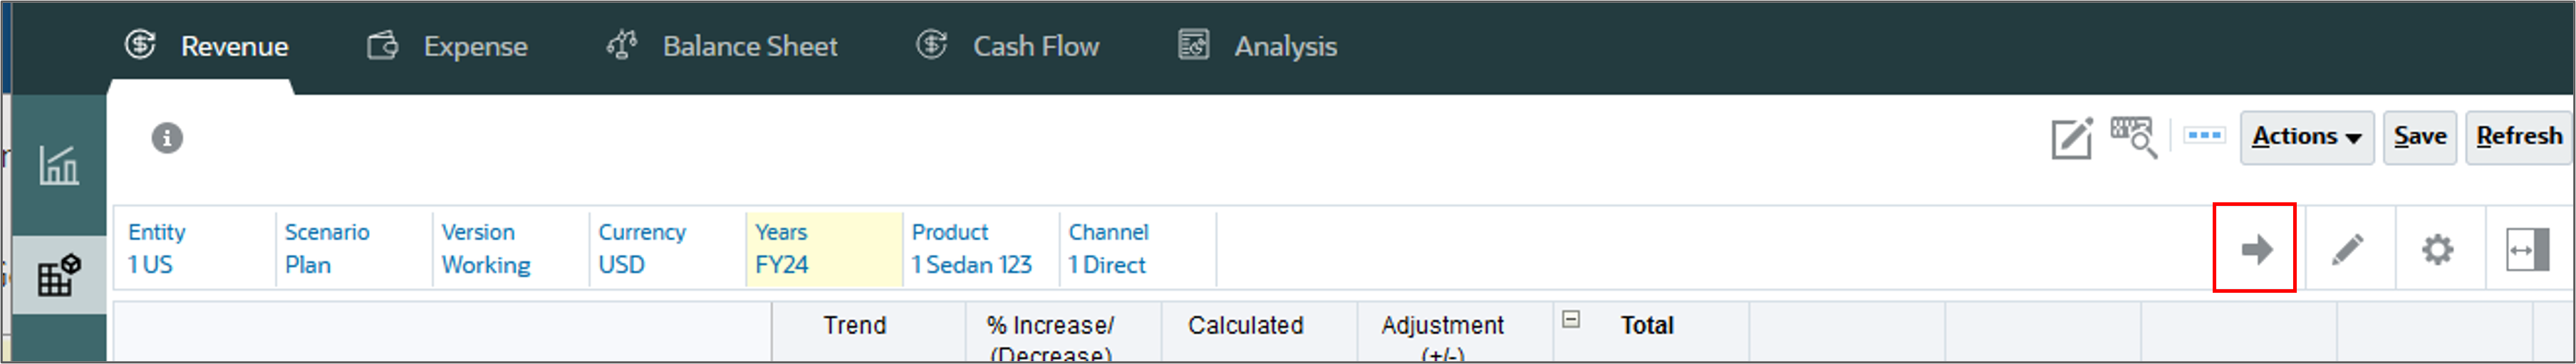
- For Product Income Existing Products Key Customers, in Trend Assumptions, select Current Year Actual Average.
- For Product Income Existing Products Key Customers, in %Increase/(Decrease), enter 8%.
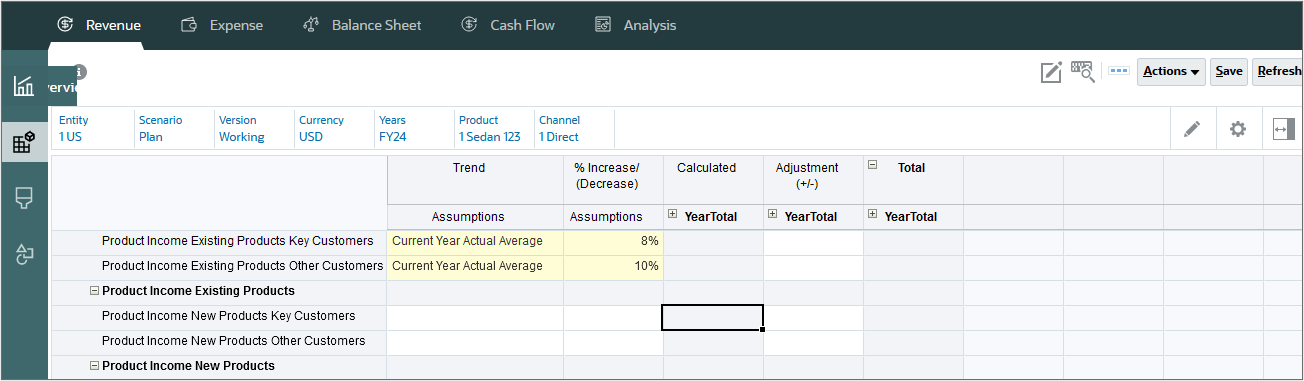
- For Product Income Existing Products Other Customers, in Trend Assumptions, select Current Year Actual Average, and for Product Income Existing Products Other Customers, in %Increase/(Decrease), enter 10%.
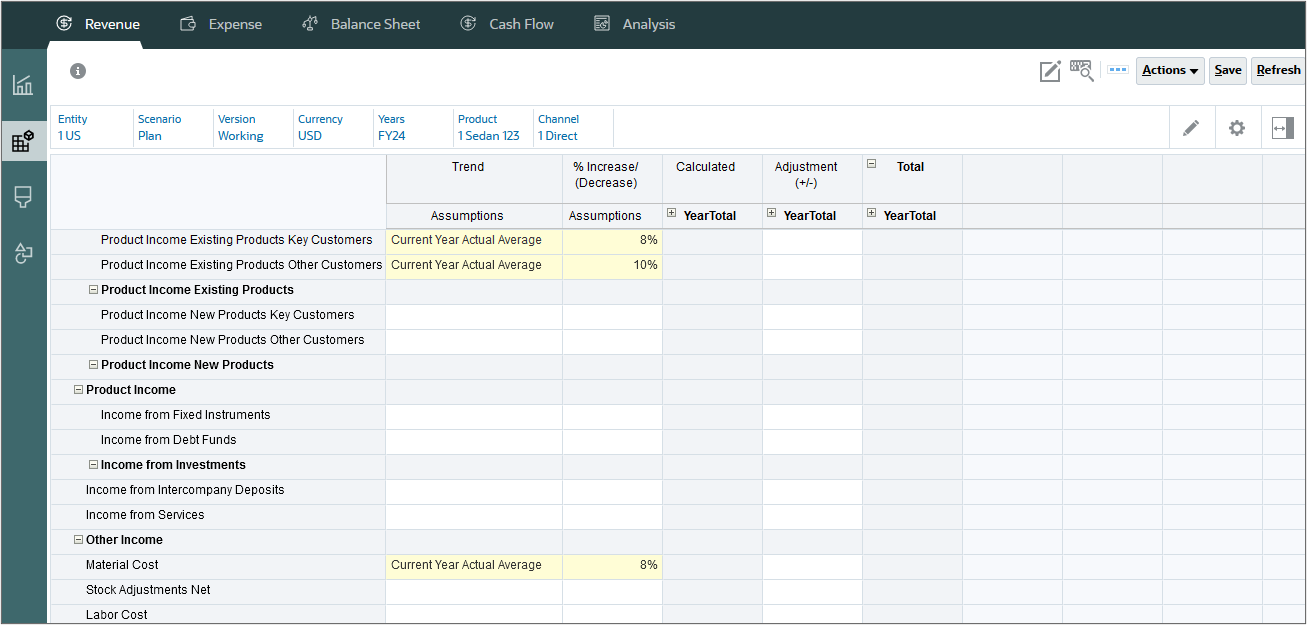
- For Material Cost, in Trend Assumptions, select Current Year Actual Average, and in %Increase/(Decrease), enter 8%.
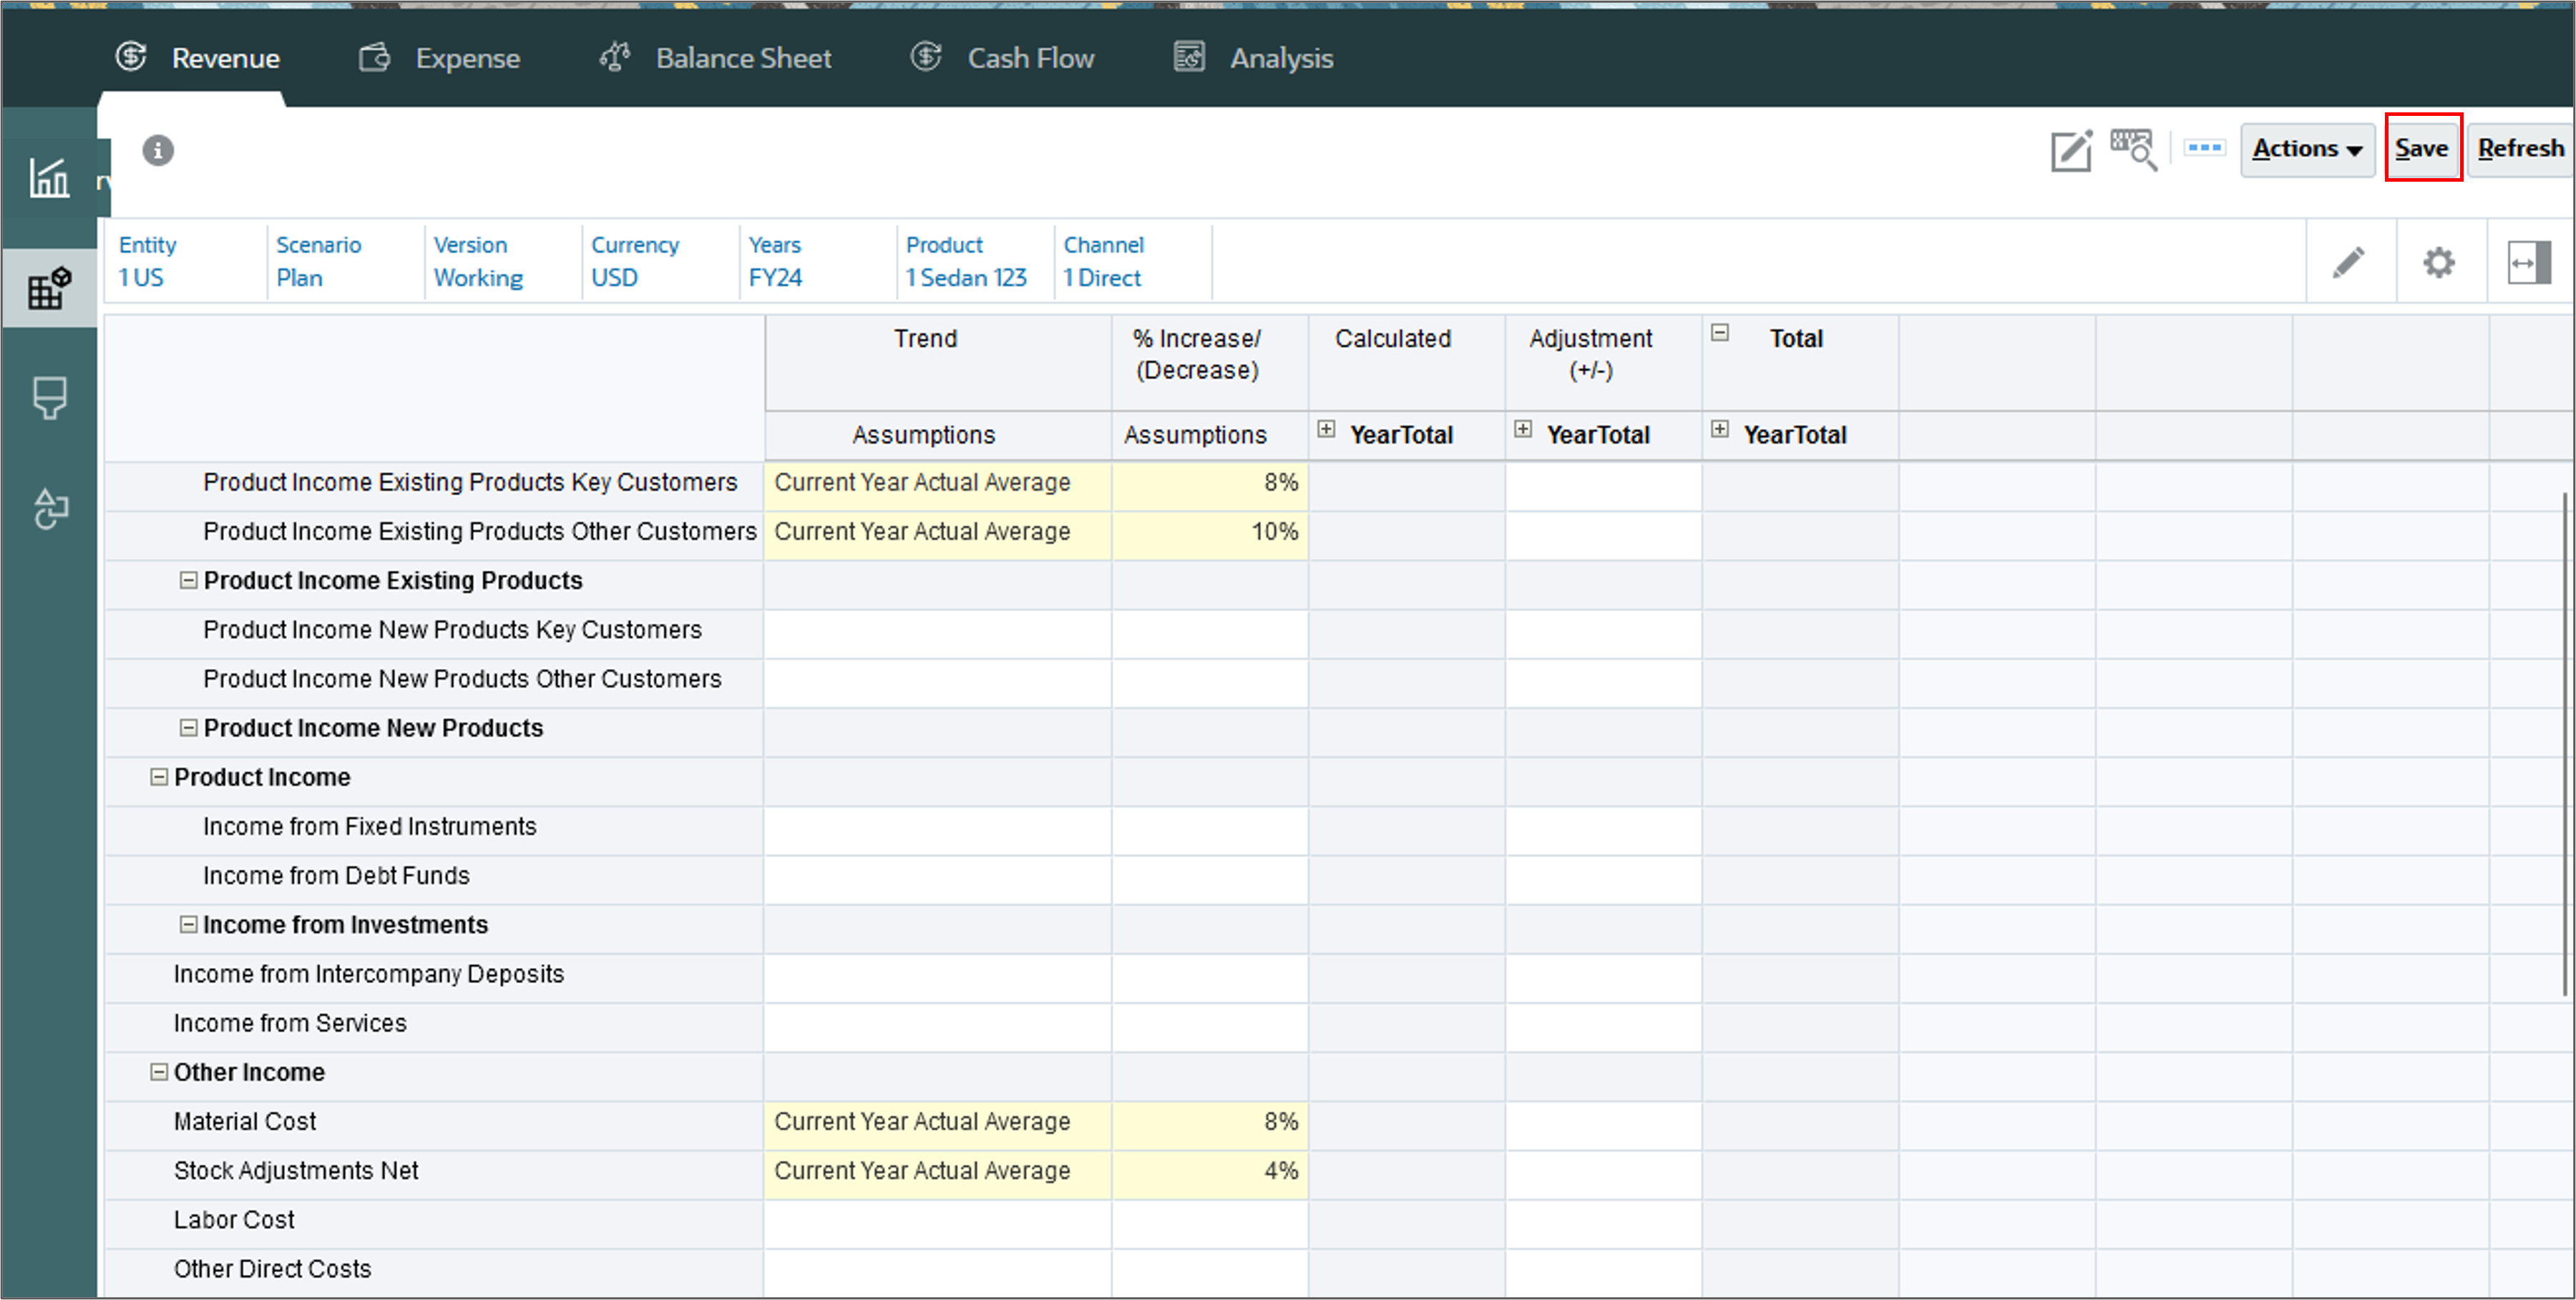
- For Stock Adjustments Net, in Trend Assumptions, select Current Year Actual Average, and for Stock Adjustments Net, in %Increase/(Decrease), enter 4% and click Save.
- At the Information message, click OK.
Planning for new products
For new products, you can plan using direct entry since there is no historical data available.
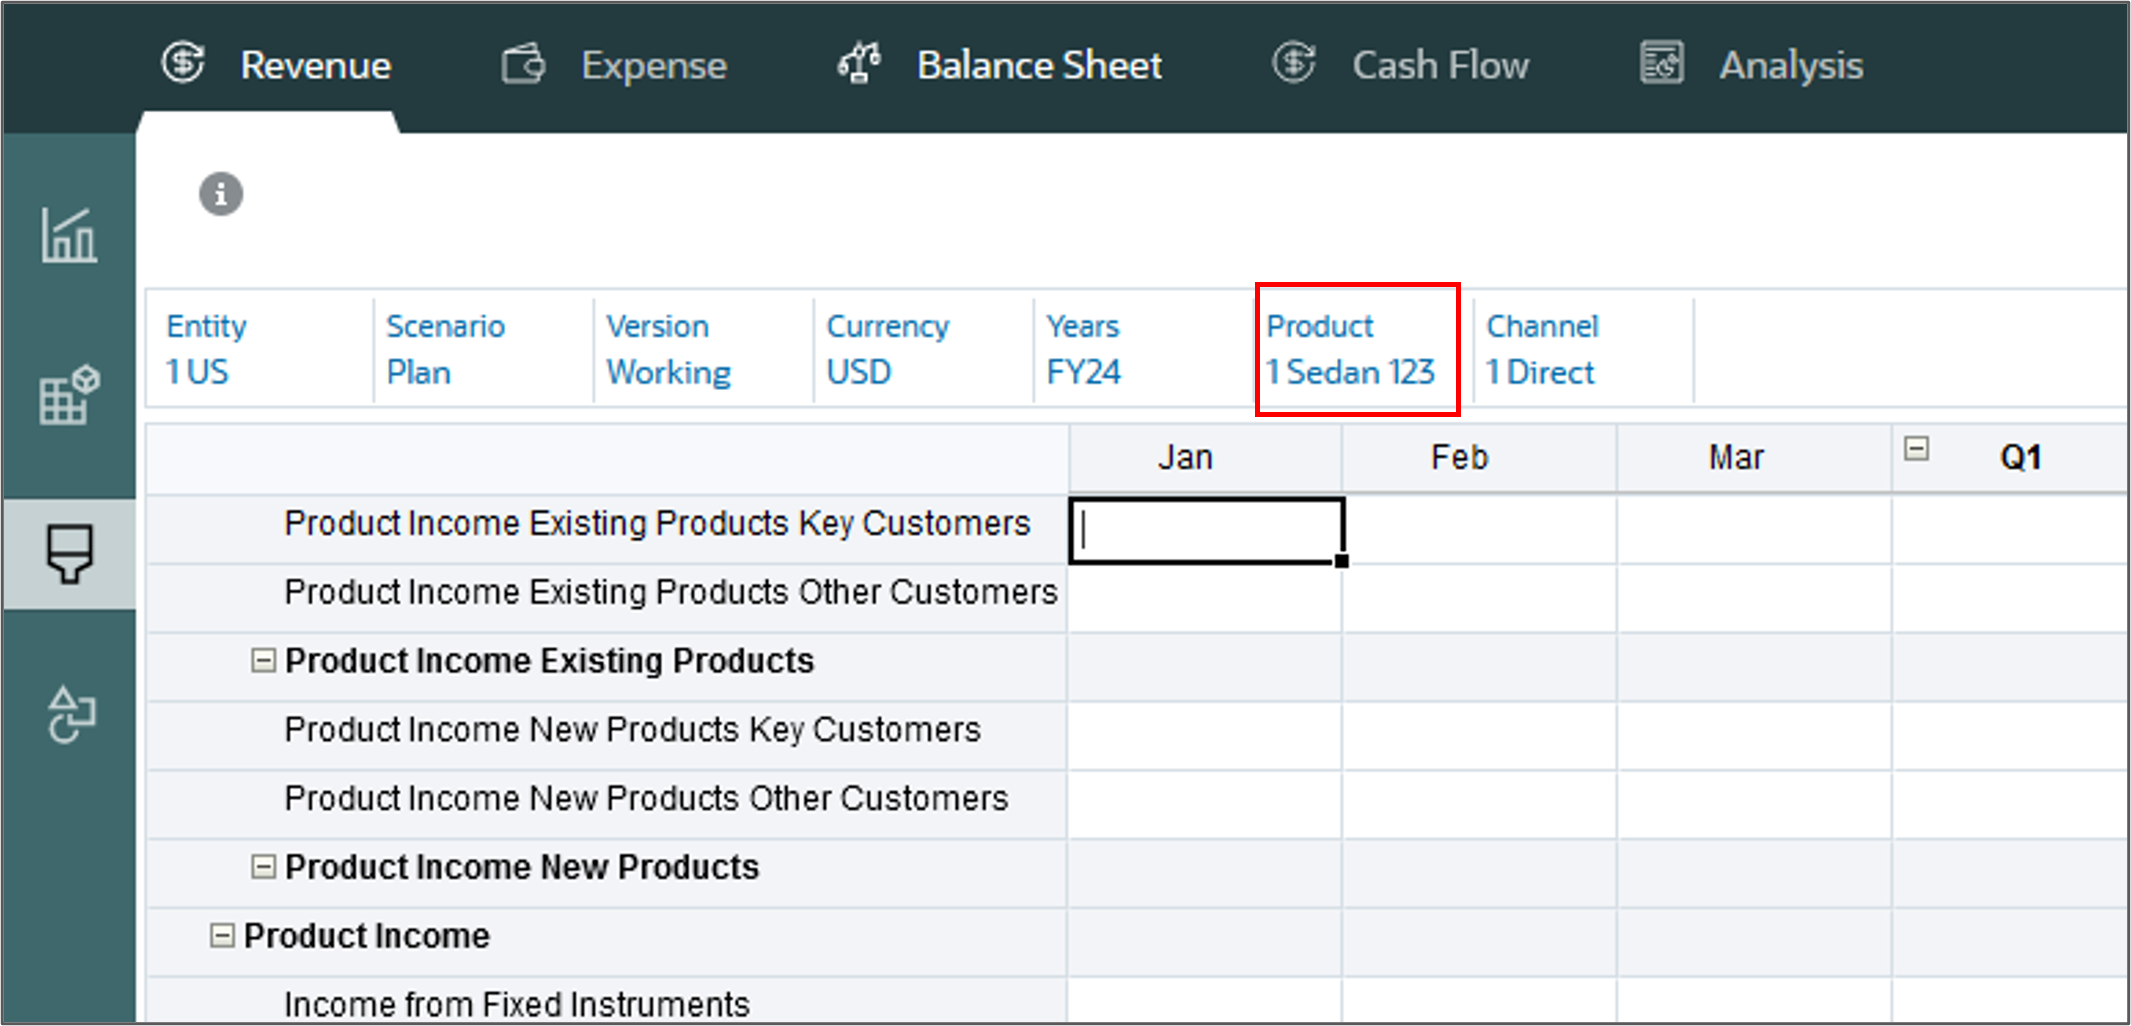
- On the left, click the Direct Entry vertical tab.
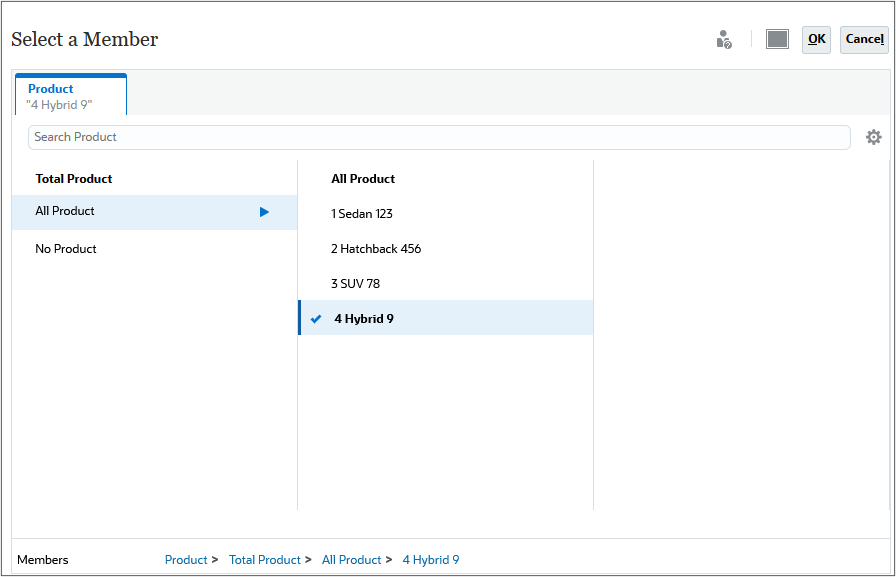
- Click Product.
- Under All Product, select 4 Hybrid 9, and click OK.
- Click (Go).
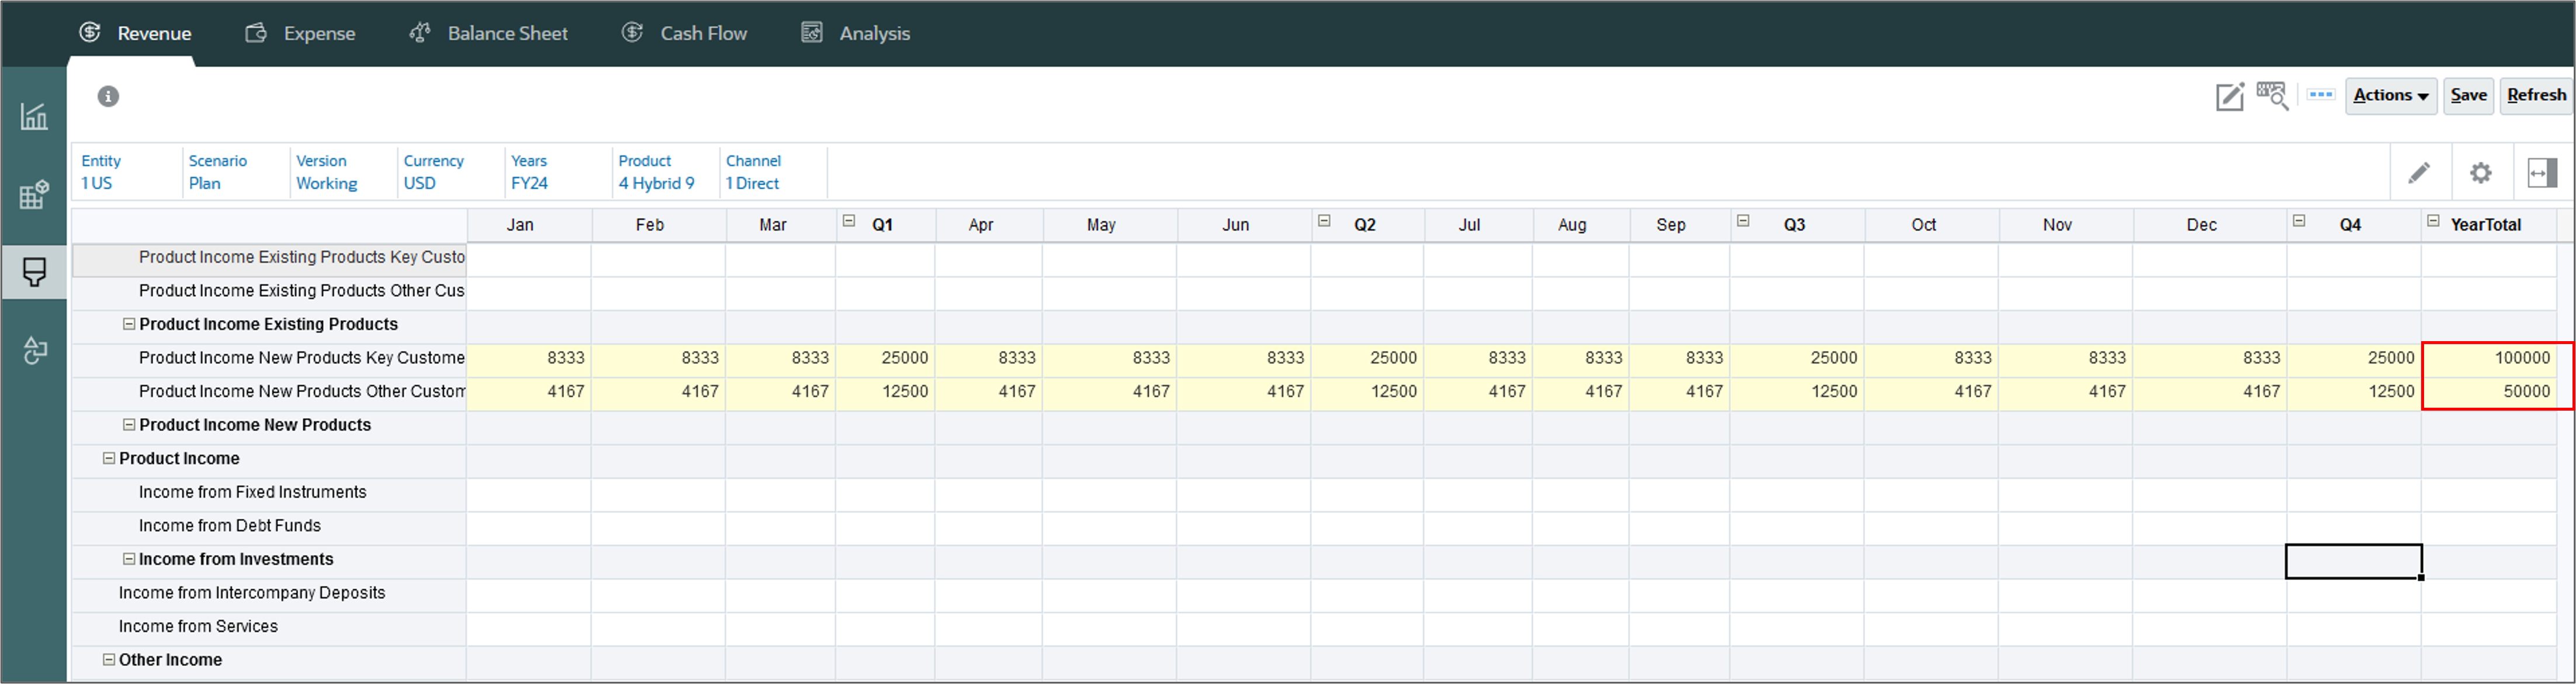
- For Product Income New Products Key Customers, in YearTotal, enter 100k.
- Click Save to see the loaded data.
For Product Income New Products Other Customers, in YearTotal, enter 50k.
Planning for driver based expenses
In this section you plan expenses with drivers.
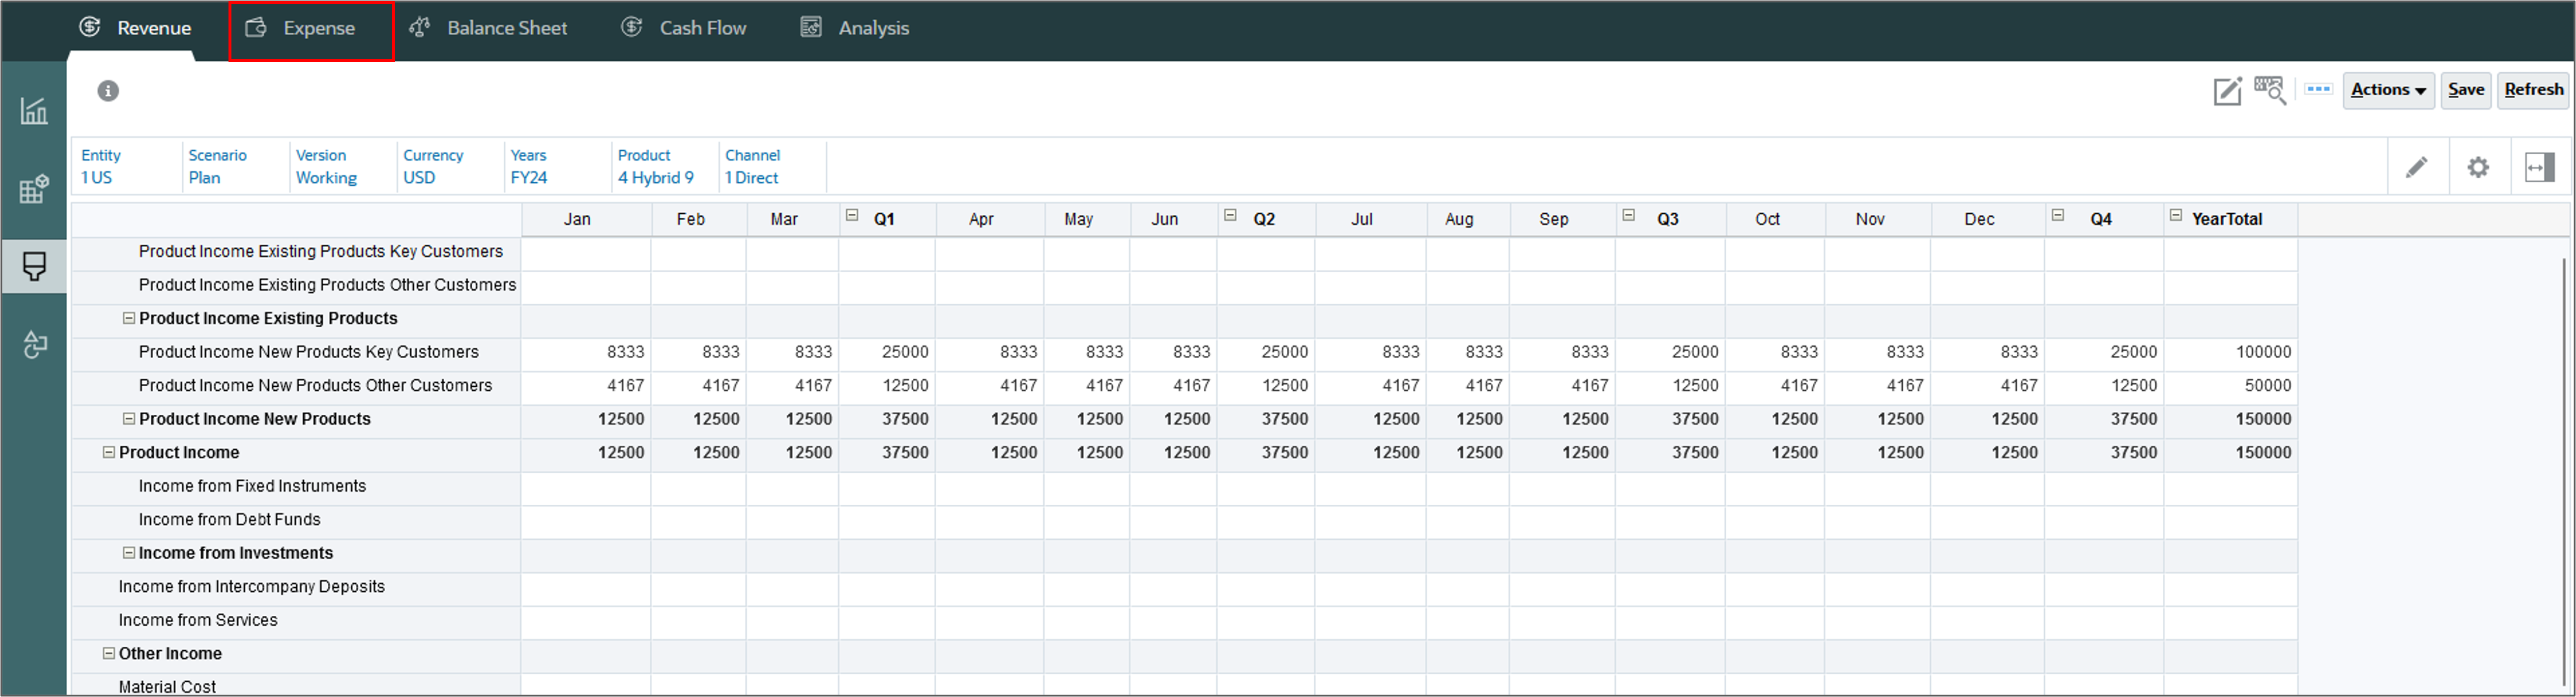
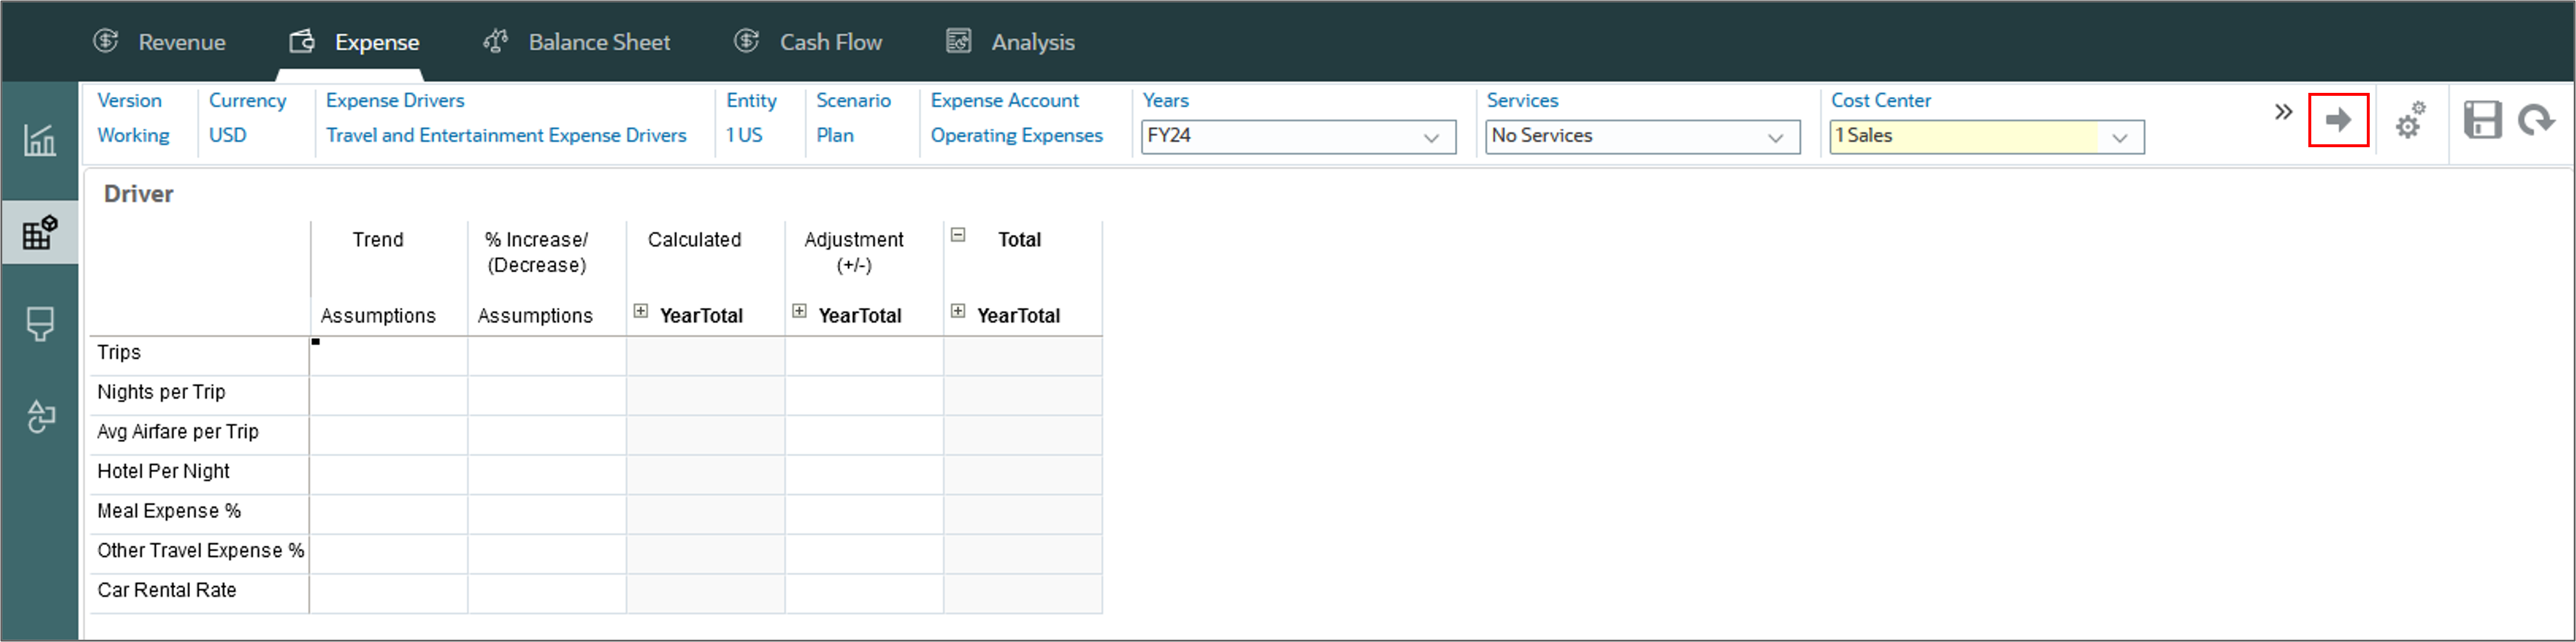
- Click Expense.
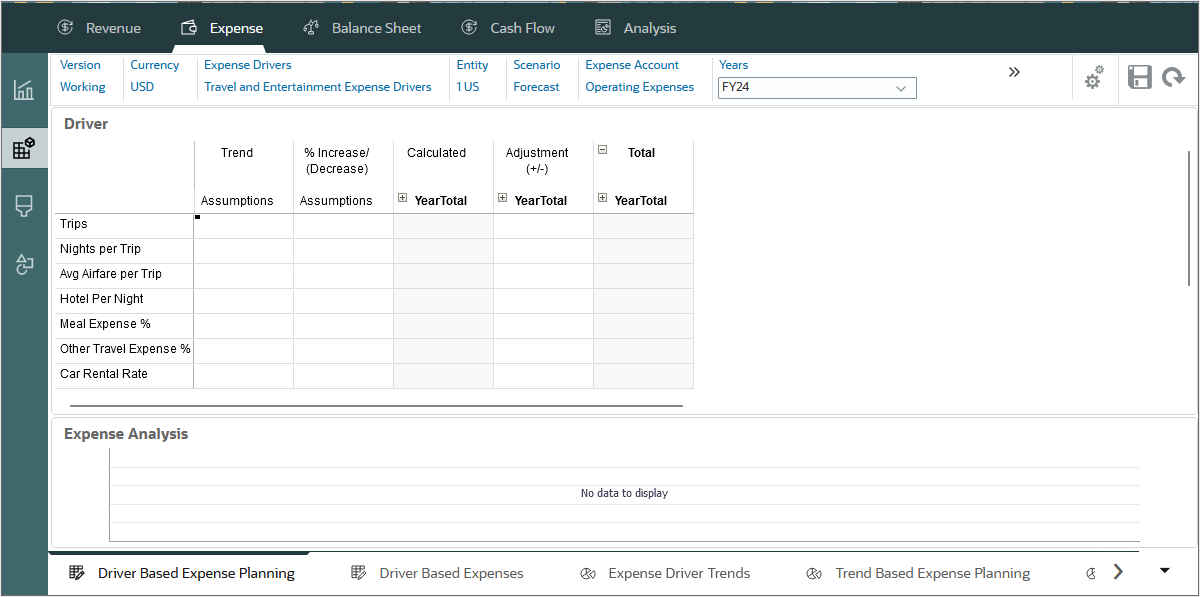
- On the left, select the Driver and Trend Based vertical tab.
- Notice that Cost Center is in the POV and for Cost Center, select 1 Sales, and click (Go).
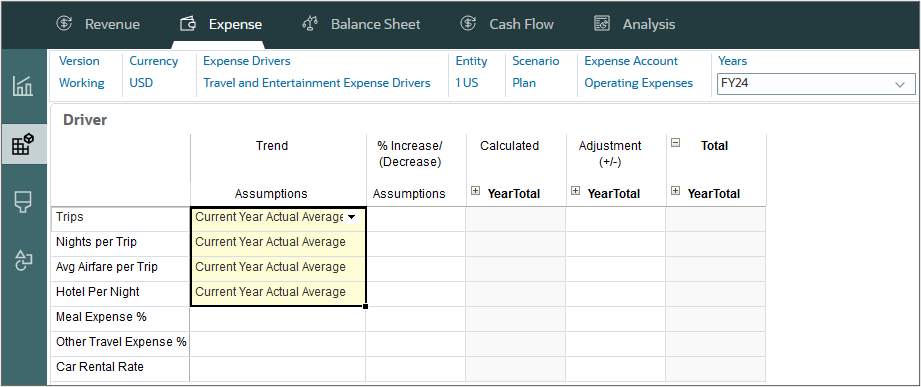
- For Trips, Nights per Trip, Avg Airfare per Trip, and Hotel Per Night, in Trend Assumptions, select Current Year Actual Average.
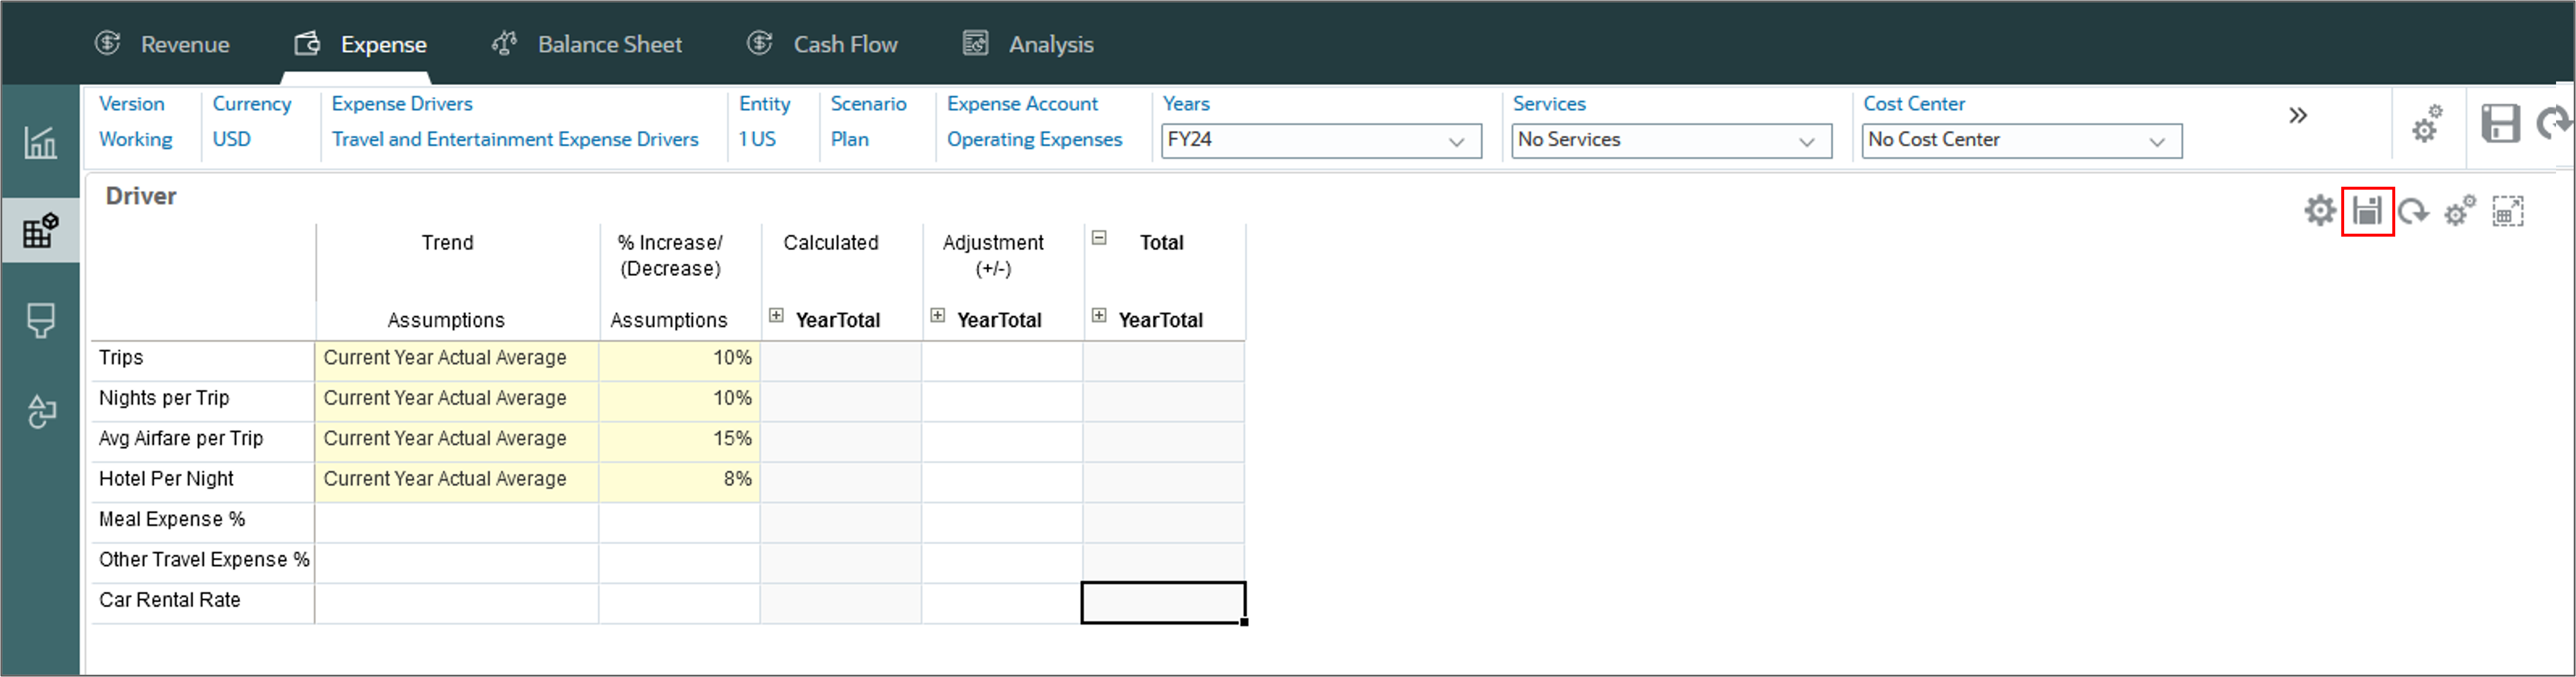
- For Trips, Nights per Trip, Avg Airfare per Trip, and Hotel Per Night, in %Increase/(Decrease), enter the following:
- Trips: 10%
- Nights per Trip: 10%
- Avg Airfare per Trip: 15%
- Hotel Per Night: 8%
- Click Save.
- At the Information message, click OK.
- Click the Driver Based Expenses horizontal tab to verify driver based expenses.
Ensure the Driver Based Expense Planning horizontal tab is selected.

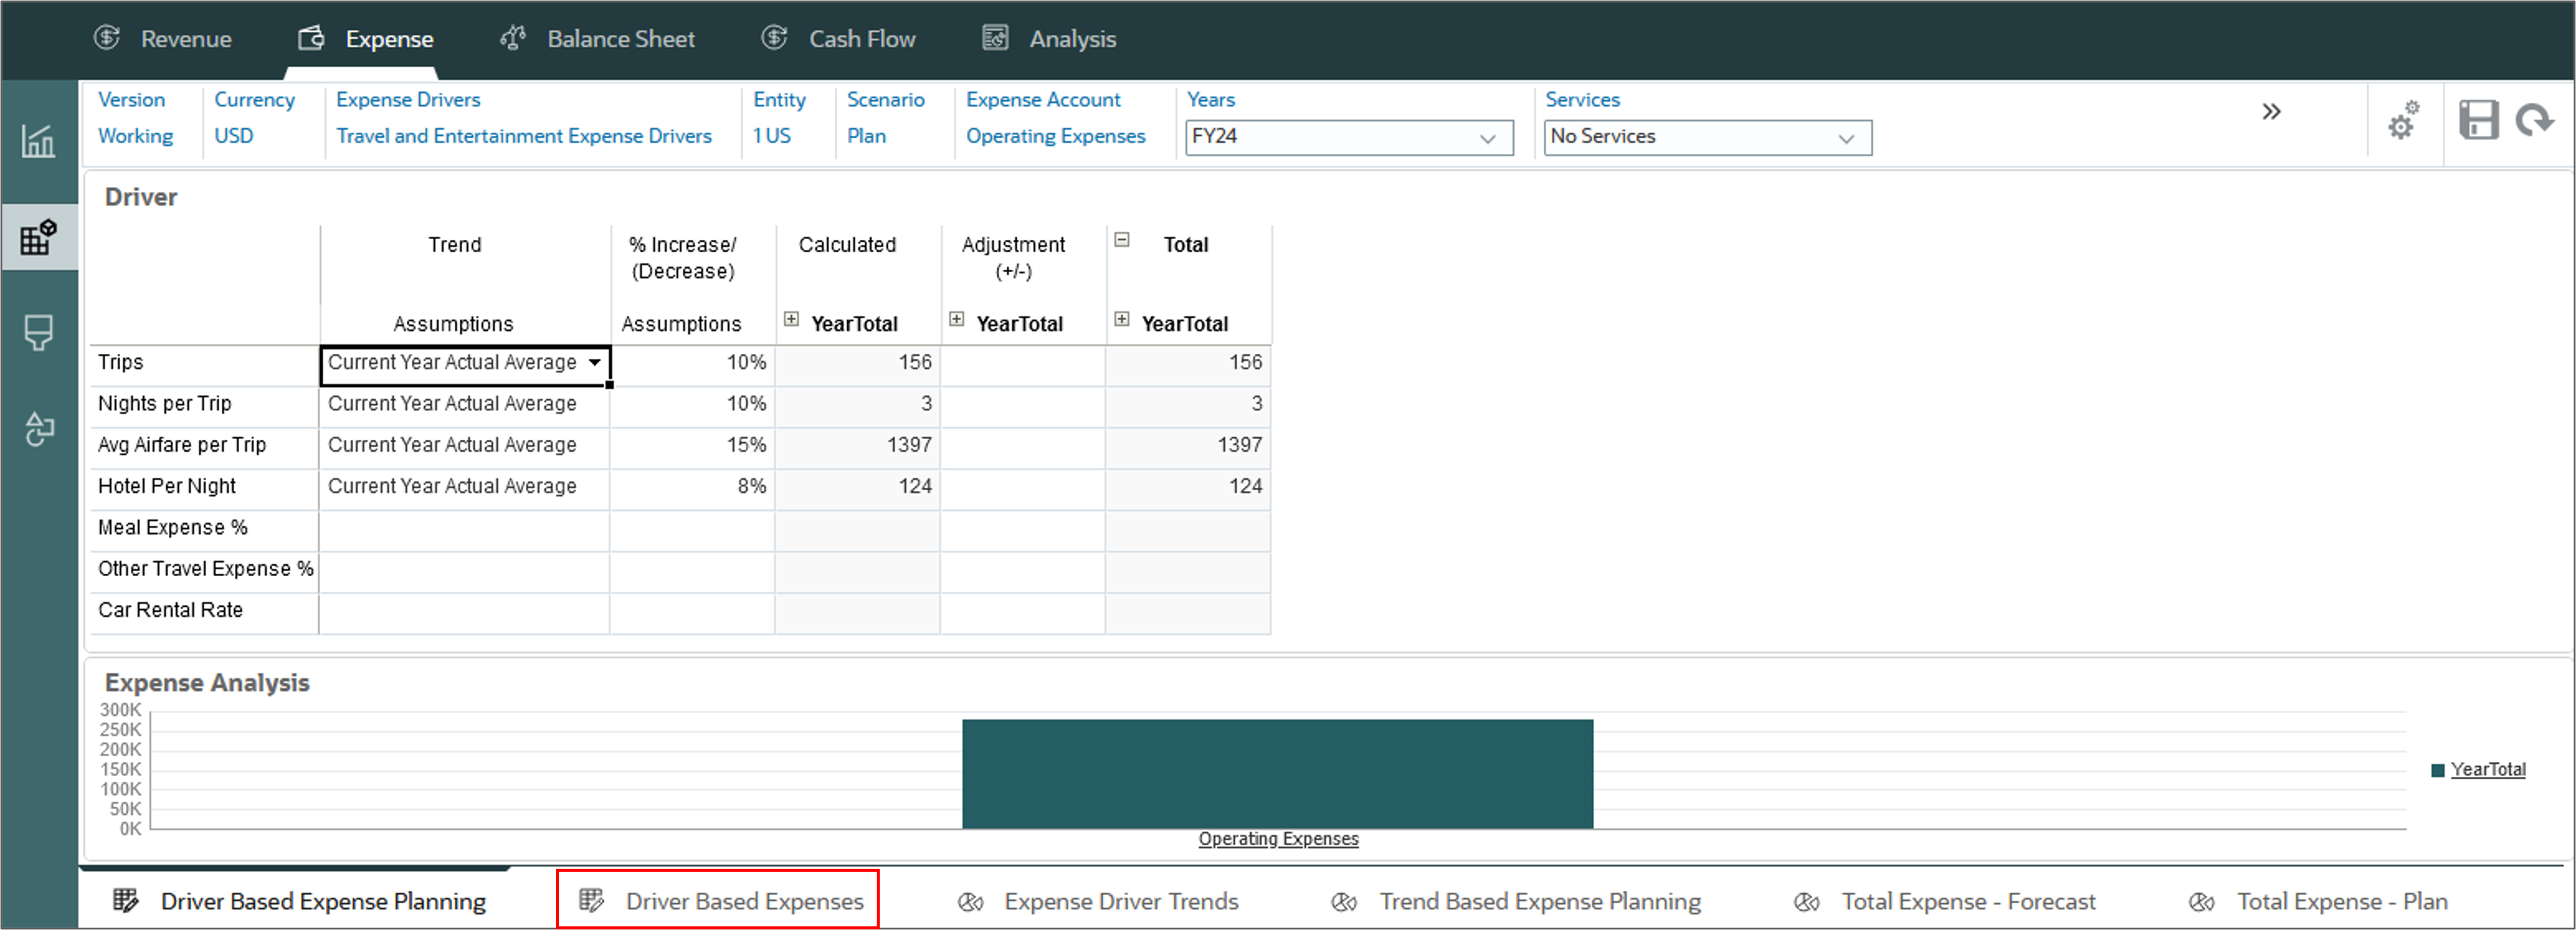
The driver based expenses are displayed.
Planning expenses directly
In this section, you plan expenses directly.
- On the left, click the Direct Entry vertical tab.
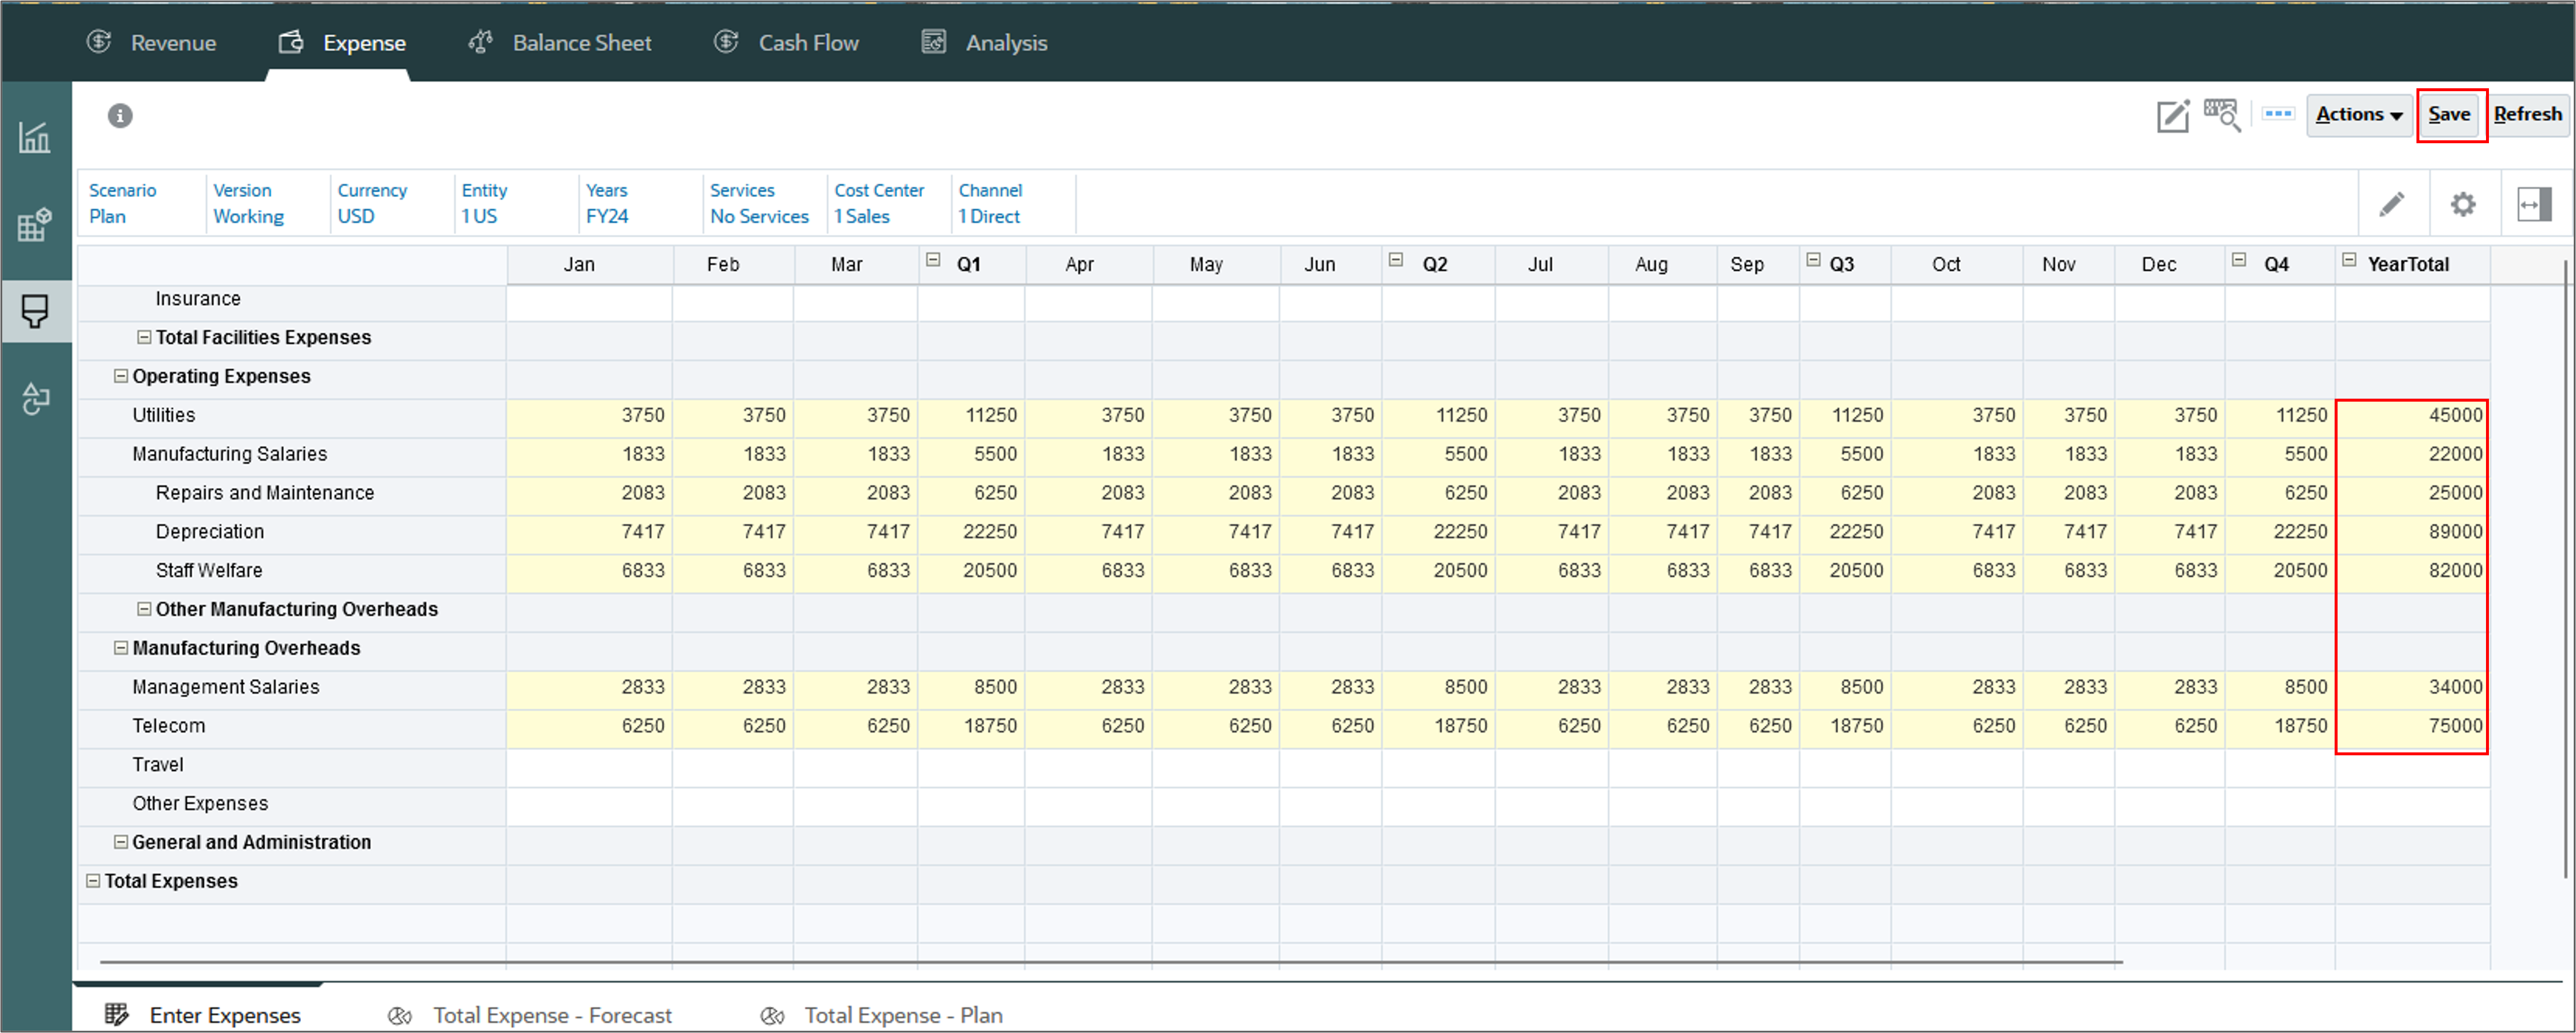
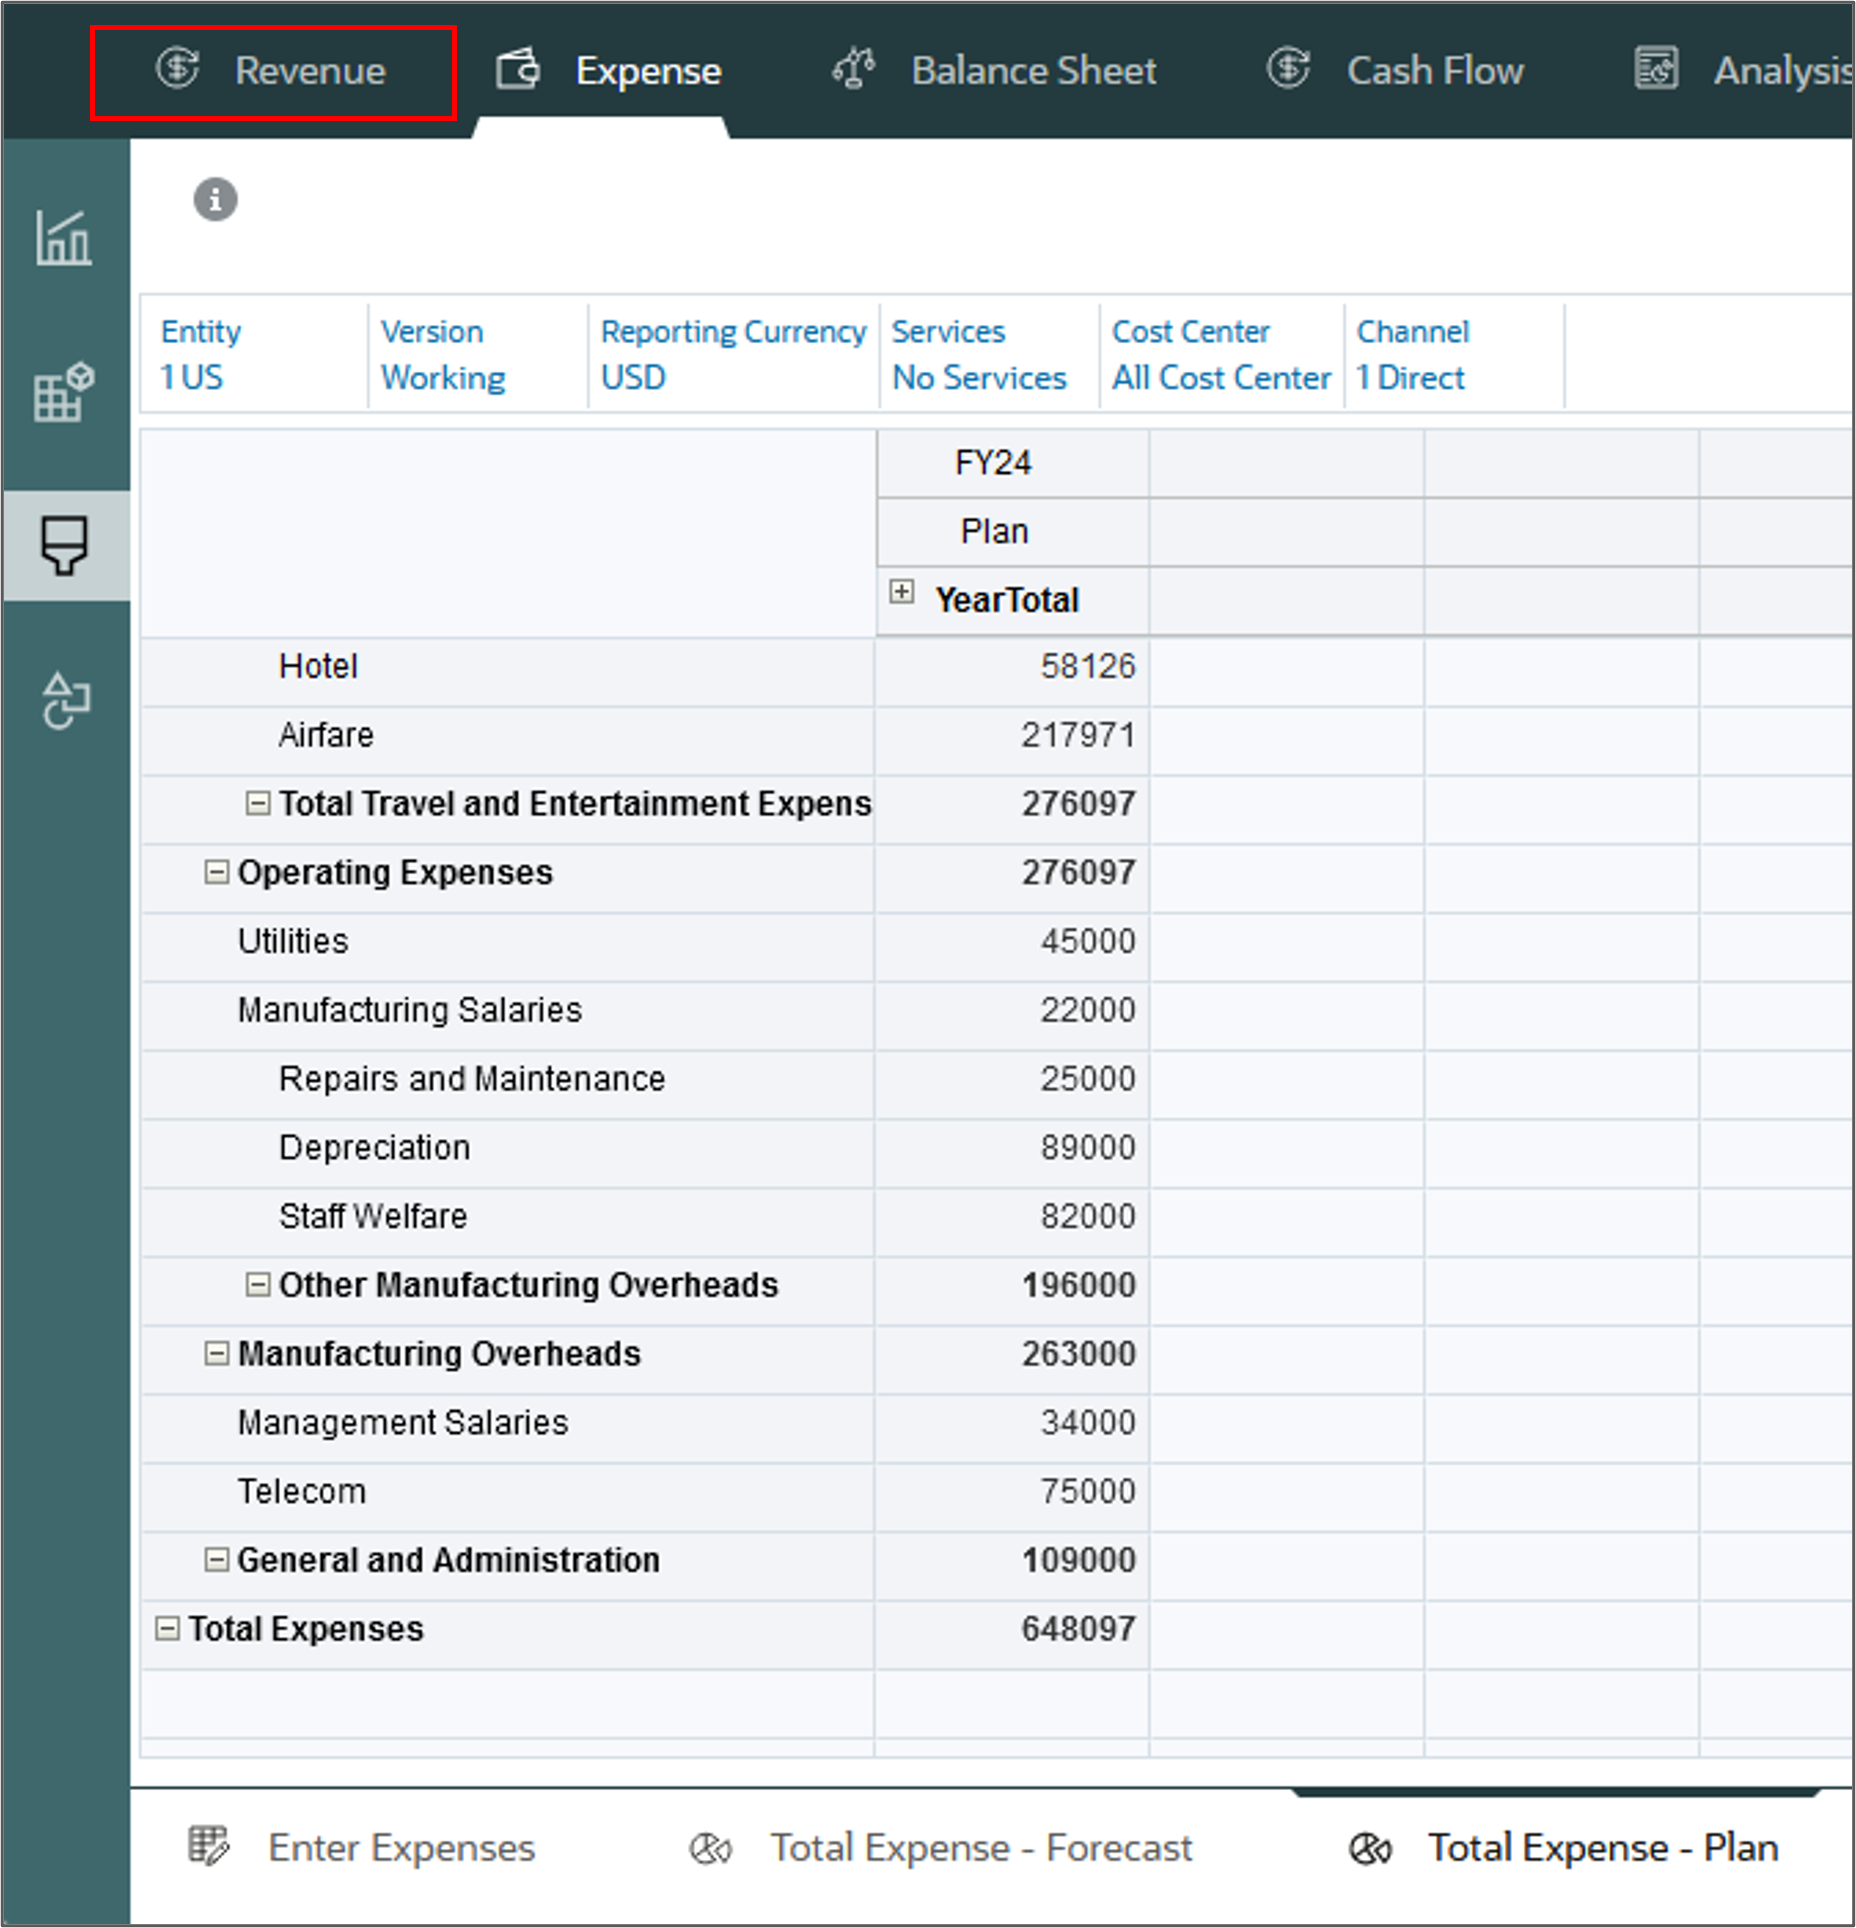
- Scroll down and on the Enter Expenses horizontal tab, in YearTotal, enter the following data:
For Manufacturing Overheads:
- Utilities: 45k
- Manufacturing Salaries: 22k
- Repairs and Maintenance: 25k
- Depreciation: 89k
- Staff Welfare: 82k
For General and Administration:
- Management Salaries: 34k
- Telecom: 75k
- Click Save.
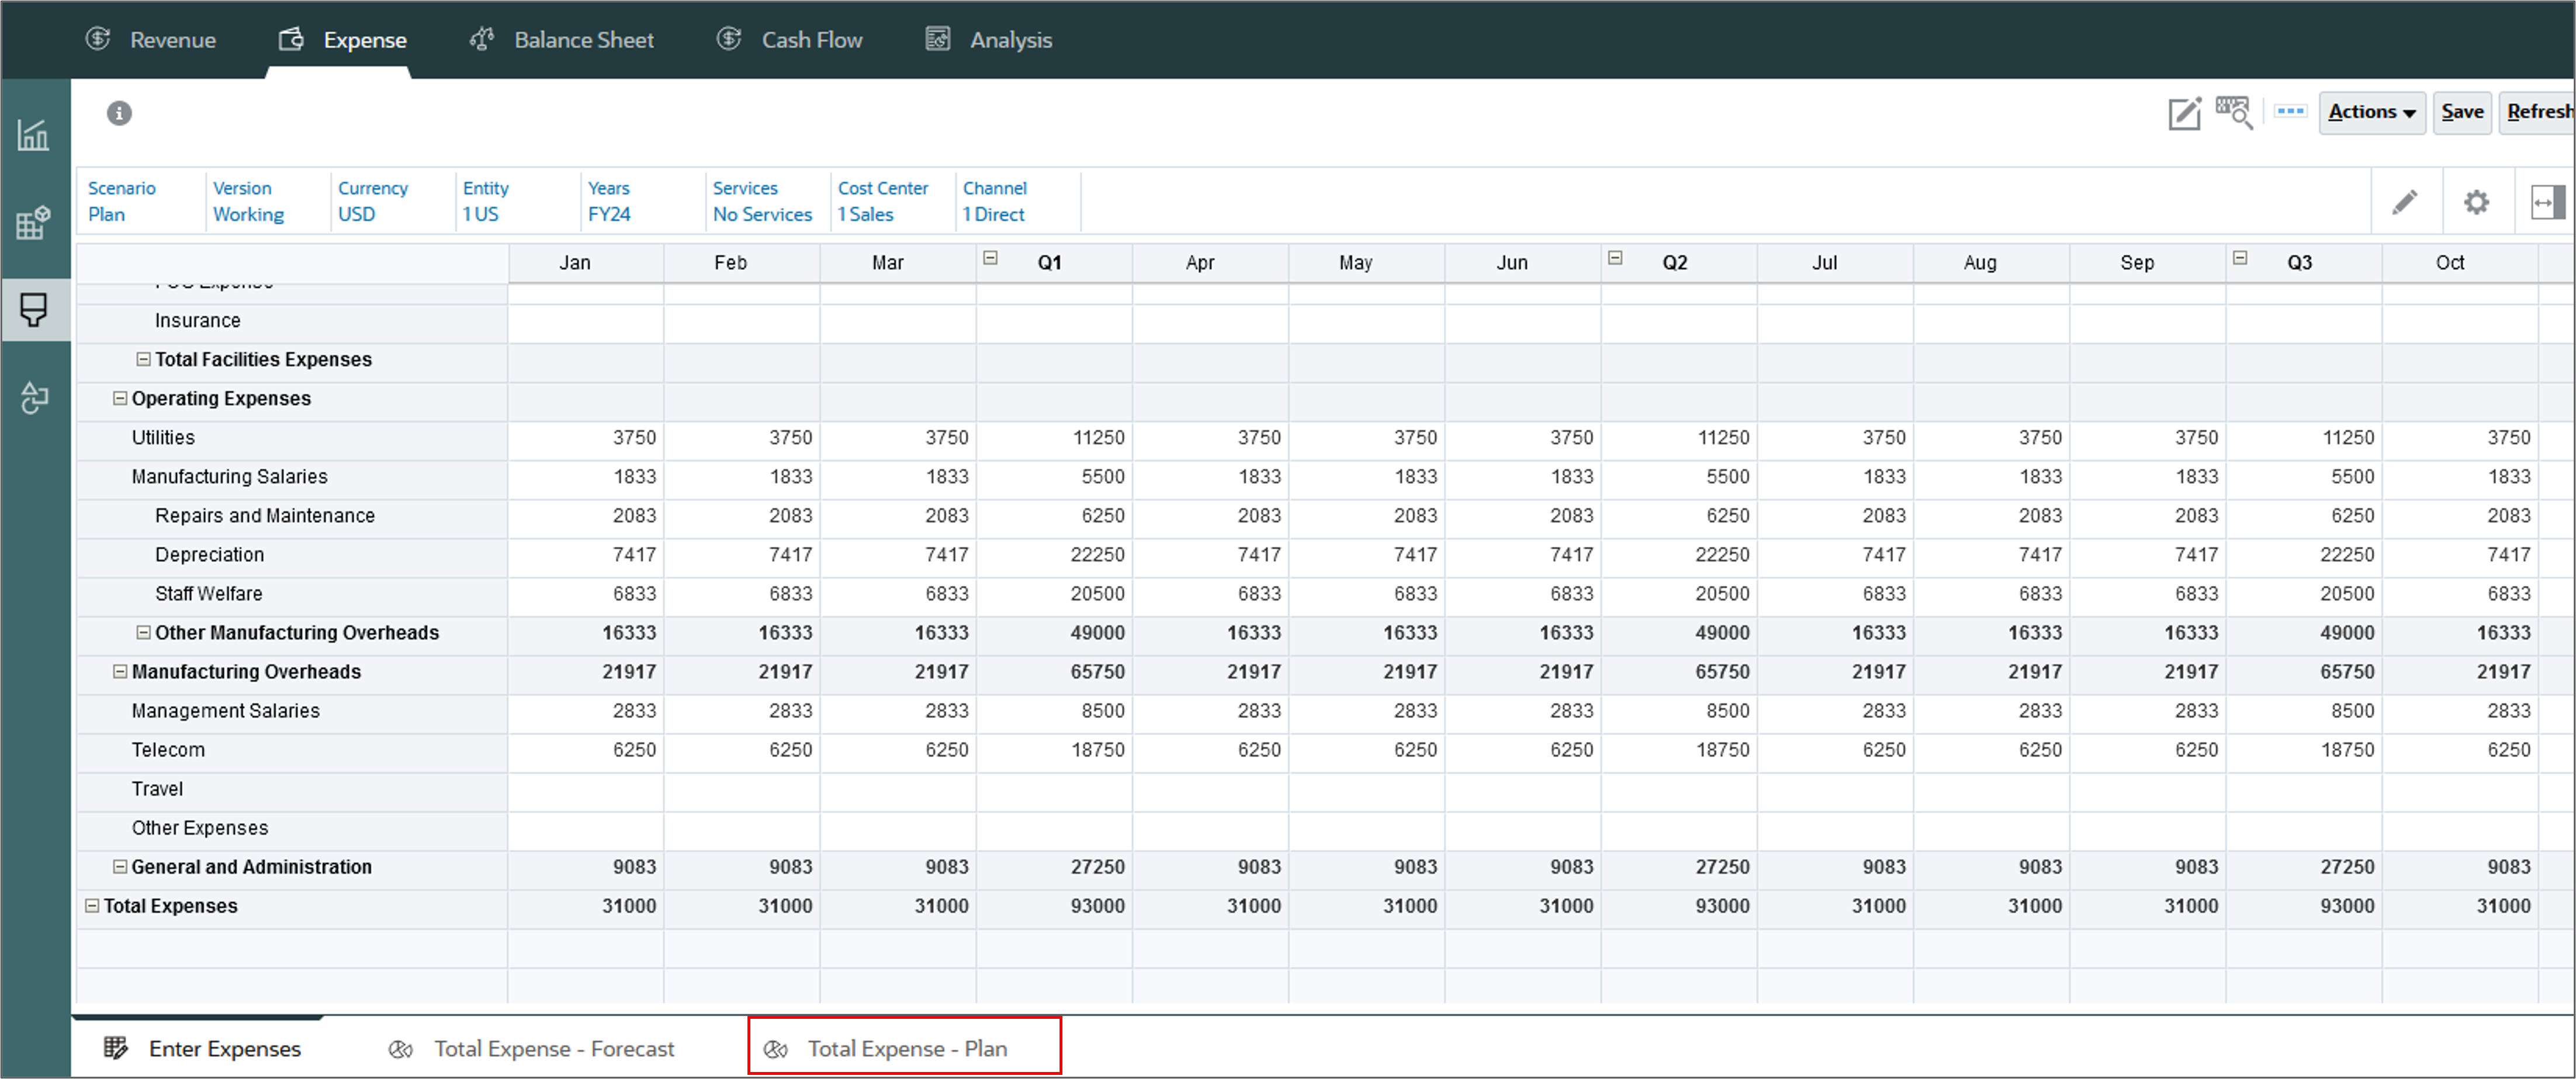
Rolling up plan data for expenses
After entering and adjusting plan data, run a calculation rule to rollup and aggregate expense data.
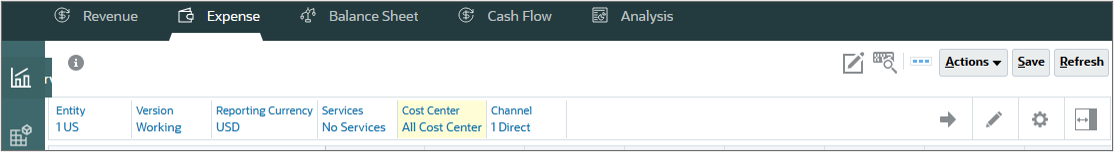
- Click the Total Expense-Plan horizontal tab.
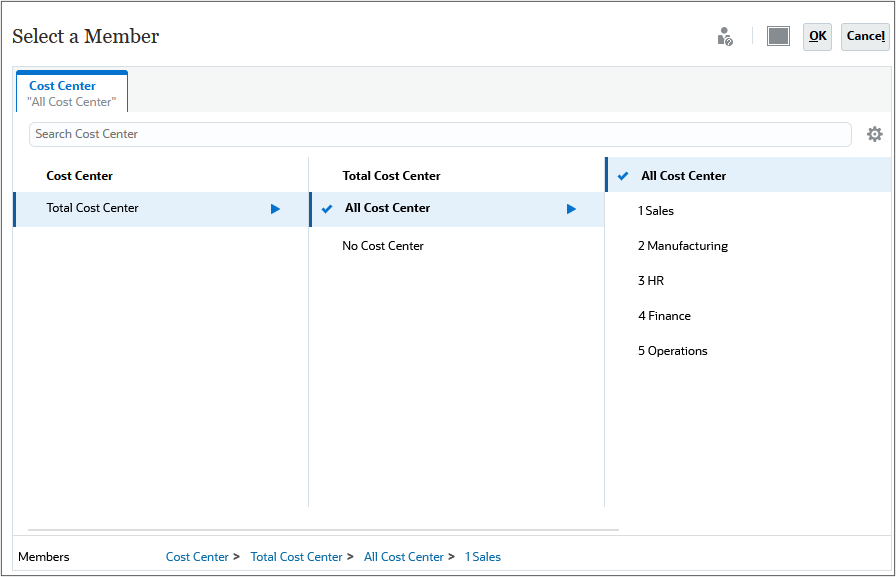
- Click Cost Center, select All Cost Center, and click OK.
- Click (Go).
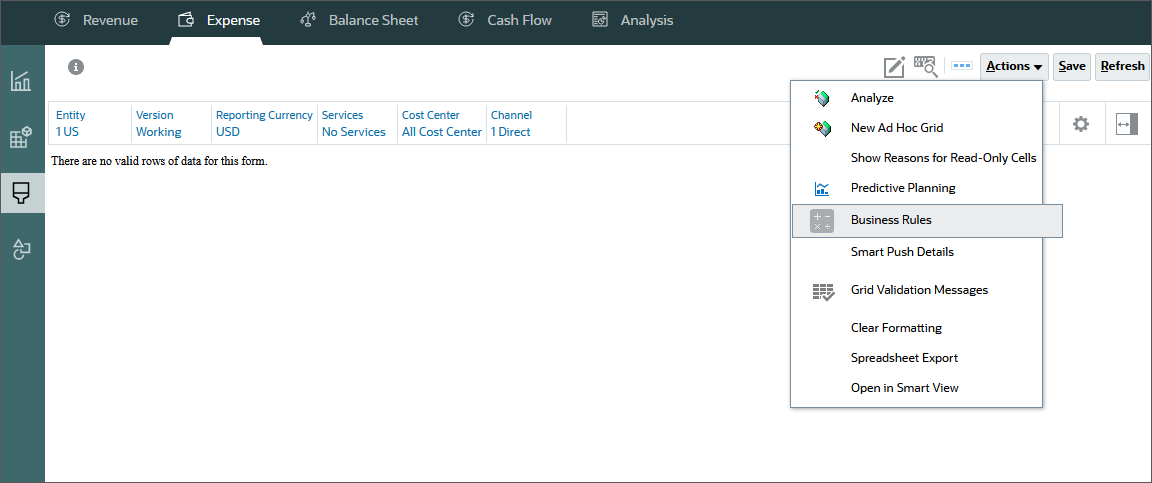
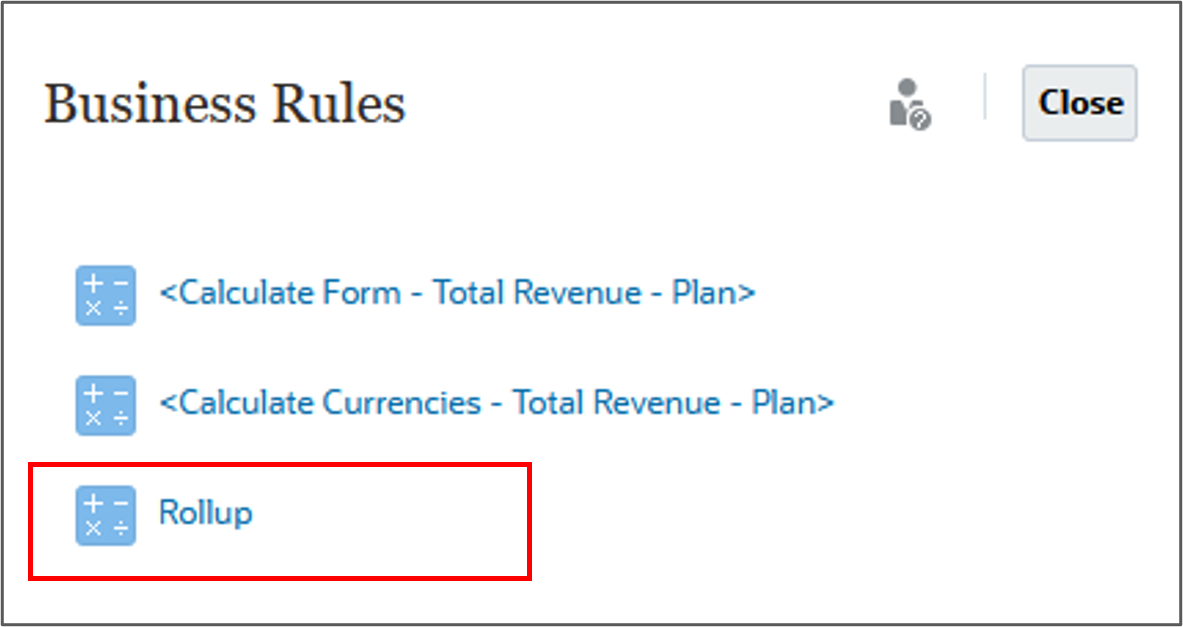
- From Actions, select Business Rules.
- Select Rollup.
- For each item in the dialog box, click its (Member Selector) to select a member as its value:
- Select Years: FY24
- Currency: USD
- Scenario: OEP_Plan
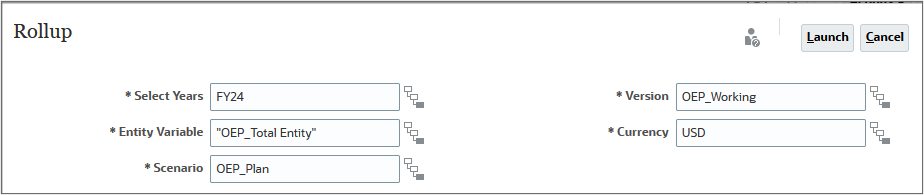
- At the Information message, click OK.
Rolling up plan data for revenue
After entering and adjusting plan data, run a calculation rule to rollup and aggregate revenue data.
- Click Revenue.
- Click the Total Revenue-Plan horizontal tab.
- Click Product, select All Product, and click OK.
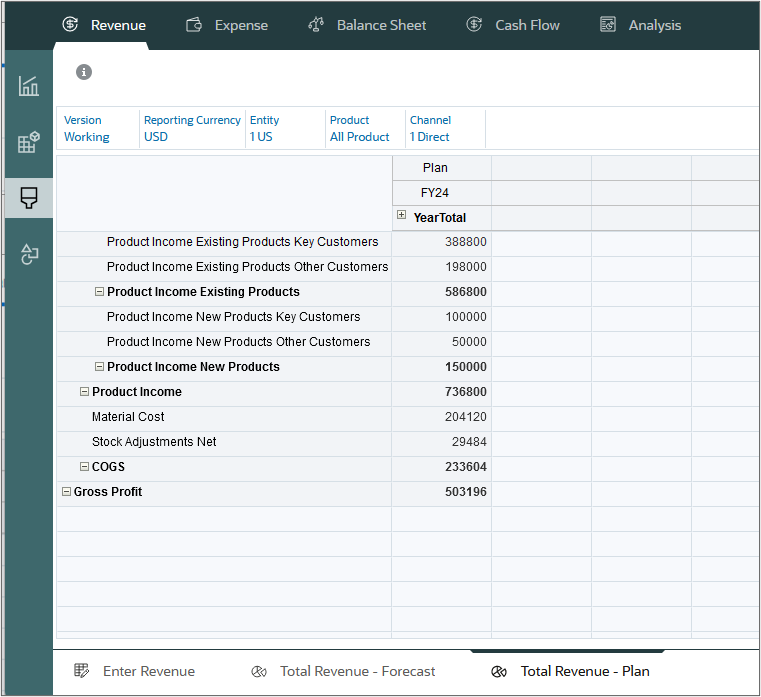
- Click (Go).
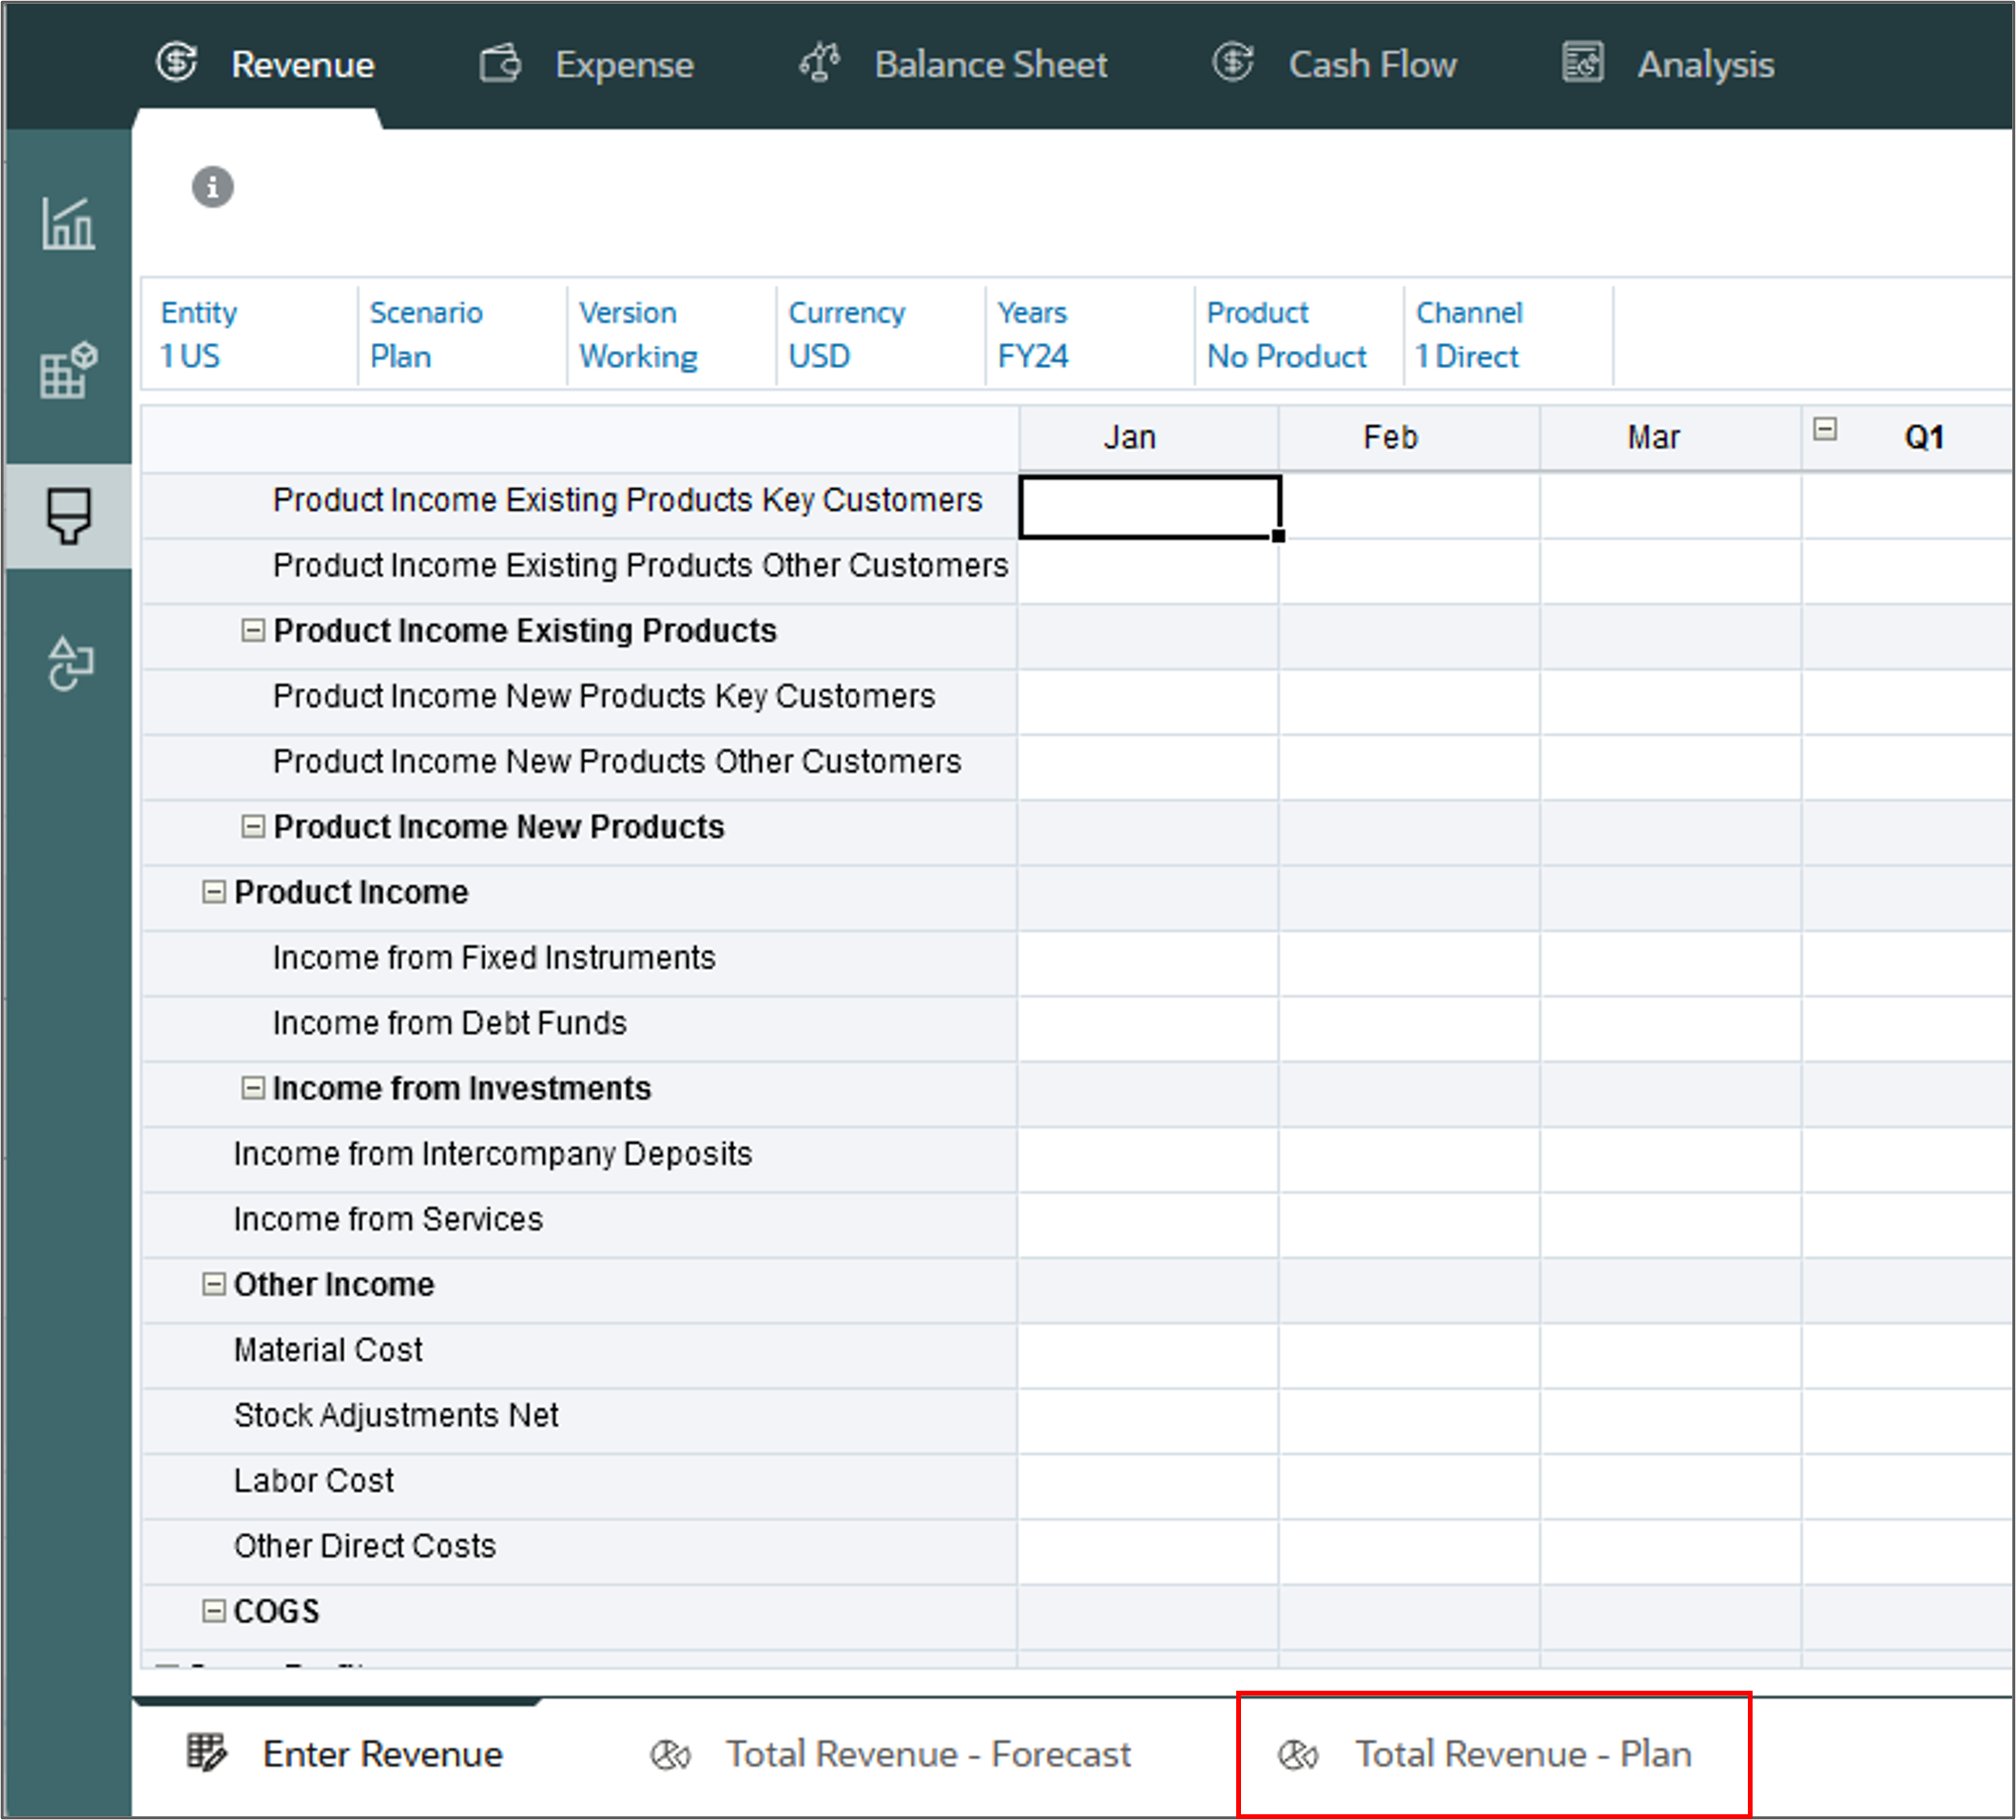
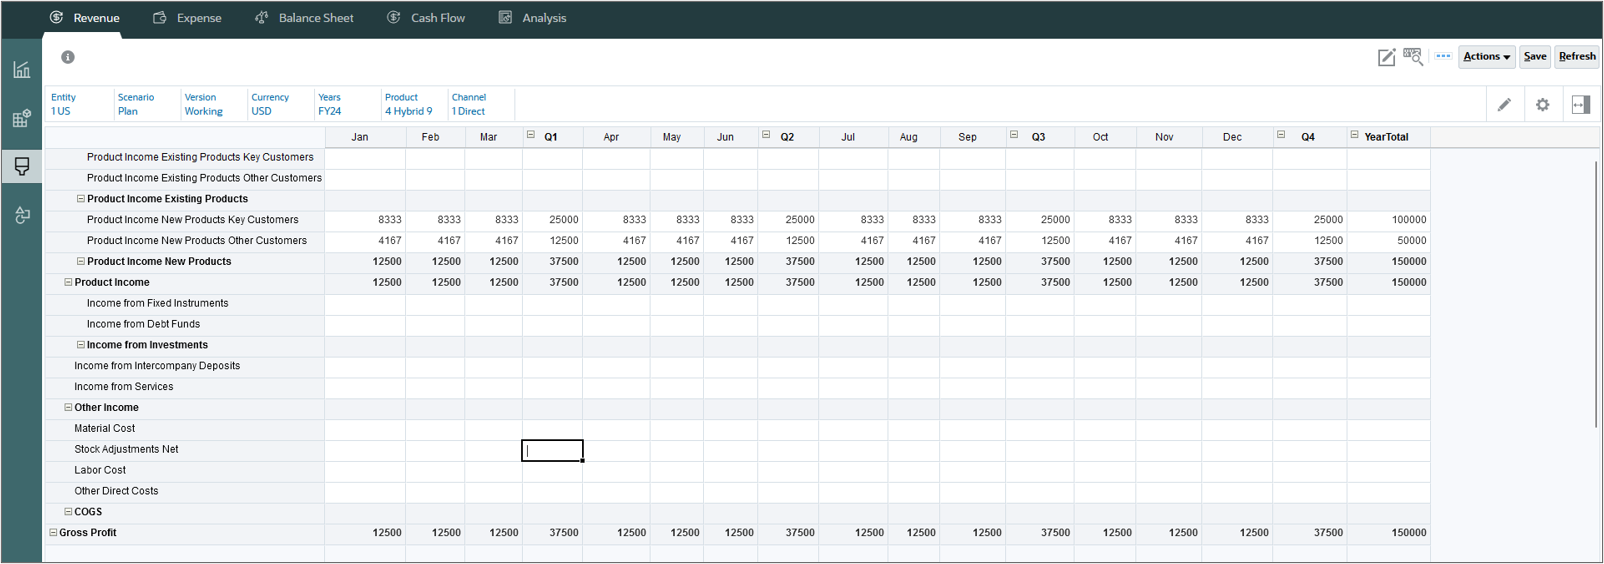
Total Revenue and Gross Profit are calculated for all products.
Reviewing financial statements
In this section, you review financial statements to see actual and plan data and variances.
- On the left, click the Income Statement vertical tab.
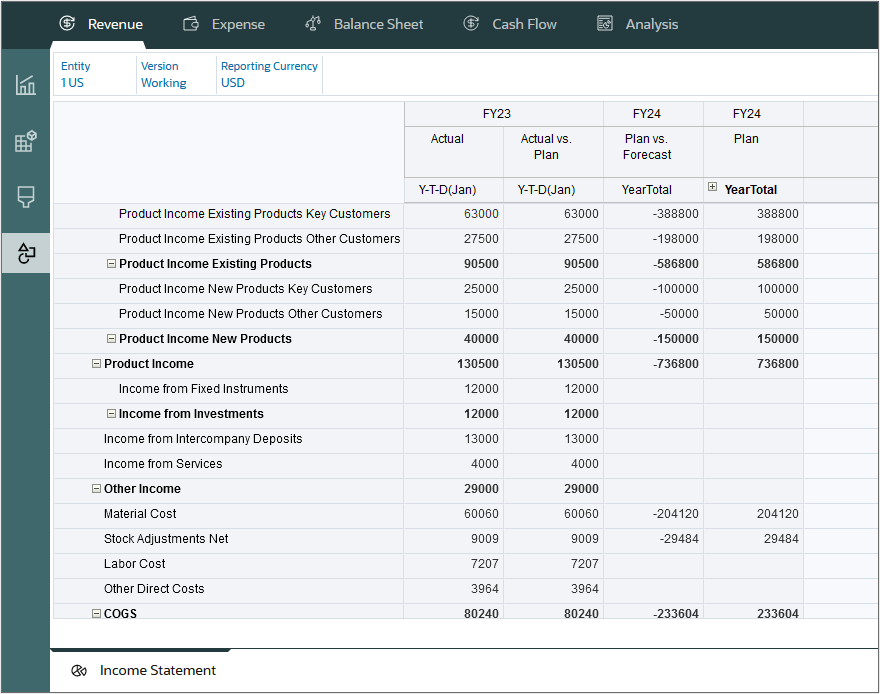
- Click (Home).
Actual data is displayed and the variance for plan versus forecast is also displayed.
Loading and calculating updated actuals
At the beginning of your planning cycle, you might load data for a given scenario, version, and period. To stay up to date with changes or current data, you can plan for an incremental data load process. In this section you load current actual data and run the required rules to calculate and rollup the imported data.
Loading current actuals for revenue
In this section, you load actual data for the first part of FY24.
- On the Planning home page, click Application, then Overview.
- On the Application page, click Actions, and select Import Data.
- In Import Data, click Create.
- Keep all the default selections, and select Include Metadata. Click Browse to select a file.
- Locate and select Revenue_Data FY24.csv, and click Open.
- Click Import.
- At the information dialog, click OK.
- Click Close twice.
- Click Jobs.
- Verify that the job completed successfully.
Note:
Depending on your browser, the button label may display Choose File or Browse.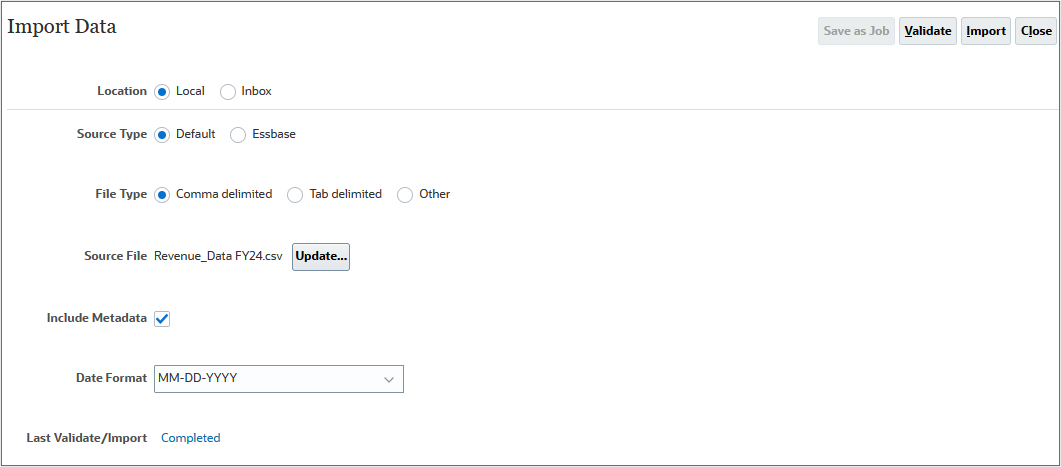

Loading current actuals for expenses
In this section, you load expense data for the first part of FY24.
- Click Overview.
- On the Application page, click Actions, and select Import Data.
- In Import Data, click Create.
- Keep all the default selections, and select Include Metadata. Click Browse to select a file.
- Locate and select Expense_Data FY24.csv, and click Open.
- Click Import.
- At the information dialog, click OK.
- Click Close twice.
- Click Jobs.
- Verify that the job completed successfully.
- Click (Home).

Note:
Depending on your browser, the button label may display Choose File or Browse.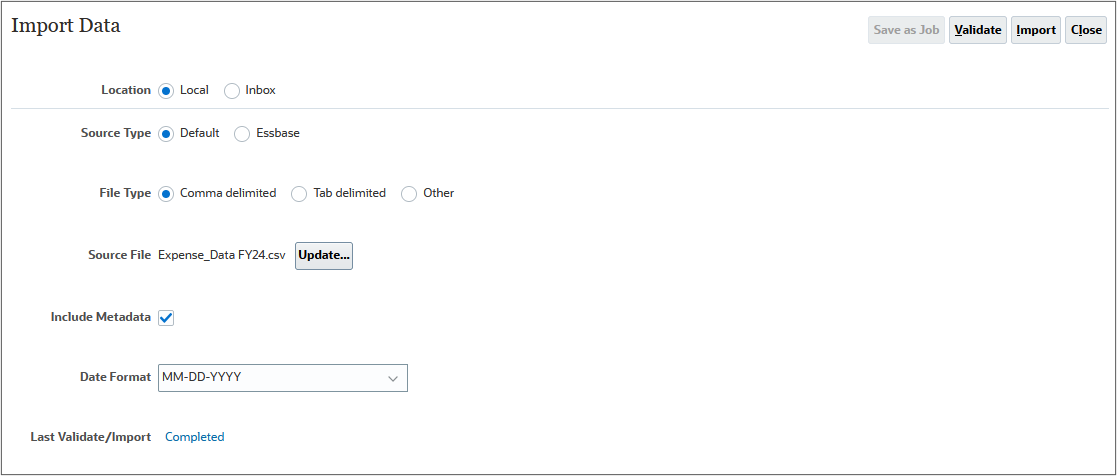

Calculating actuals after updating data
In this section, you calculate actual data after importing actuals for the first part of FY24.
- From the Planning home page, click Rules.
- On Business Rules, for the Calculate Actuals row, click (Launch).
- For each item, click its (Select Member) to select a member as its value, based on the following, and then click Launch:
- Entity: "1 US"
- Periods: ILev0Descendants(YearTotal)
- Years: FY24
- At the Information dialog, click OK.
- Click (home).
- From the Planning Home page, click Application then Jobs.
- Verify that the job completed successfully.
- Click (Home).
Moving the Planning Cycle
- On the Planning home page, click Application, then Configure.
- From the Configure drop-down, select Financials.
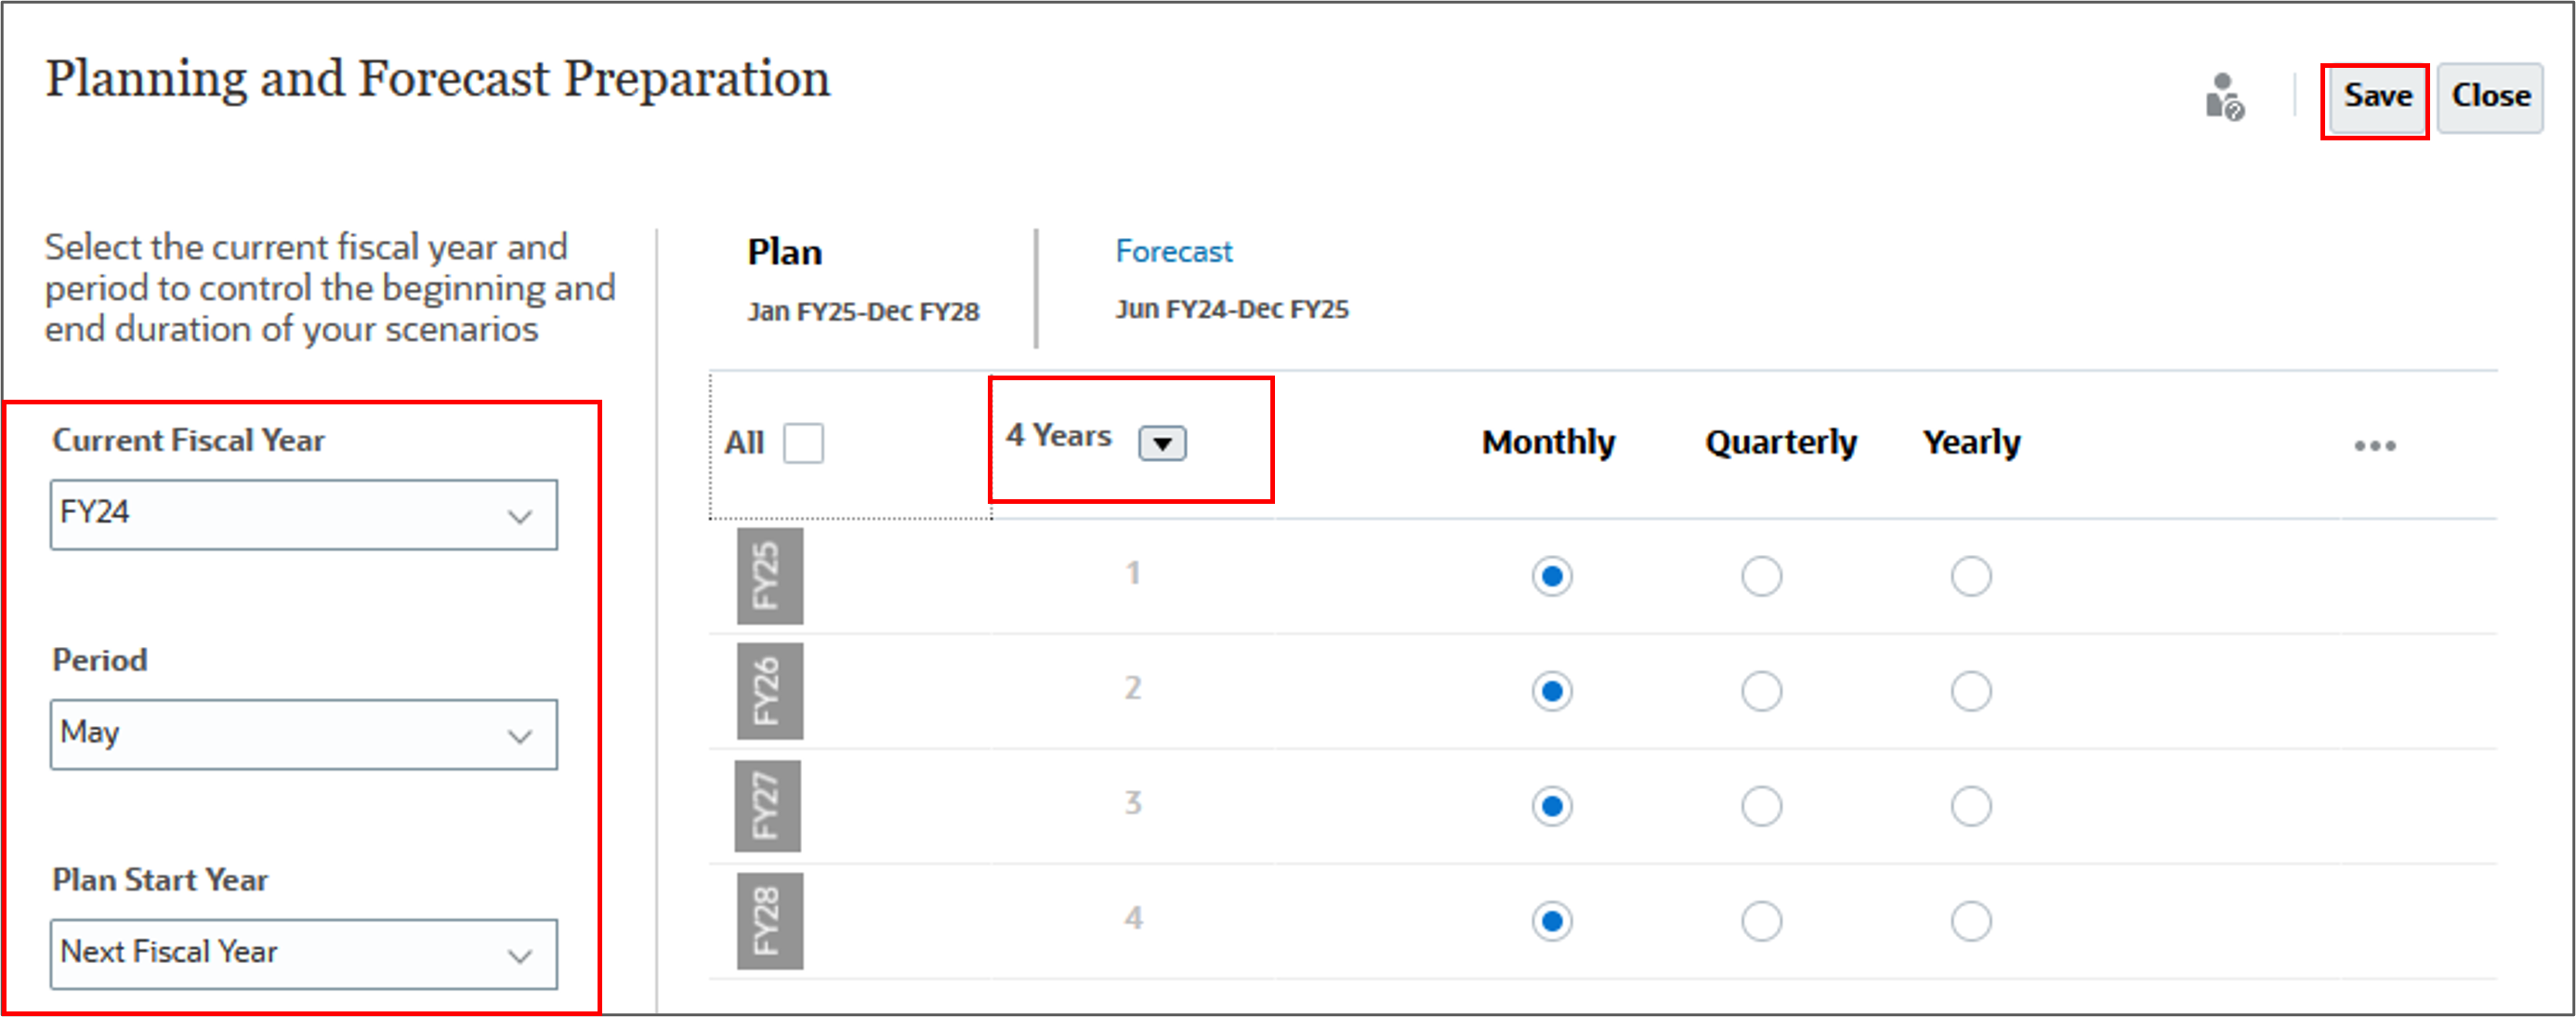
- On Configure: Financials, click Planning and Forecast Preparation
- For Current Fiscal Year, select FY24, for Period, select May, for Plan years, select 4 Years from the dropdown, and click Save.
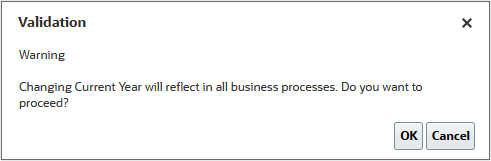
- At the Validation message, click OK.
- Notice the Plan starts in Jan FY25, and Forecast starts in Jun FY24, and click Close.
- Click (Home).
Rolling up actual data for FY24
- On the Planning home page, click Rules.
- For Rollup, on the right, click (Launch).
- For Scenario, click (Member Selector) and select OEP_Actual. Then for the year, enter FY24, and for Currency enter USD, and click Launch.
- At the information message, click OK.
- Click Navigator, and under Application, select Jobs.
- Click (Home).

Tip:
Change the value of the scenario dimension first.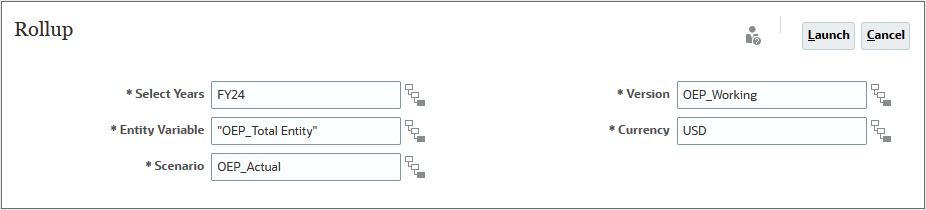
The rollup job completed successfully.
Reviewing updated FY24 actuals
In this section, you verify that actual data was loaded.
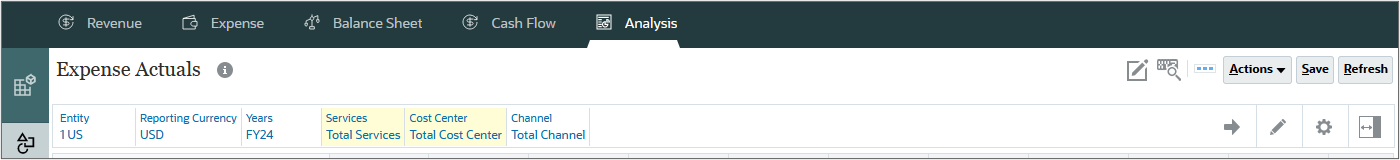
- On the Planning home page, click Financials, then Analysis.
- Ensure that you are on the Forms vertical tab, and click Expense Actuals.
- In the POV, for Services select Total Services and for Cost Center, select Total Cost Center and click (Go).
- Notice the loaded expense data for January through April, and click Forms at the bottom left to go back to the Forms.
- Click Revenue Actuals.
- In the POV, for Product, select Total Product and click (Go).
- Notice the loaded revenue data for January through April.
- Click (Home).
Preparing forecasts
With forecasting, you can budget using past and present data, and analyze trends using assumptions. Forecasts can help your management teams anticipate results based on past information, while allowing to be adjusted when new information is available. You can also prepare forecasts that mimic real, flexible business cycles.
Running the Prepare Forecast Rule
In this section, you run the Prepare Forecast rule to copy selected months from the Actual scenario to the Forecast scenario. The rule also recalculates drivers and trends based on the new periods of actual results.
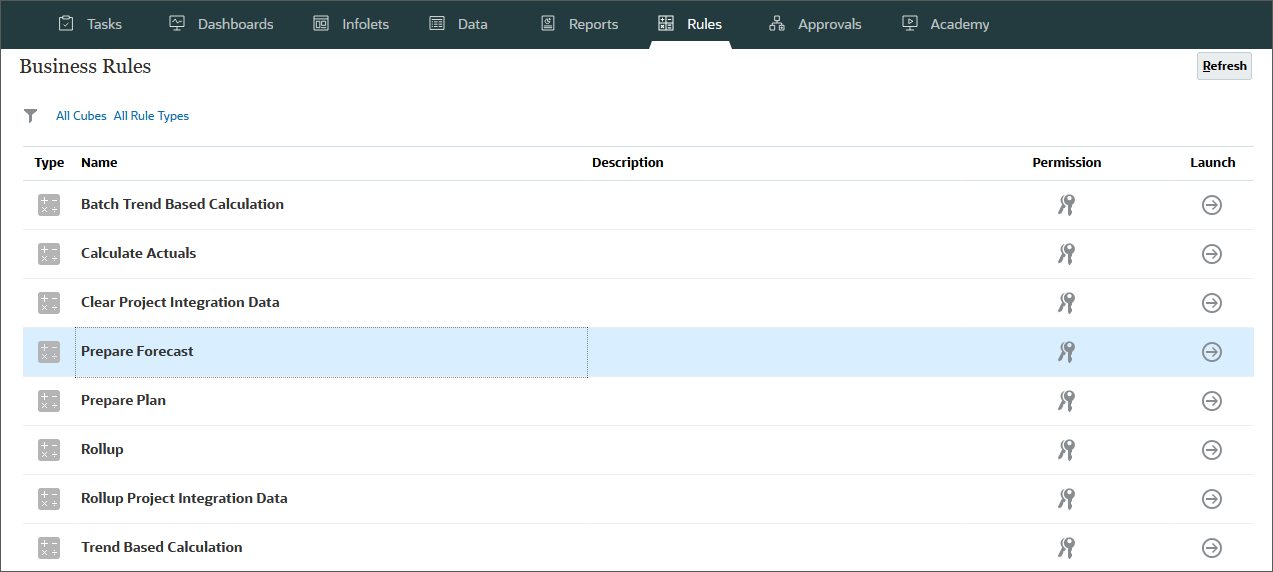
- On the Planning home page, click Rules.
- On Business Rules, for the Prepare Forecast row, click (Launch).
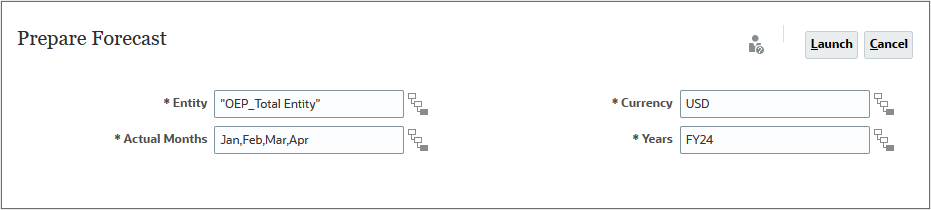
- For Entity, Actual Months, Currency, and Years, click (Member Selector) and select the following members. Then click Launch.
- At the Information message, click OK.
- Click (Home).
Entering forecast data for expenses
After running the Prepare Forecast rule to copy actual data from January through April to Forecast, you forecast expenses.
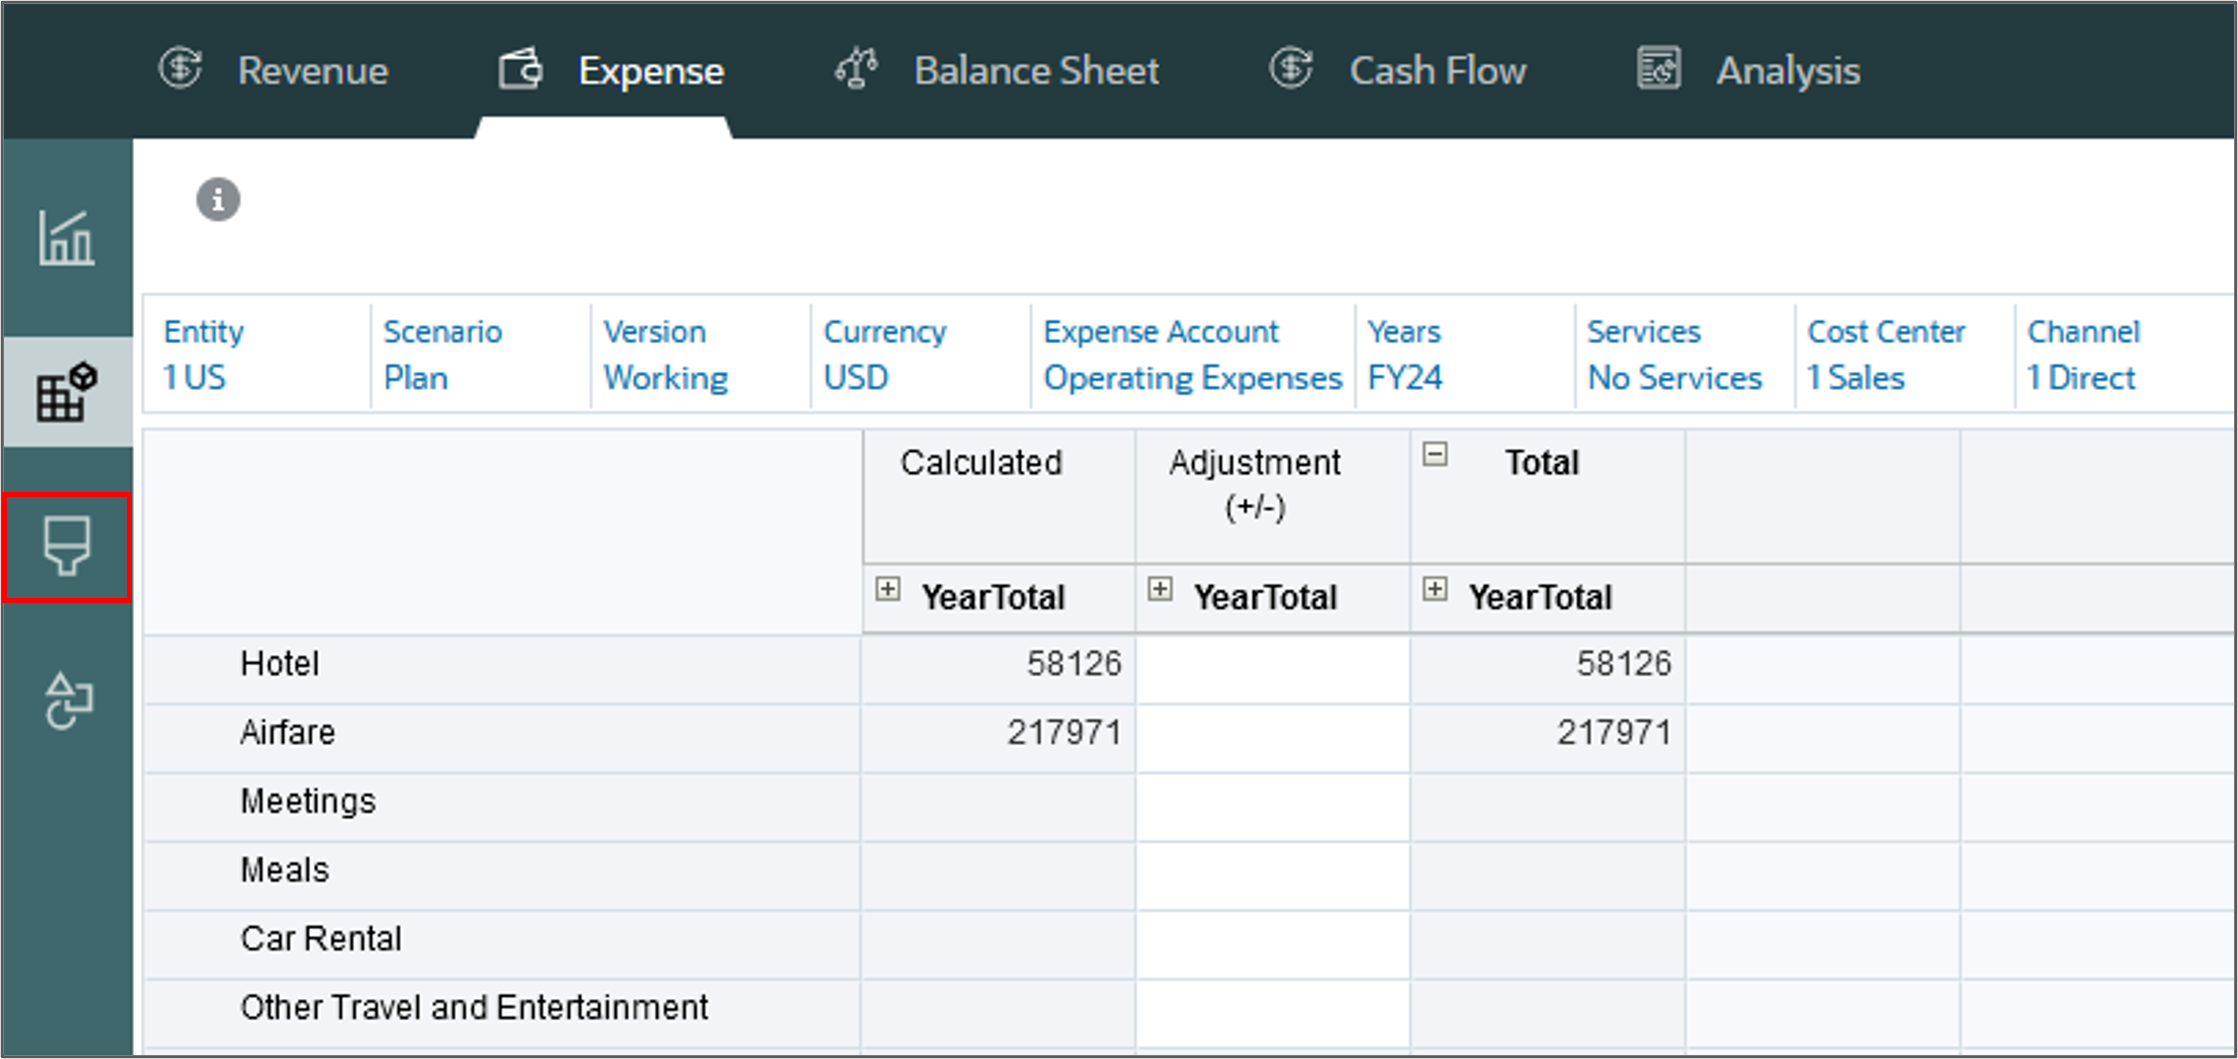
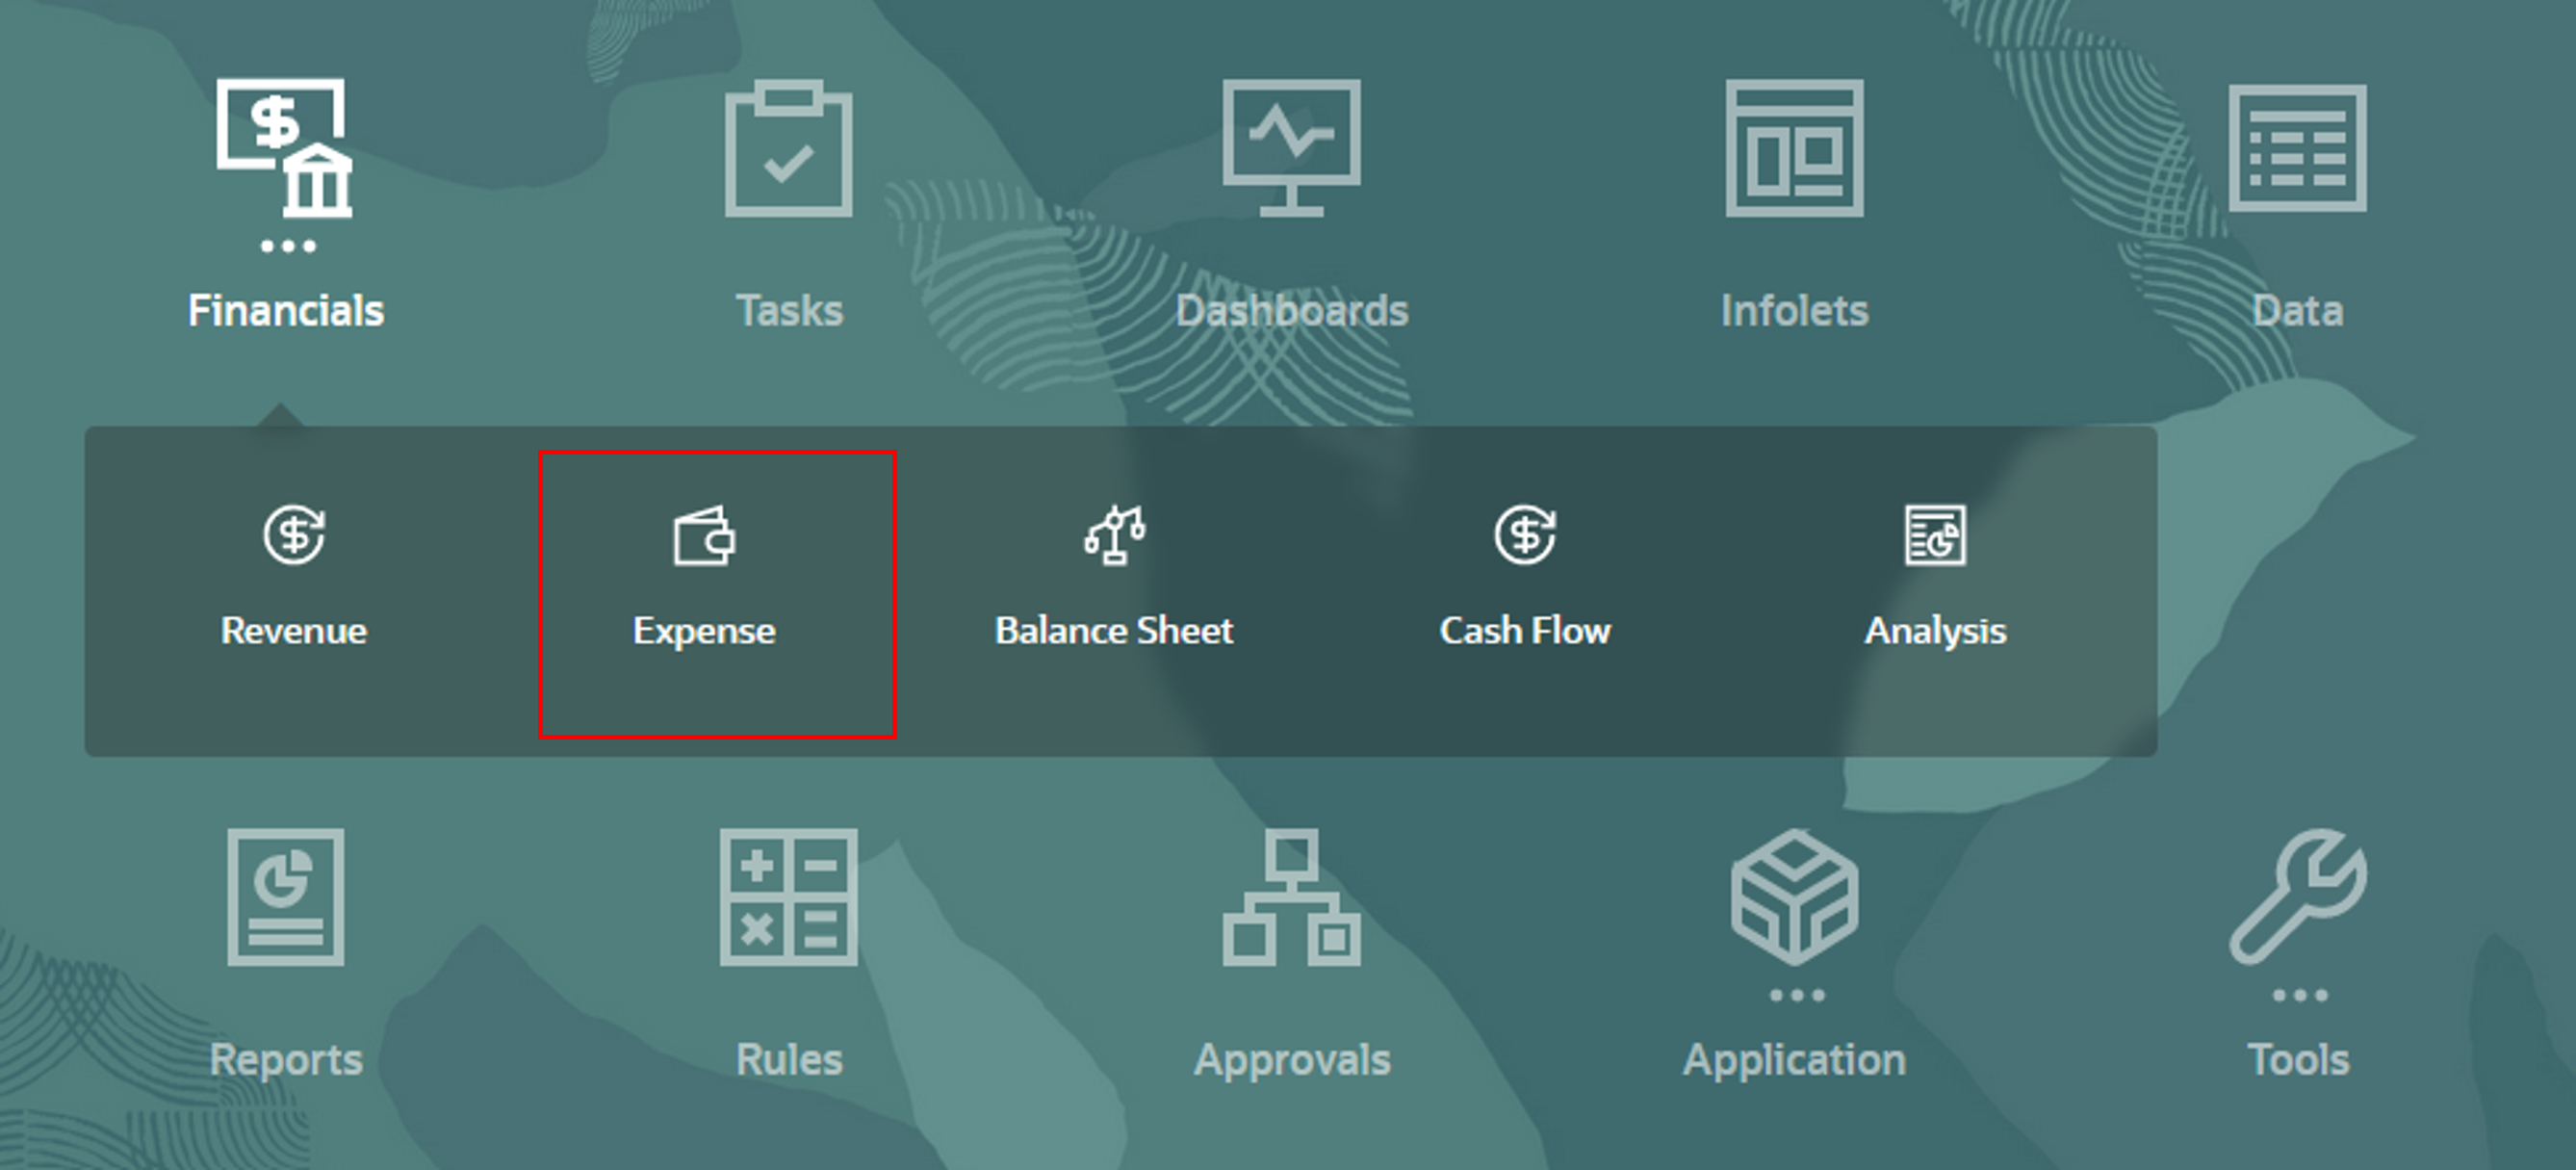
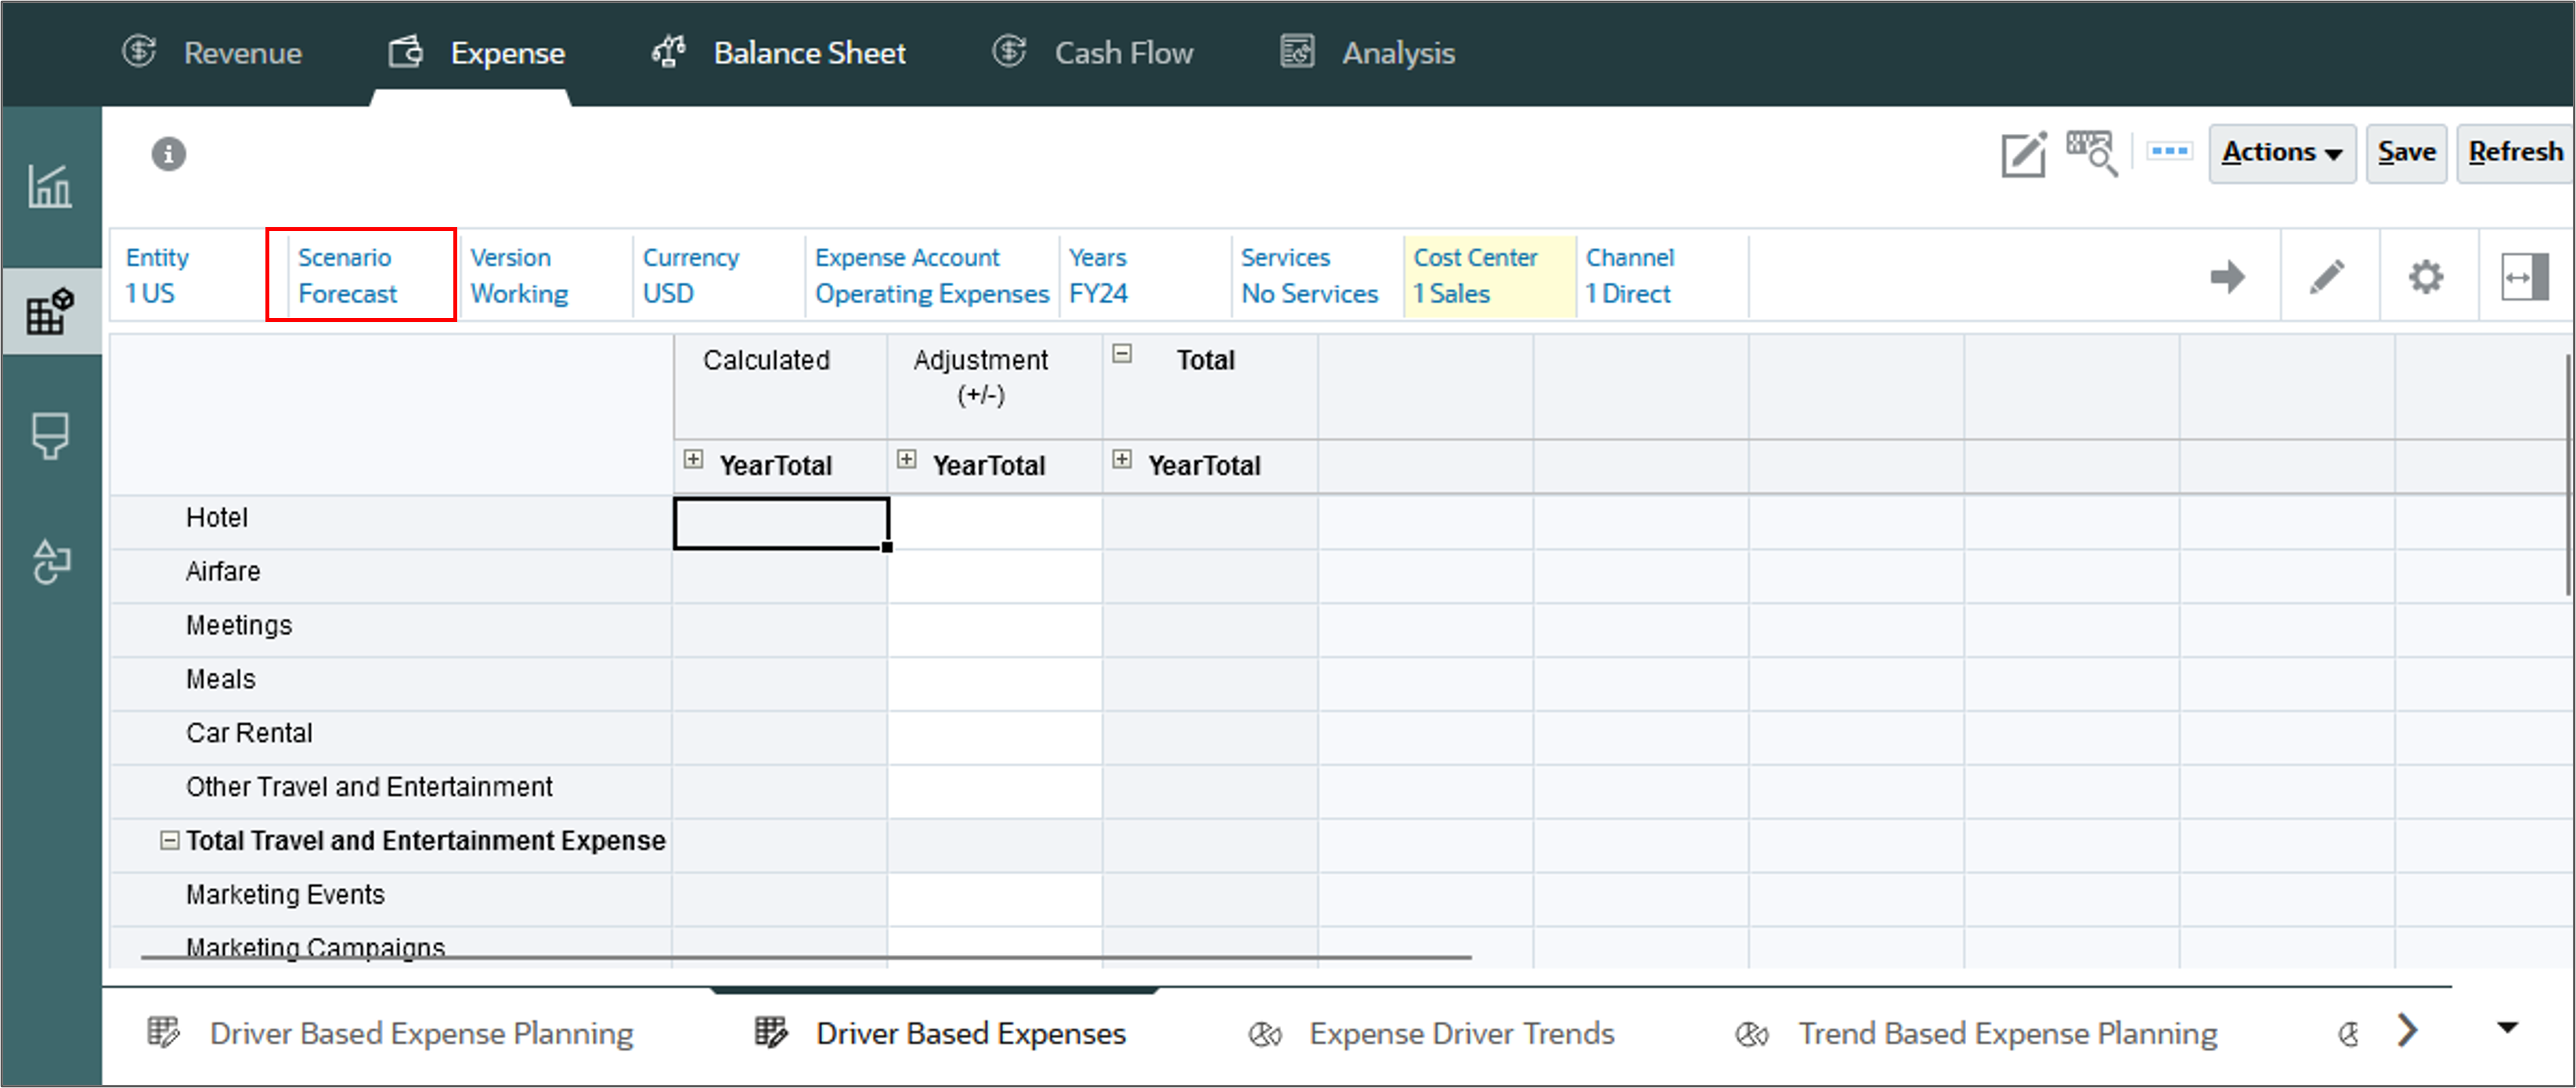
- On the Planning home page, click Financials, then Expense.
- Click the Driver and Trend Based vertical tab.
- Ensure you are on the Driver Based Expenses horizontal tab, click Scenario, and select Forecast.
- Ensure the POV has the following selections, and click (Go):
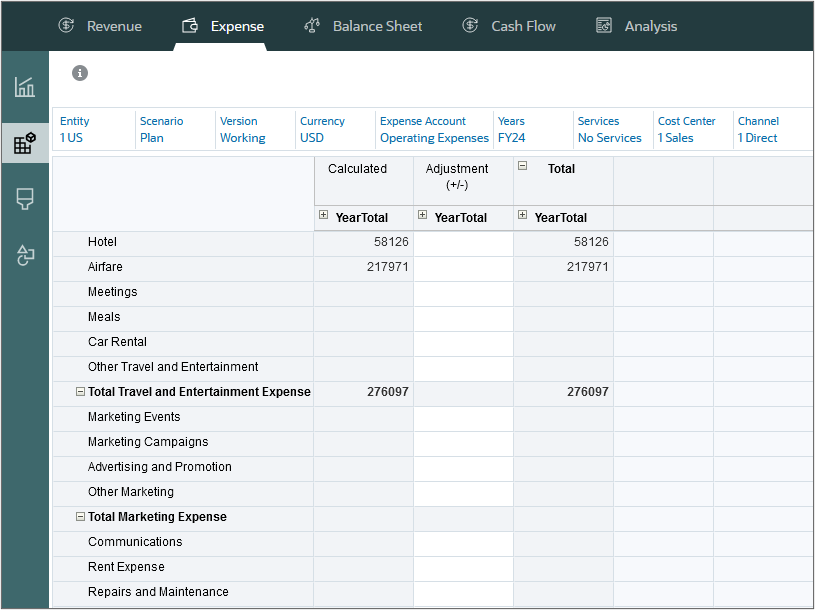
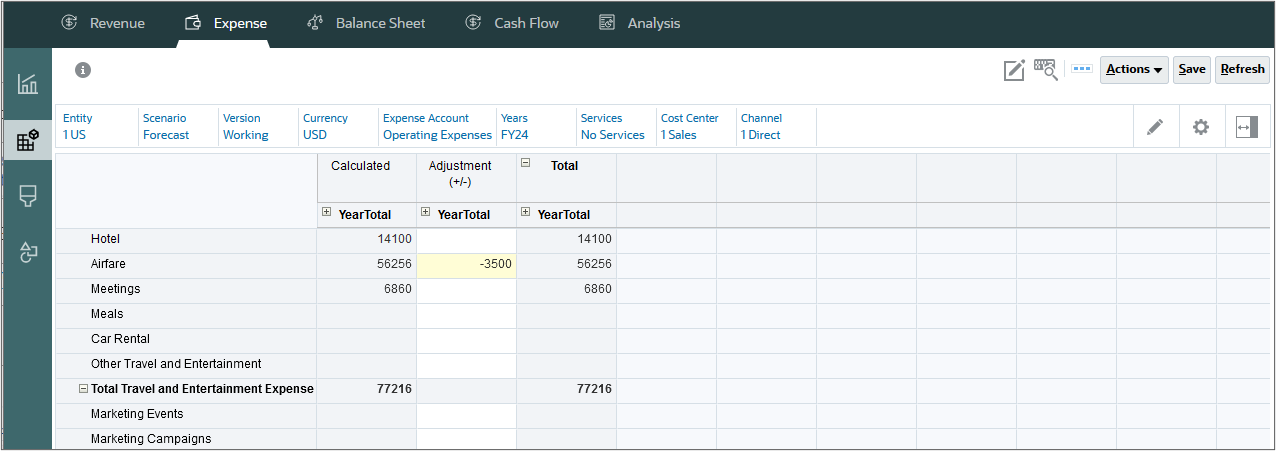
- For Airfare, in Adjustment, enter -3500, and click Save.
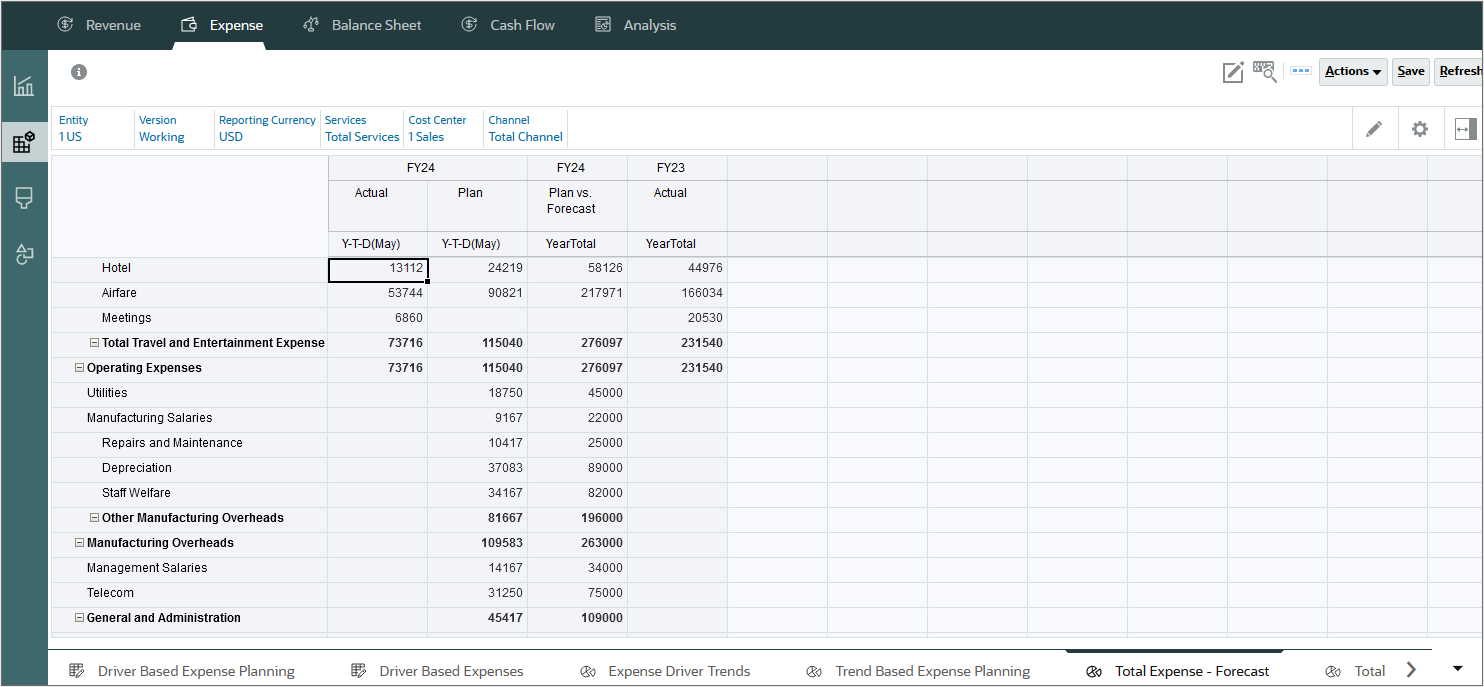
- Click the Total Expense - Forecast horizontal tab.
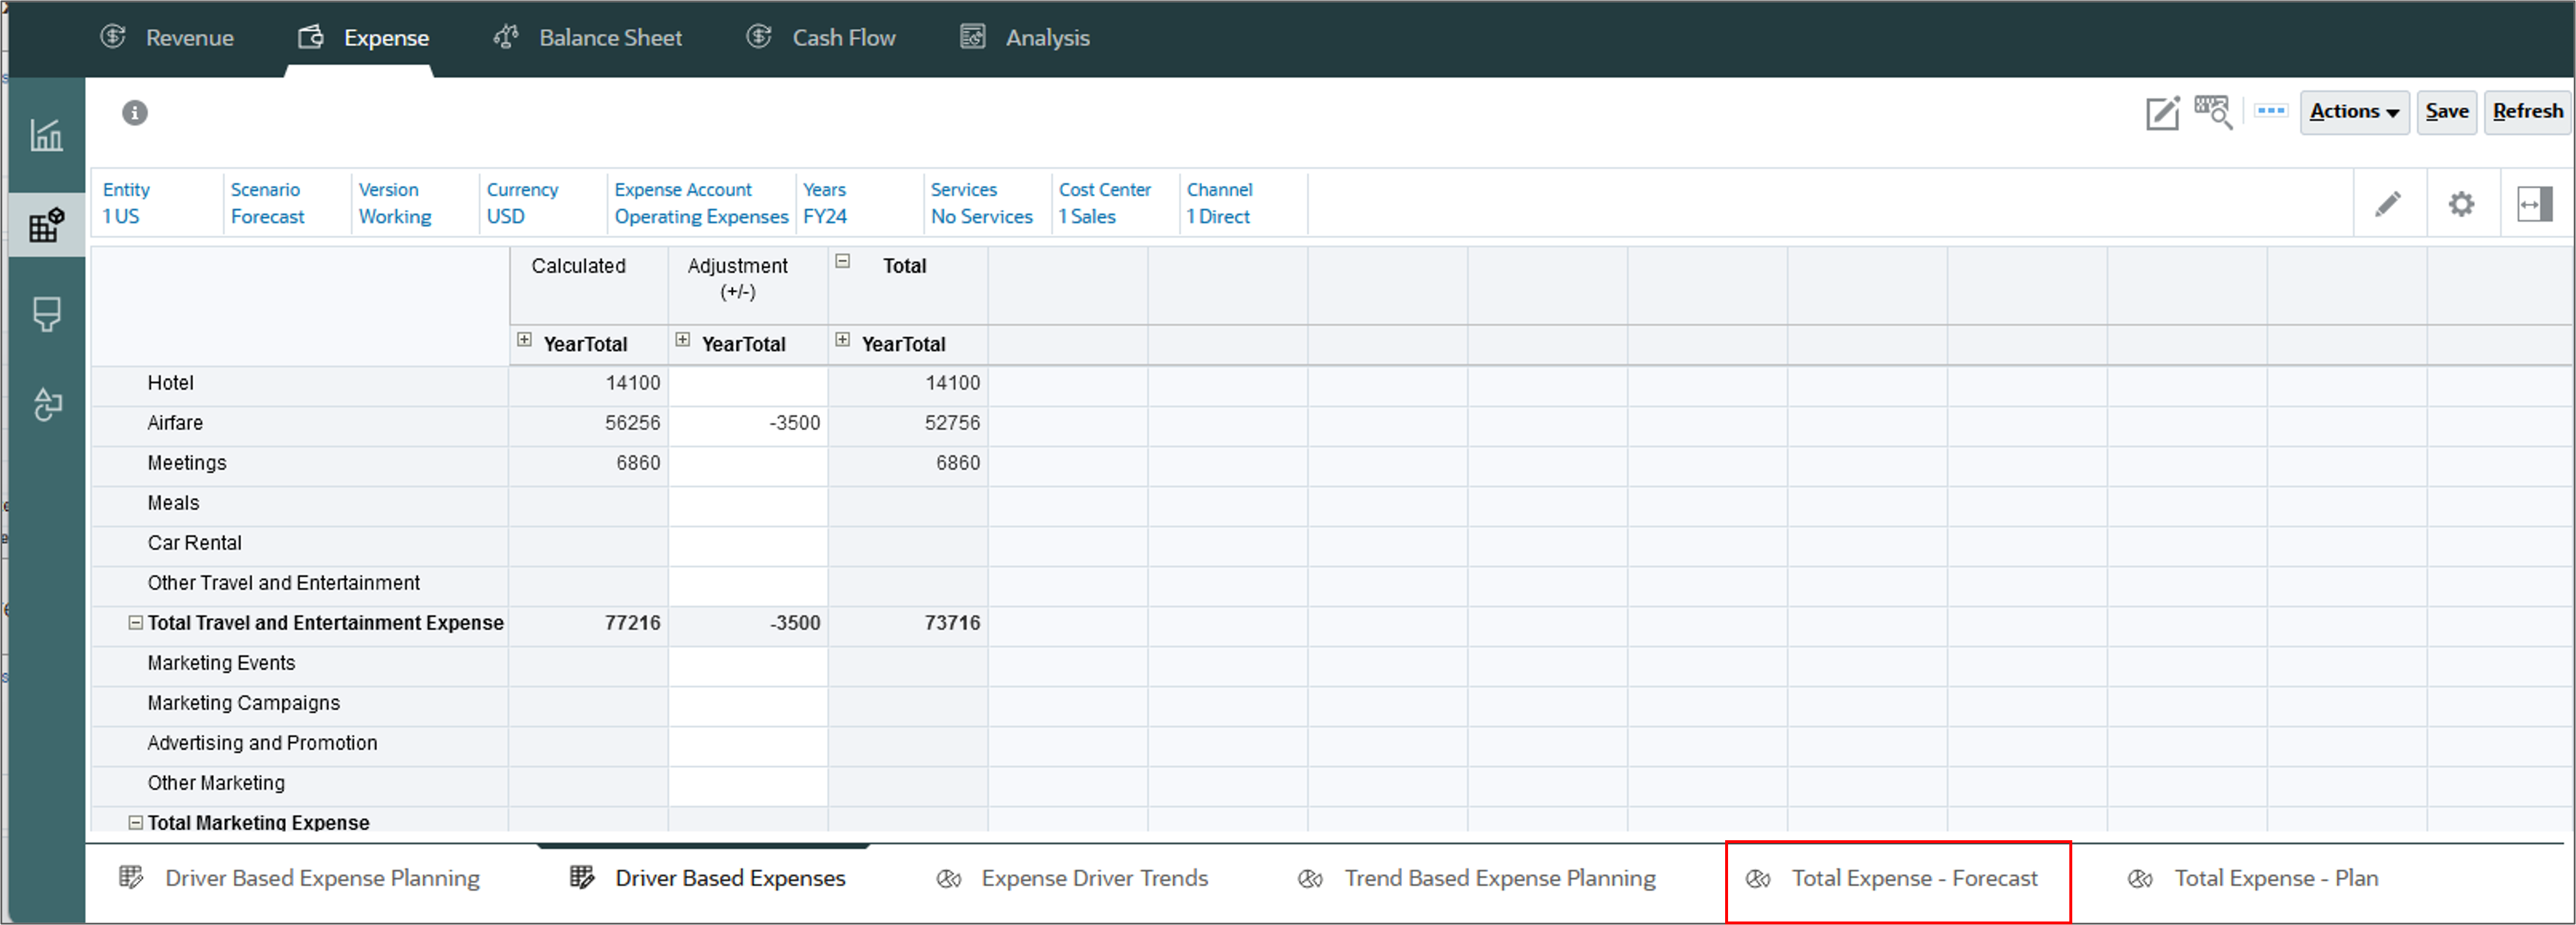
The adjusted forecast is displayed.
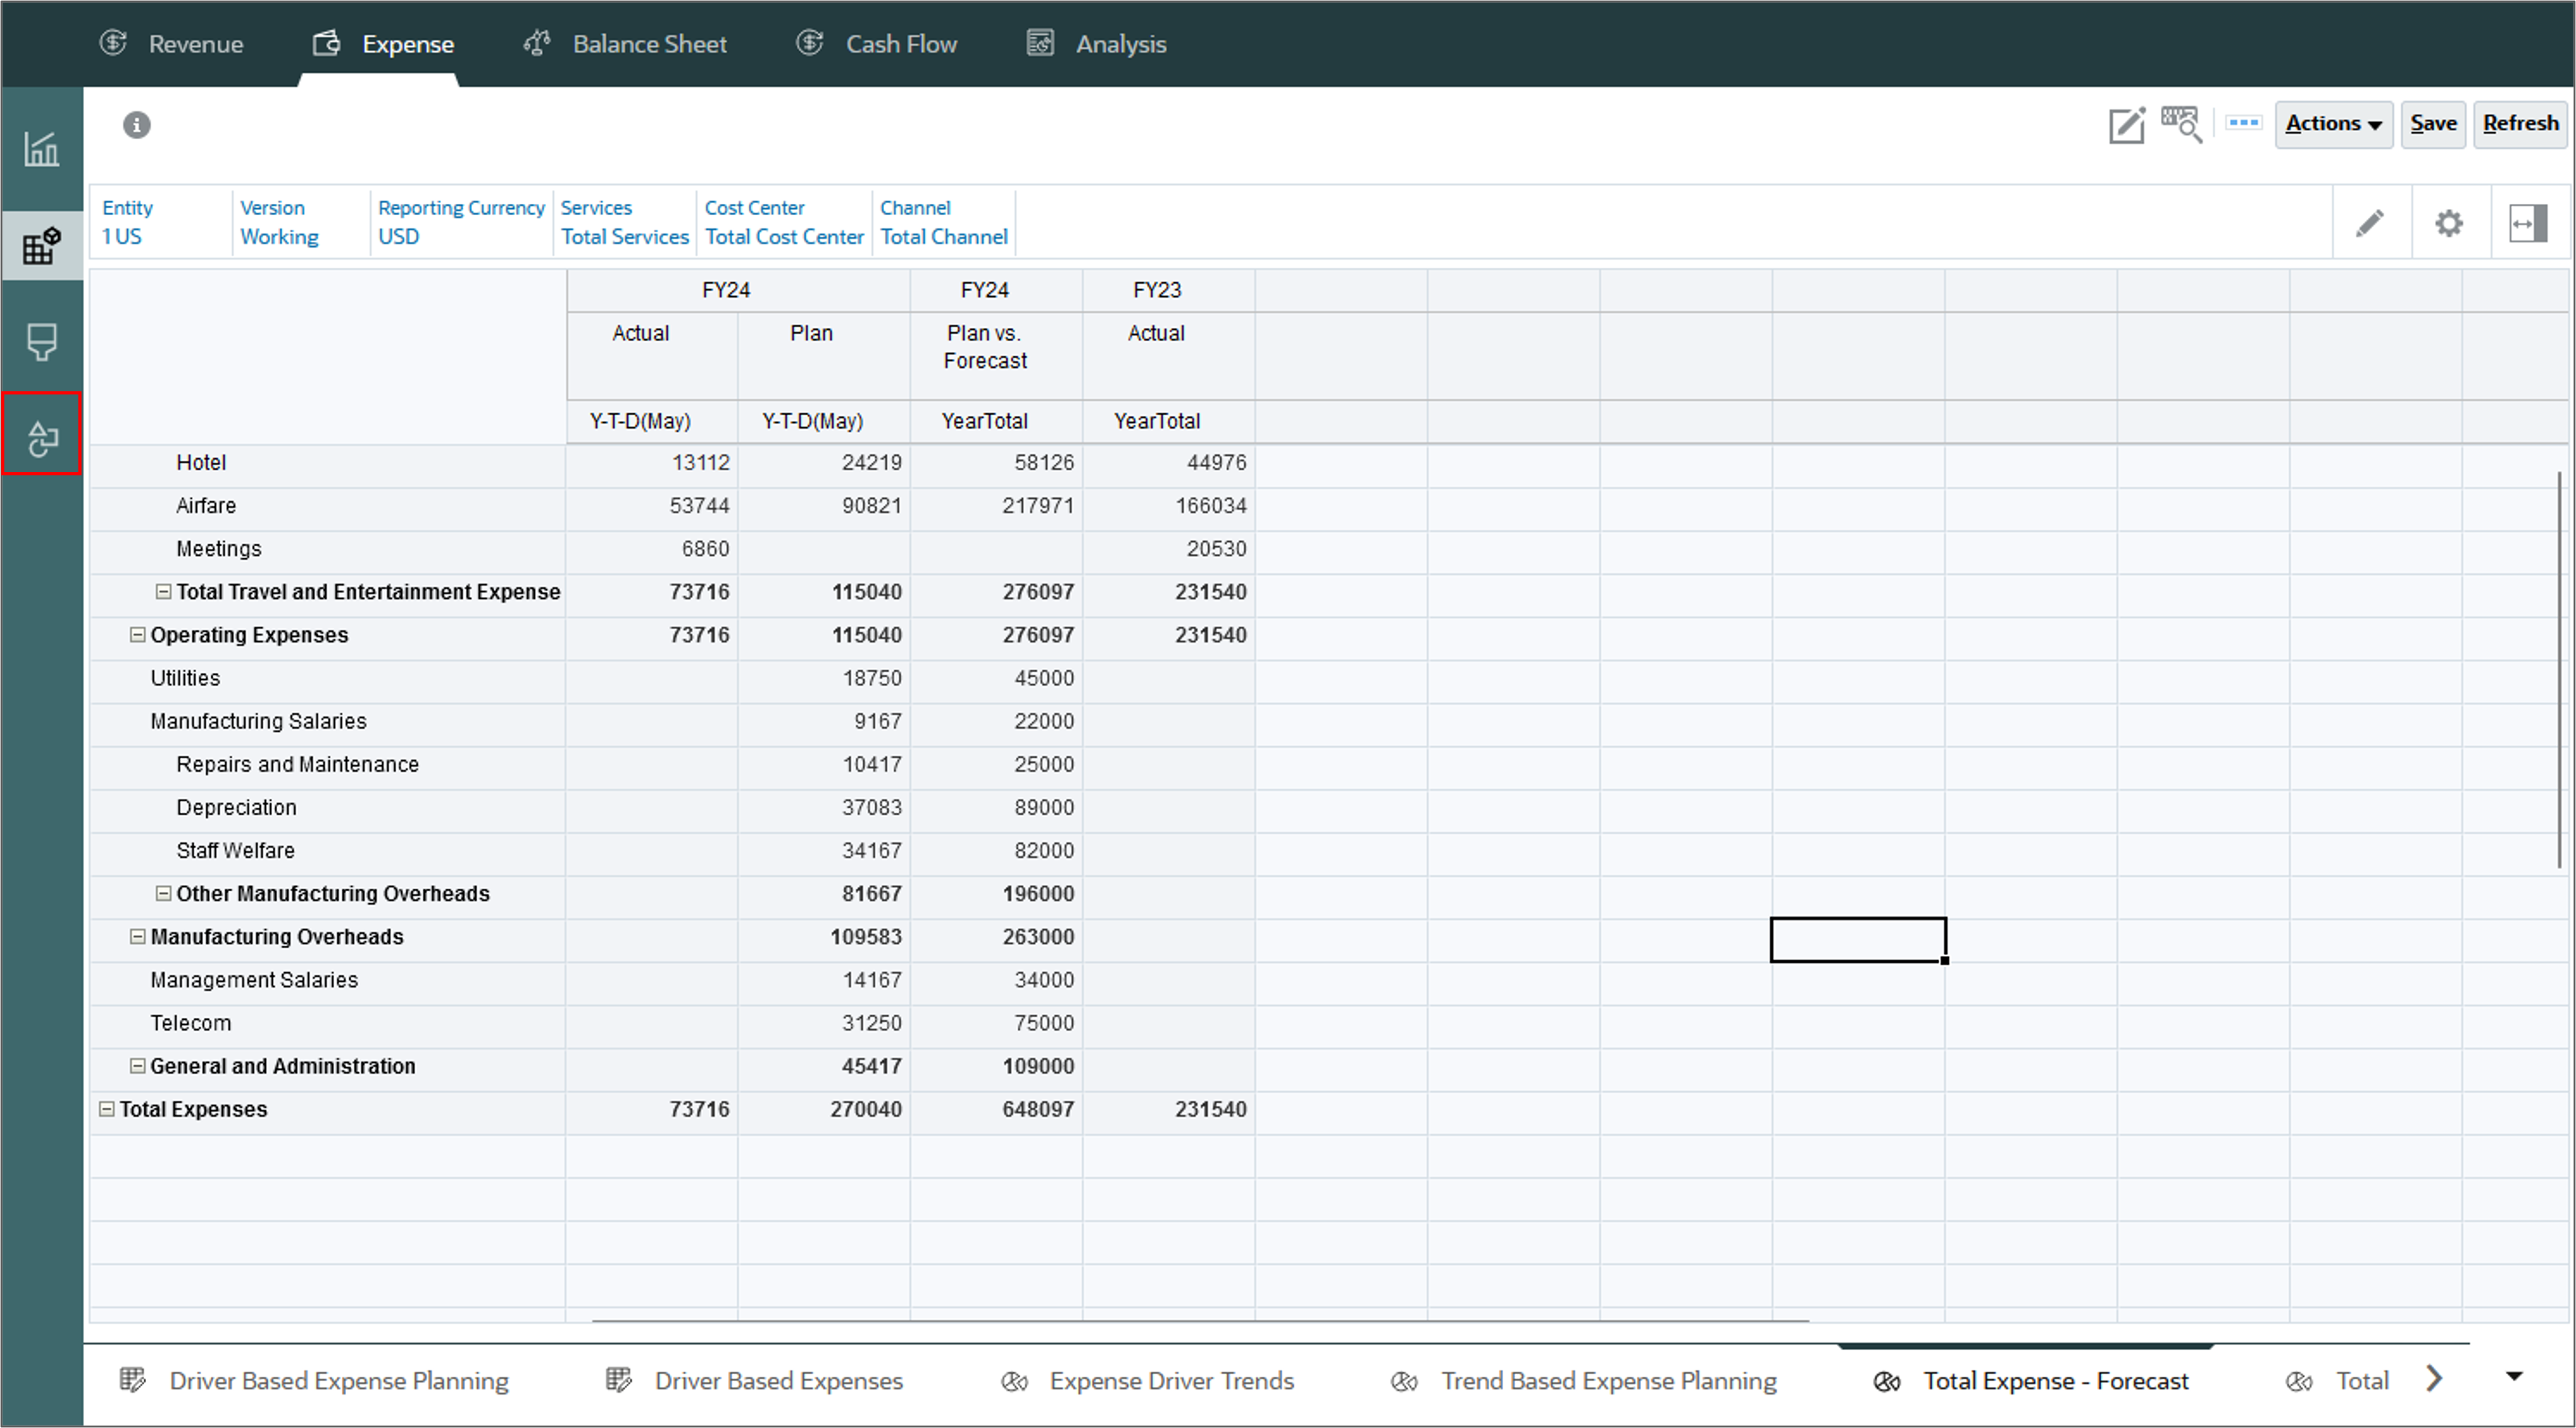
Rolling up forecast data
You roll up the data on the Total Expense - Forecast form.
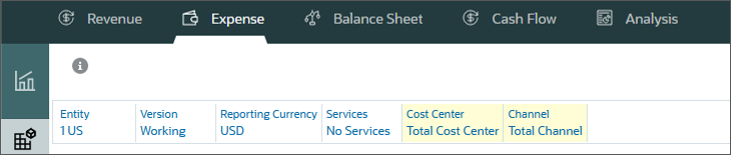
- In the POV for Cost Center, select Total Cost Center, for Channel, select Total Channel, and then click (Go):
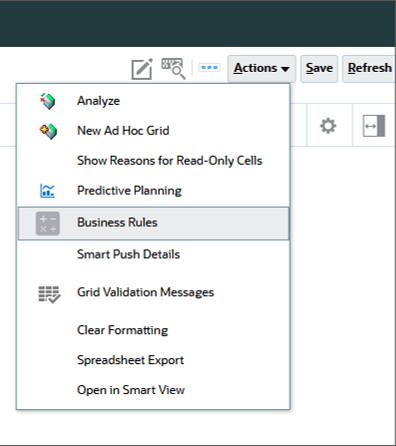
- Click Actions, and select Business Rules.
- Select Rollup.
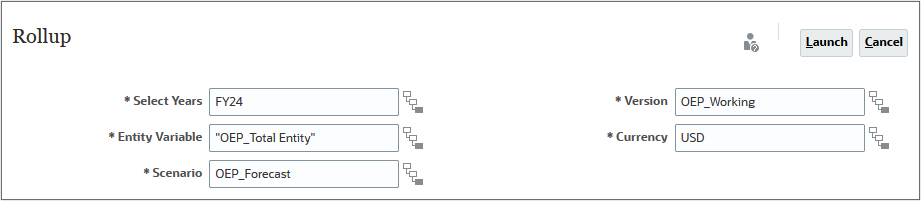
- For each item in the dialog box, click its (Member Selector) to select a member as its value:
- Select Years: FY24
- Scenario: OEP_Forecast
- Currency: USD
- Click Launch.
- At the Information message, click OK.

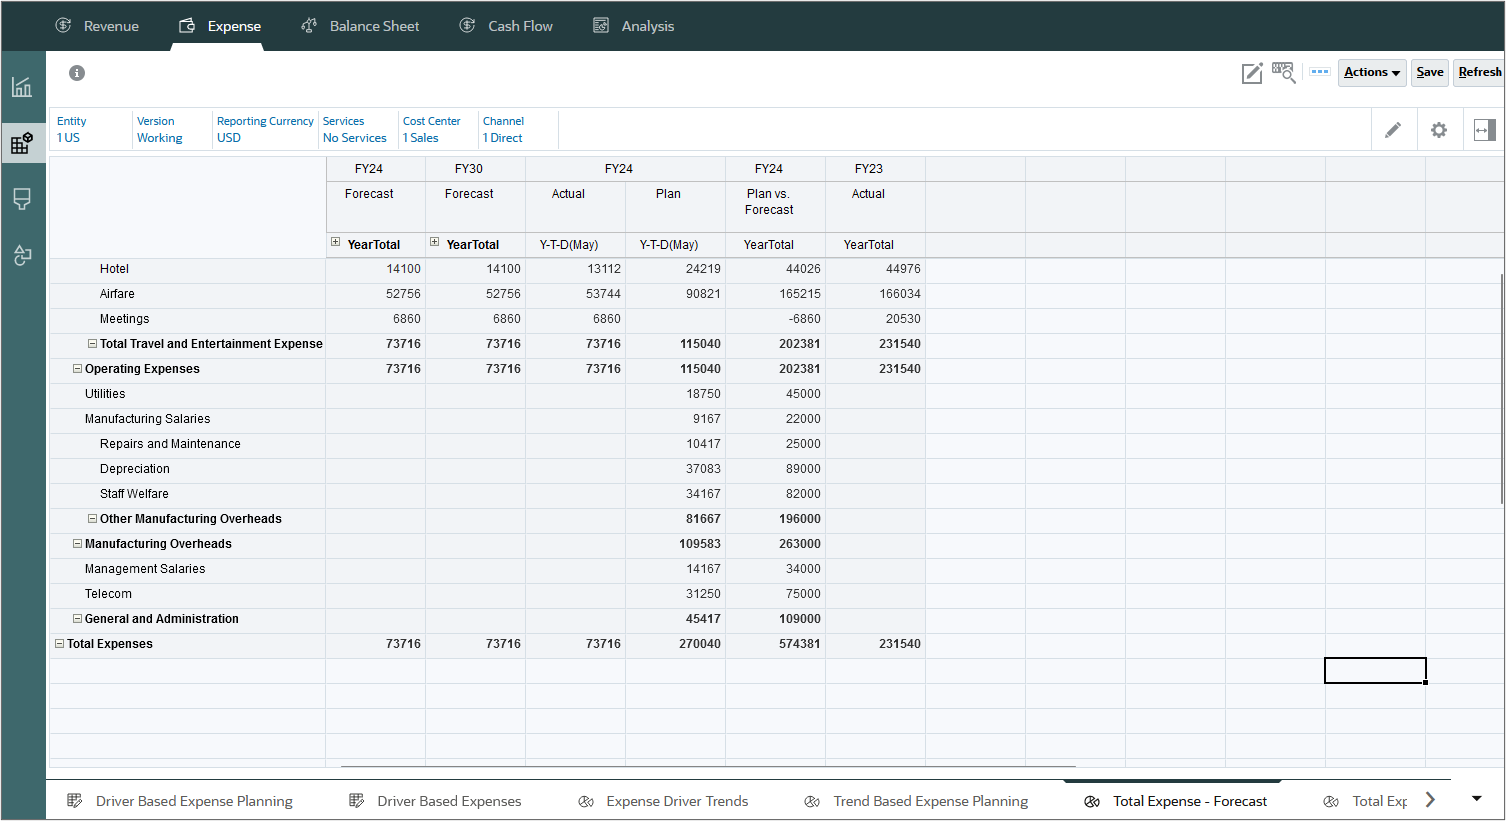
Data was rolled up and Forecast is included in the totals.
Reviewing updated financial statements
After updating the forecast, review the Income Statement.
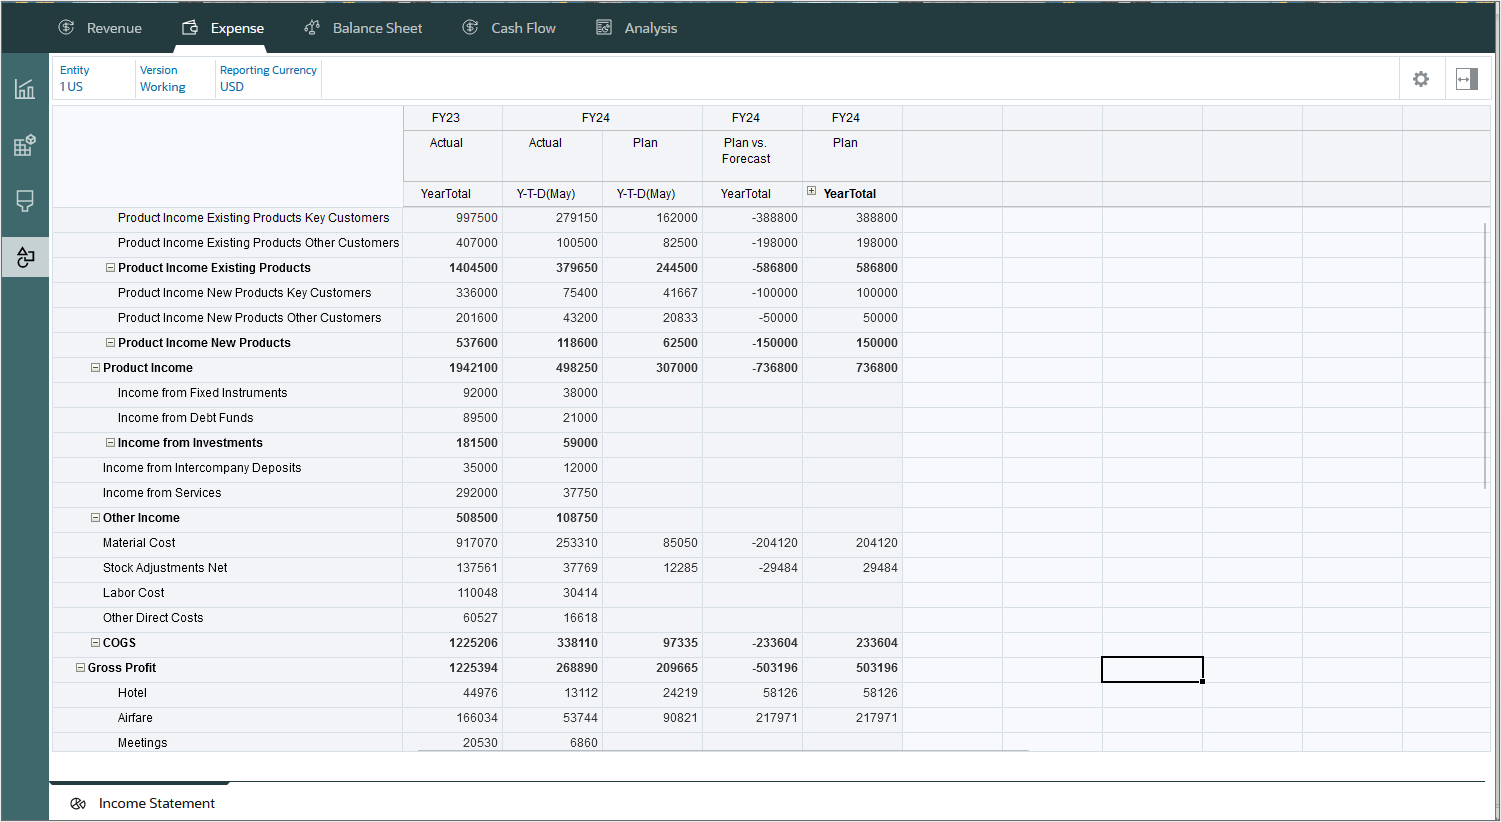
- Click the fourth vertical tab, Income Statement.
The updated Income Statement is displayed.
Related Links
Calculating Actuals and Preparing Plans and Forecasts in Financials
F97850-01
July, 2024