Introduction
This tutorial shows you how to navigate to the Cloud EPM Reports solution, migrate reports from Financial Reporting, learn about designing reports, and run reports. The sections build on each other and should be completed sequentially.
Background
With the Cloud EPM Platform Reporting solution, you can design reports with images, textboxes, charts, and grids. Insert formulas to calculate grid values and text functions to dynamically retrieve report and grid metadata. Apply robust reporting features such zooming into levels, conditional formatting, and so on.
Reports can be either dynamic, where you can select members, or a snapshot where the members are already selected. You can save an ad hoc grid as a report so that it is available to run in the future. View summaries of key data for your organization. You can view and interact with reports that have been shared with you by report designers.
The user interface is similar between business processes. Reports is embedded in each business process, with single instance reporting. You cannot point to other EPM Cloud instances. Data Sources are automatically created based on the EPM Cloud application cubes that are on the instance.
Reports, security, and POV selections are managed by the EPM Cloud platform. Reports are stored in the EPM Cloud repository.
Reports, books, and bursting definitions can be moved between environments using the EPM Cloud Lifecycle Management.
Scheduling for bursting definitions is done via the EPM Cloud platform Job Scheduler.
In this tutorial, you navigate to the Cloud EPM Reports solution, migrate reports from Financial Reporting, learn about designing reports, and run reports.
Prerequisites
Cloud EPM Hands-on Tutorials may require you to import a snapshot into your Cloud EPM Enterprise Service instance. Before you can import a tutorial snapshot, you must request another Cloud EPM Enterprise Service instance or remove your current application and business process. The tutorial snapshot will not import over your existing application or business process, nor will it automatically replace or restore the application or business process you are currently working with.
Before starting this tutorial, you must:
- Have Service Administrator access to a Cloud EPM Enterprise Service instance.
- Have the Planning sample application (Vision) created in your instance.
Navigating to Reports
In Planning, reports are managed on the first tab in the Reports card.
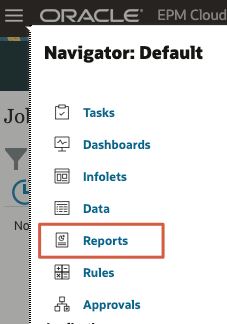
- On the home page, click Reports.
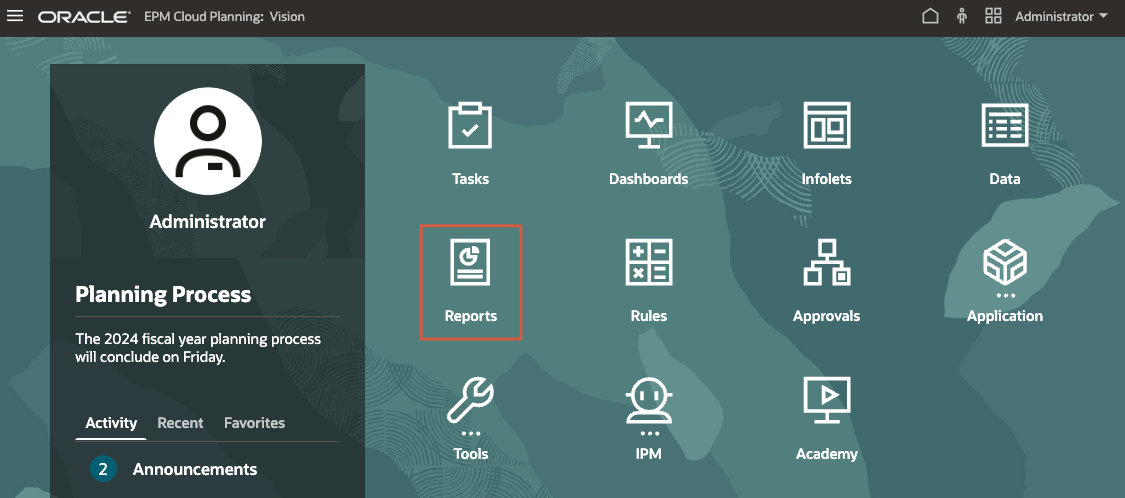
Reports is opened and displayed on the first vertical tab.
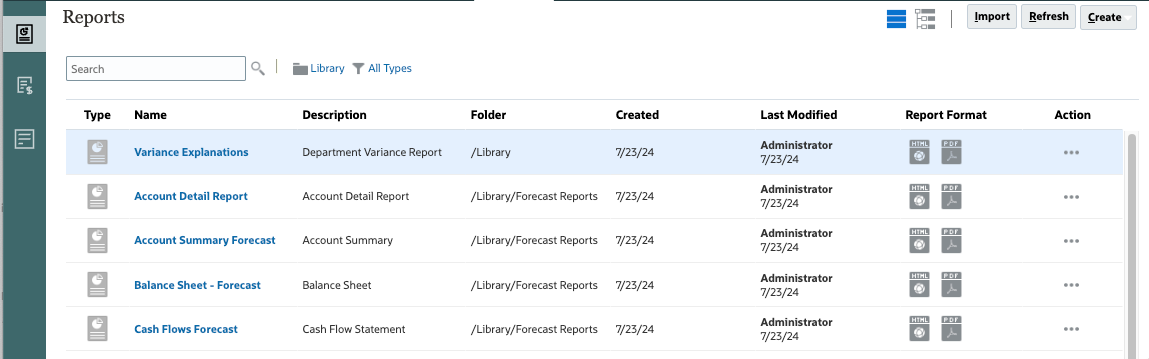
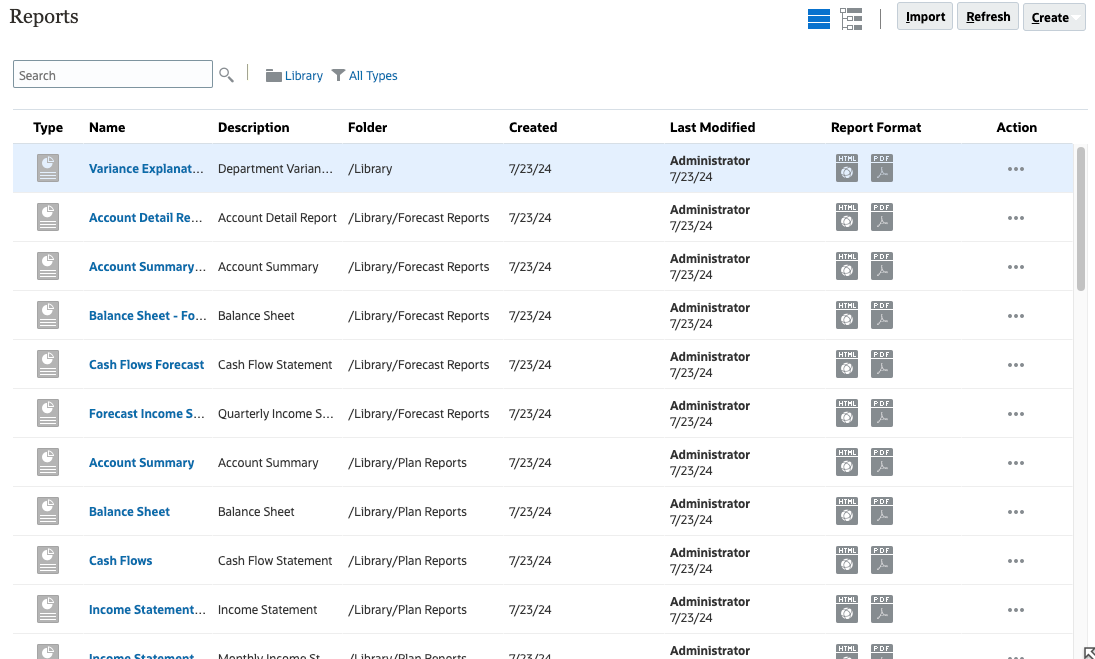
- Review the contents of the Reports tab.
Reports are organized in folders. You can import reports from Financial Reporting, refresh the contents of the page, and create Reports with Report Designer, books, and bursting definitions.
Migrating Reports from Financial Reporting
You can migrate reports created in Financial Reporting to Reports.
When migrating, the system converts as many elements of the original report into the Reports equivalent as possible. However, there are differences between the two solutions, and not all elements exist in both solutions. You may have to modify certain elements after the report has been migrated to produce a report that is equivalent to the original report.
Note:
There has been updates to announcements regarding the removal of Financial Reporting in Cloud EPM. Cloud EPM Reports replaces Financial Reporting. For more information, please visit the announcement in the EPM Resource Center on Customer Connect or refer to the Statement of Direction for Oracle Financial Reporting. You can also refer this link .Review the differences between Financial Reporting and Reports in the Designing with Reports for Oracle Enterprise Performance Management Cloud documentation.
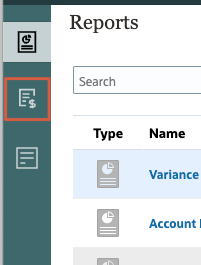
- Click
 (Navigator) and then Financial Reports.
- In Financial Reports, under Home, expand Vision, and then Forecast Reports.
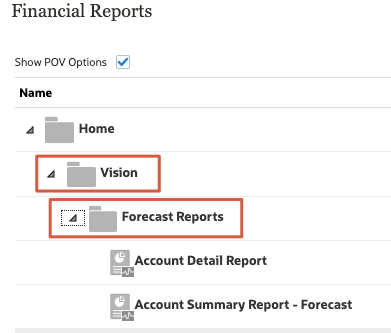
You can migrate individual reports or migrate all reports.
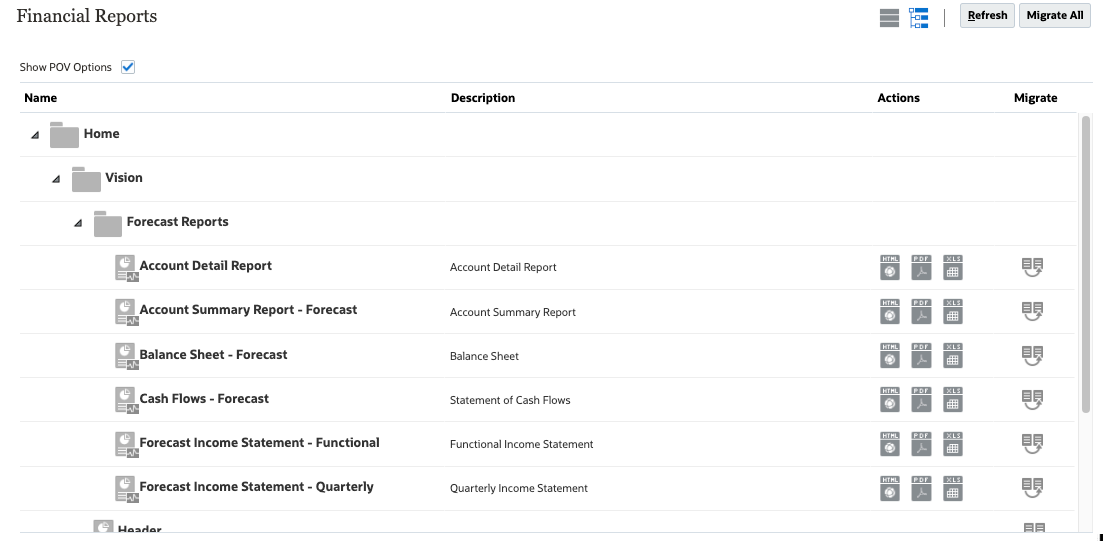
- On the upper right, click Migrate All.
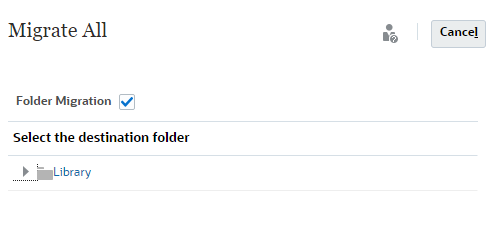
- In Migrate All, click Library.
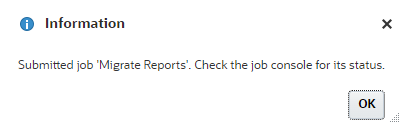
- At the information message, click OK.
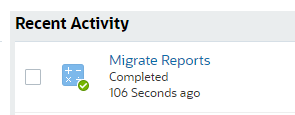
You can track the migration process in Jobs.
- Click (Navigator), and under Application, click Jobs.
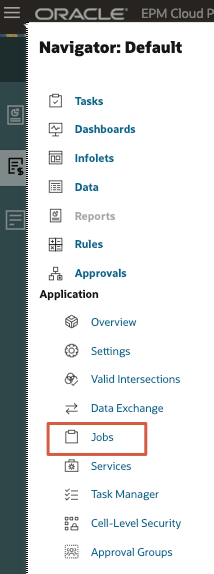
- In Jobs, locate the Migrate Reports job and verify that it completed.
- Click (Navigator) and then Reports.
- In Reports, review the imported reports.
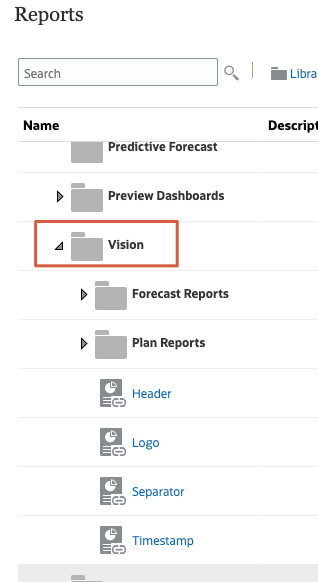
- On the upper right, click
 (Tree View).
 - Scroll down, then locate and expand Vision.
Imported reports are located under Vision.
Designing Reports Overview
Before designing a report, consider the following:
- What is the goal of the report?
- Who are the end users of the report?
- How frequently is the report generated and by how many users?
- If the report is going to be inserted into a report package, which grids and charts will be needed for that report package?
- What data sources will you need to connect to?
Design Reports by using report components, report objects, and grid components.
Report Components
- Header — An area where you can display text on the top of each page of a report. You can also add images to a header.
- Report Body — The main area of the report where you can insert and display grids, charts, images and text boxes.
- Footer — An area where you can display text on the bottom of each printed page of a report. You can also add images to a footer.
Report Objects
- Grid — A report object in which you retrieve data in the rows and columns from a multi-dimensional data source, such as a cube from a Cloud EPM business process, Essbase, or Fusion ERP.
- Table — A report object in which you retrieve data from a Cloud EPM relational schema (Enterprise licenses only).
- Chart — A report object that displays data from a grid. Charts are graphical representations of the data in a grid.
- Text Box — A report object that can contain text, or functions that retrieve data such as report settings, data values, point of view (POV) values, or dimension members.
- Image — A report object that contains a graphic or an image file. You can add images to the body of the report and to a header or footer.
- Notes — For Narrative Reporting deployments, you can insert a Note Template into a report for structured POV-based commentary entry.
- Shared — For Narrative Reporting deployments, shared objects (grids, charts, text boxes and image objects), which reside in a shared report, can be inserted in multiple reports, providing a single point of maintenance for the shared report objects.
Grid Components
- Row — A horizontal display of information in a grid. A row can contain text, data, or derived data from a calculation. You can format individual rows in grids.
- Column — A vertical display of information in a grid. A column can contain text, data, or derived data from a calculation. You can format individual columns in grids.
- Cell — An intersection of a row, column, page, and Point of View (POV) for a grid. You can format individual cells in a grid.
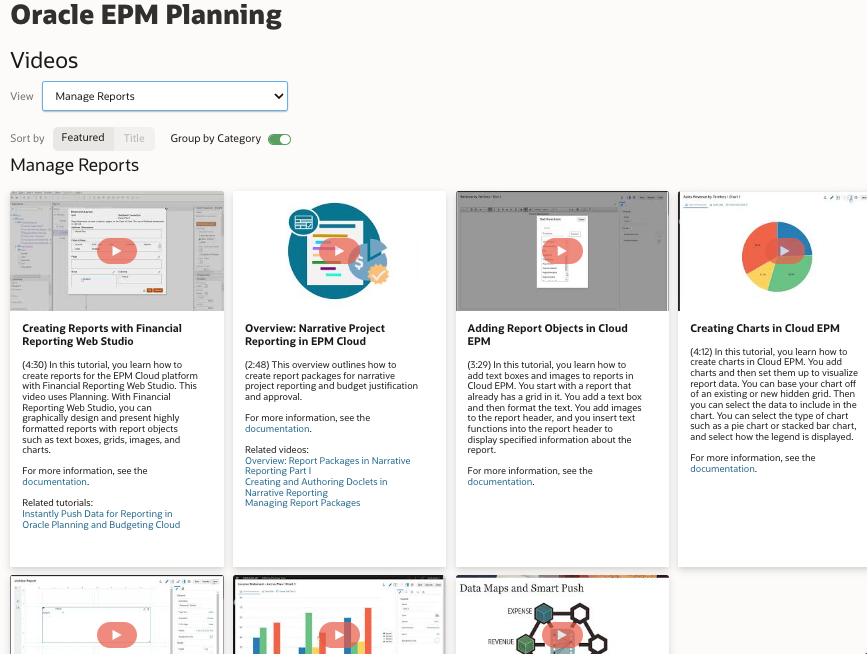
Learn more about designing reports by viewing video tutorials:
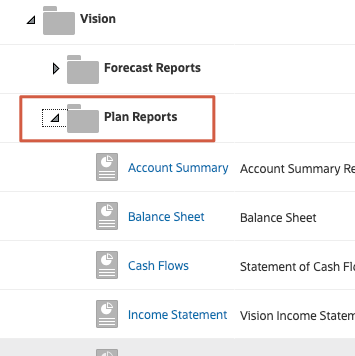
Running Reports
When you run a report, you can select either HTML, PDF or XLS. You may be prompted to select a Point of View to provide a frame of reference for the data. You also can export reports to Excel.- In Reports, under Vision, expand Plan Reports.
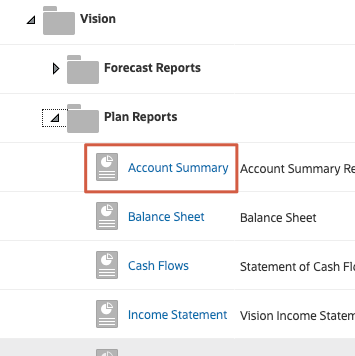
- Locate Account Summary Report.
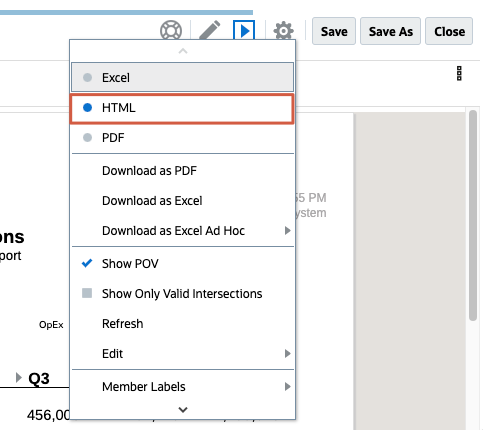
- For Account Summary Report, under the Report Format column, click
 (HTML).

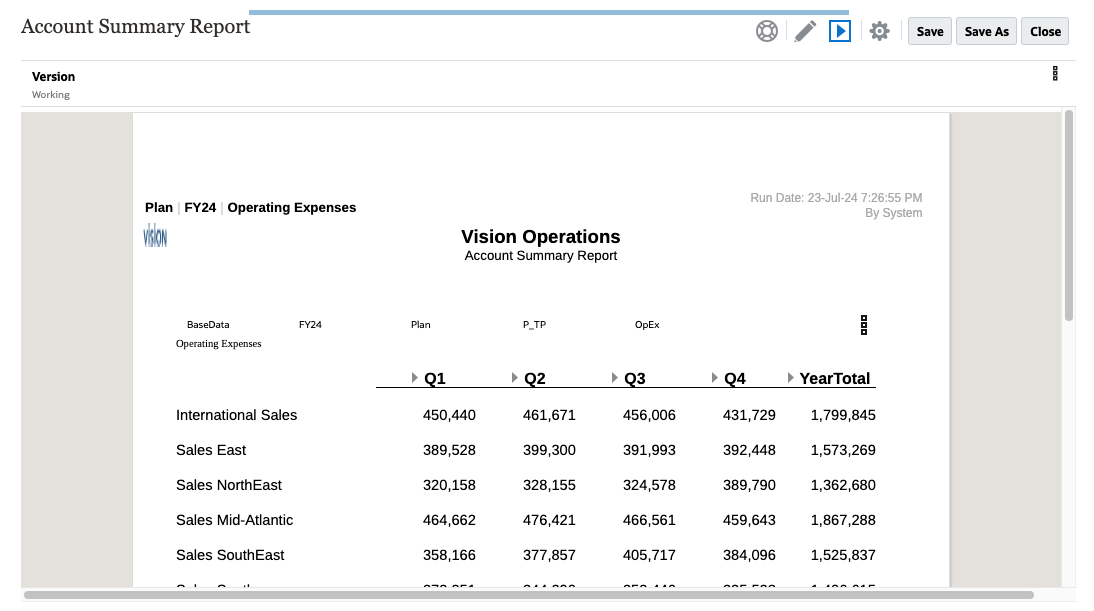
- When the report is displayed in runtime, click
 (Report Actions) and verify that HTML is selected.
- Use the scroll bars to view the contents of the report.
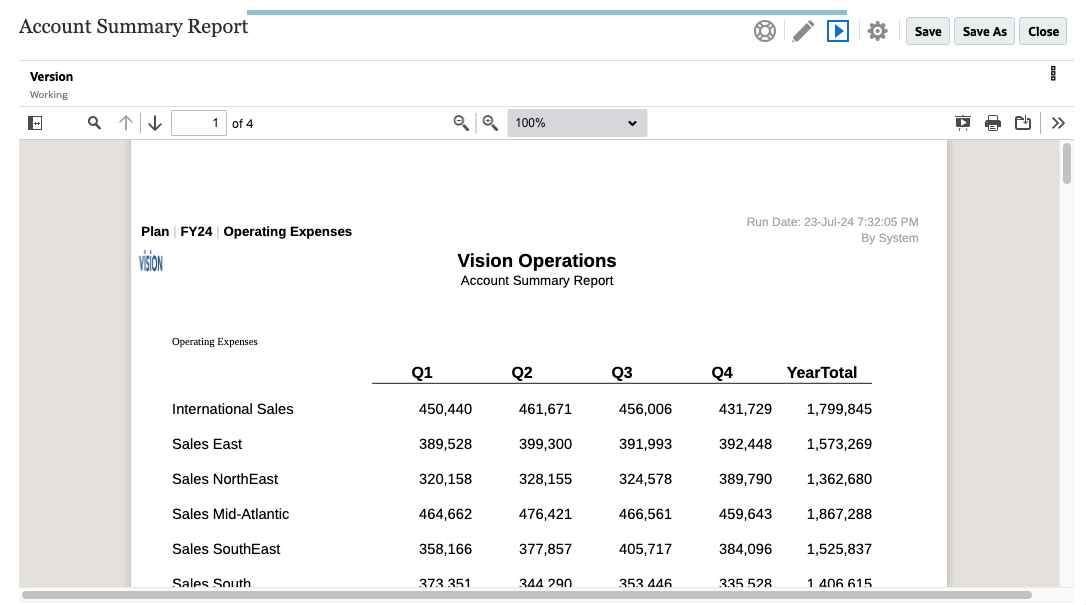
- Click (Report Actions) and select PDF.
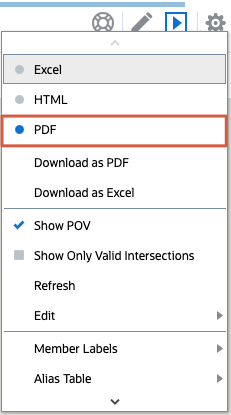
The report is opened in PDF view.
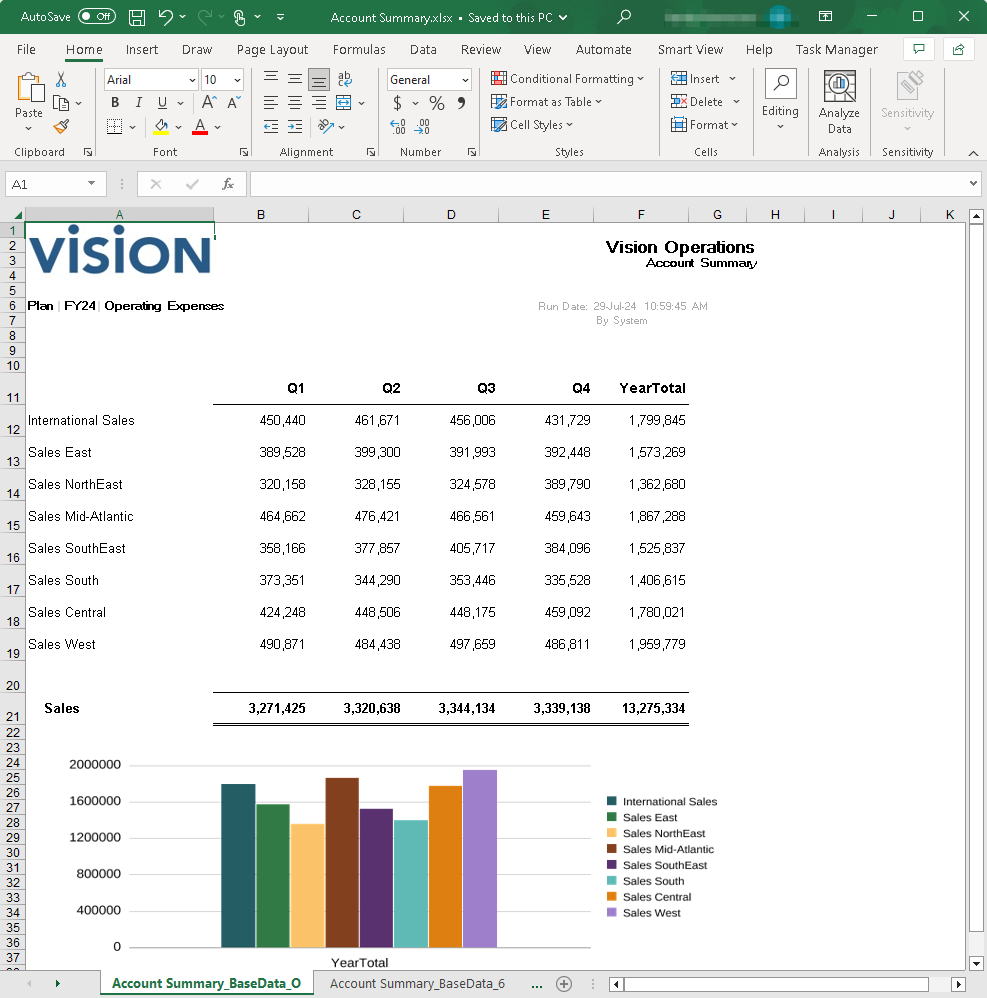
- Click (Report Actions) and select Excel.
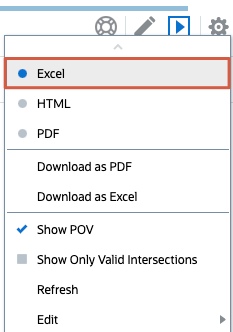
It takes a moment to export the report in Excel format.
- Depending on your browser, you may be prompted to save the file, or the file may be saved to your default downloads folder.
Navigate to the downloads folder and open the report in Excel.
- If you opened your file in Excel, return to the Account Summary Report in Planning and click Close.
Related Links
More Learning Resources
Explore other labs on docs.oracle.com/learn or access more free learning content on the Oracle Learning YouTube channel. Additionally, visit Oracle University to view training resources available.
For product documentation, visit Oracle Help Center.