JavaScript must be enabled to correctly display this content
Before you Begin
This tutorial shows you how to plan for baseline volume, add building blocks, perform gap analysis, plan trade promotions, perform what-if analysis, and analyze promotions in Key Account Planning using Use Cases. The sections build on each other and should be completed sequentially.
Background
Key Account Planning extends the capabilities of Oracle Sales Planning Cloud to let you model and plan baseline sales and trade promotions for key accounts and products based on forecasts, what-if scenarios, and desired outcomes.
Guidelines and considerations:
Key Account Planning requires hybrid block storage cubes. Any new applications you create are automatically created with Hybrid mode enabled. For older applications, you can enable Hybrid mode in the Application card.
Account and Product are required dimensions.
You can import target values from Quota Planning to Key Account Planning.
You can create two types of models: a Volume and Revenue model or a Revenue only model.
In general, you perform these tasks in Key Account Planning. The order may vary depending on your requirements.
The first step in the planning process is to perform baseline volume planning. You start baseline planning by estimating the base forecast. The baseline plan equals the base plus building blocks.
You can estimate the base using Predictive Planning or you can manually enter or load values, or copy them from actuals.
Optionally add building blocks to make non-promotional adjustments on top of the base, to arrive at a baseline plan. Building blocks are typically product, placement, and price.
Perform gap analysis to compare target versus baseline.
The Target
Baseline Gap = Target – Baseline.
Plan trade promotions to bridge the gap between the target and baseline.
Perform what-if analysis to evaluate different scenarios for your promotions.
Analyze your promotions and make decisions on how to fill the gap between the target and baseline.
In this tutorial, you’ll perform Key Account Planning tasks based on Use Cases.
Use Cases
Use Case
Baseline details
Promotion details
1
Predicting the Baseline Volume and Planning for a Full Month's Promotion
Predict the baseline for each territory by key account and product
Promotion for a full period for a single product; Perform promotion what-ifs
2
Planning for Partial Month Trade Promotions
Update the baseline
Promotion for a partial period for a single product including adjustments
3
Planning with Building Blocks and Promotions Across Periods
Include building blocks in the baseline
Promotion across periods for a single product
4
Overlapping Promotions
Update the baseline
Promotions that overlap for a single product
5
Promoting Multiple Products
Update the baseline
Promotions that are assigned to multiple products
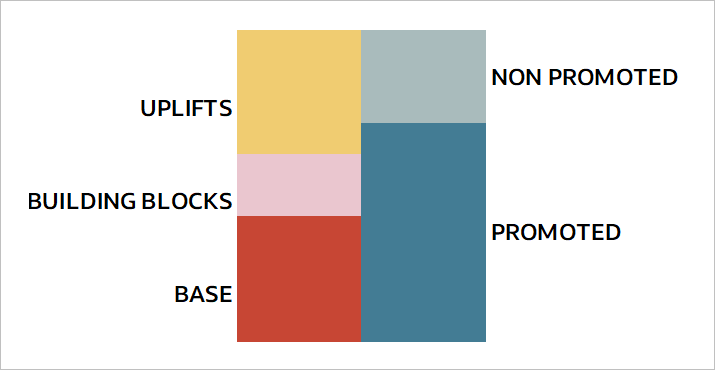
In Key Account Planning, Total Sales is calculated based on the following:
Total Sales = Baseline[Base + Building Blocks] + Uplifts
Or
Total Sales = Promoted + Non Promoted
Total Sales are calculated from sales incurred during promoted and non-promoted periods.
The SPromPln application used in this tutorial was configured with both Quota Planning and Key Account Planning enabled. Metadata and data were loaded, and the required rules were run to process the data.
Note:
Learn how to configure Key Account Planning from the following video tutorials:
An Oracle Sales Planning Cloud or EPM Cloud Service instance allows you to deploy and use one of the supported business processes. To deploy another business process, you must request another Oracle Sales Planning Cloud or EPM Enterprise Cloud Service instance or remove the current business process.
You must have:
Service Administrator access to an Oracle Sales Planning Cloud or EPM Enterprise Cloud Service instance.
Download this spreadsheet (SPromPlan_UseCases.xlsx) to a local folder.
Download this data file (SPromPlan_CoS.xlsx) to a local folder.
Note:
If you run into migration errors importing the snapshot, re-run the migration excluding the HSS-Shared Services component, as well as the Security and User Preferences artifacts in the Core component. For more information on uploading and importing snapshots, refer to the Administering Migration for Oracle Enterprise Performance Management Cloud documentation.
Setting User Preferences
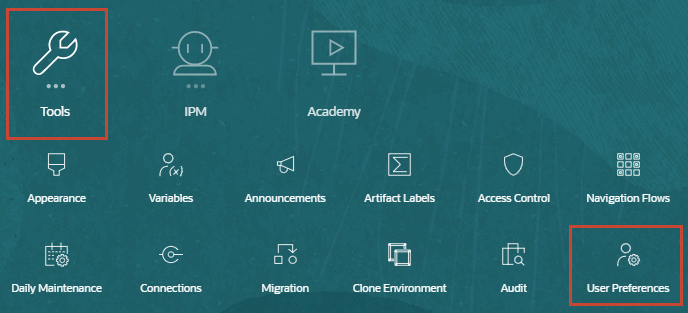
On the home page, click Tools, then User Preferences.
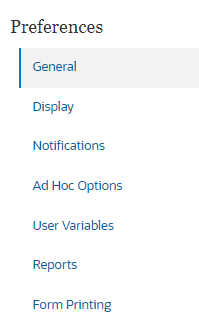
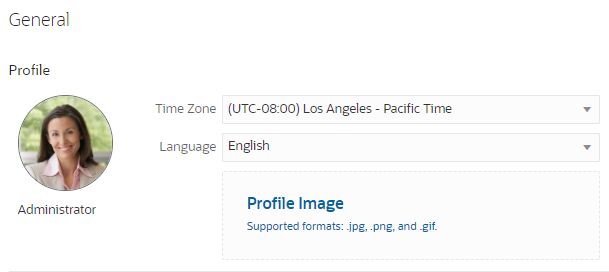
In User Preferences, verify that you are on the General tab.
Under Profile, select your time zone.
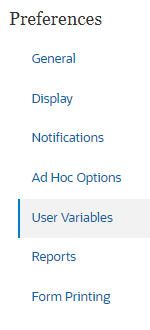
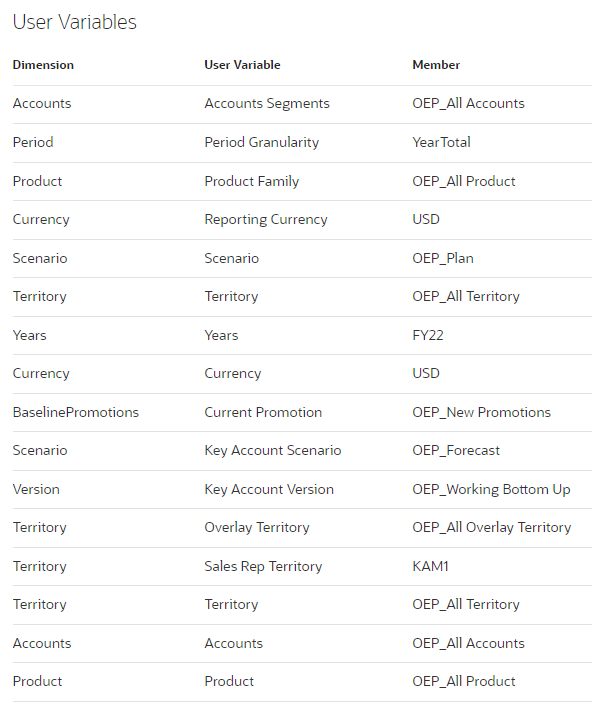
On the left, click User Variables.
Select the following members for the application's user variables:
Click Save.
At the information message, click OK.
Return to the home page. On the upper right, click (Home).
Use Case 1: Predicting the Baseline Volume and Planning for a Full Month's Promotion
In this section, you perform baseline volume planning with Predictive Planning and plan for trade promotions to close the gap between your target and baseline for a full month with these steps.
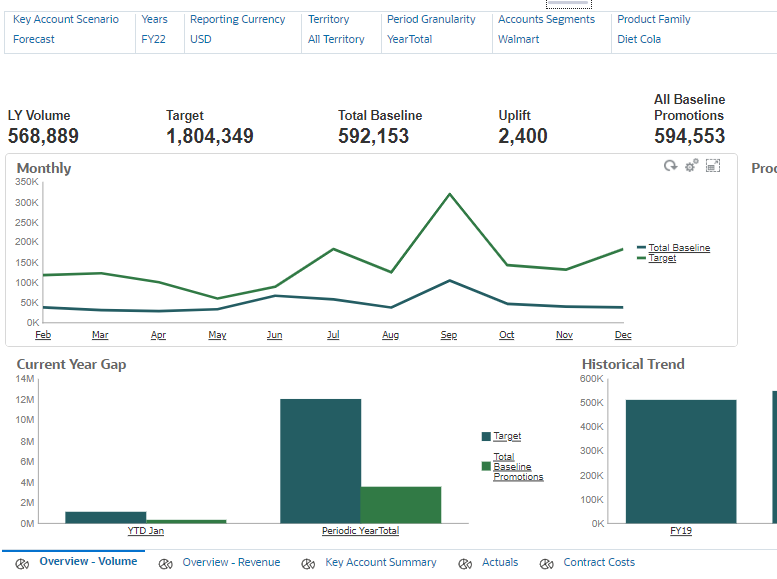
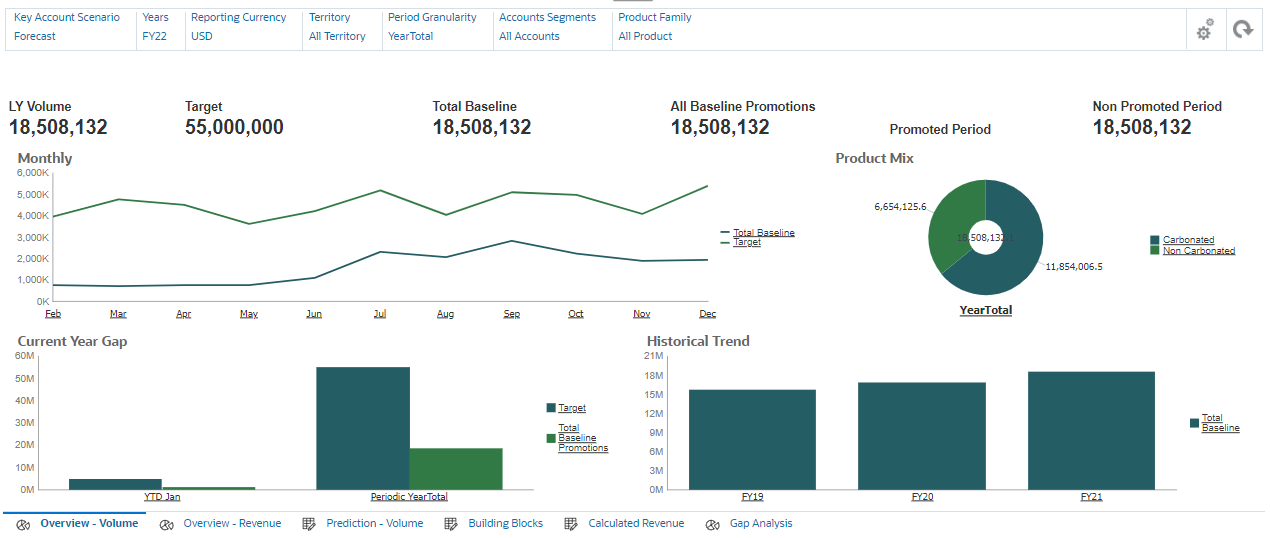
On the home page, click Key Account Planning and then Baseline.
Review dashboards to evaluate where you are in the current planning process.
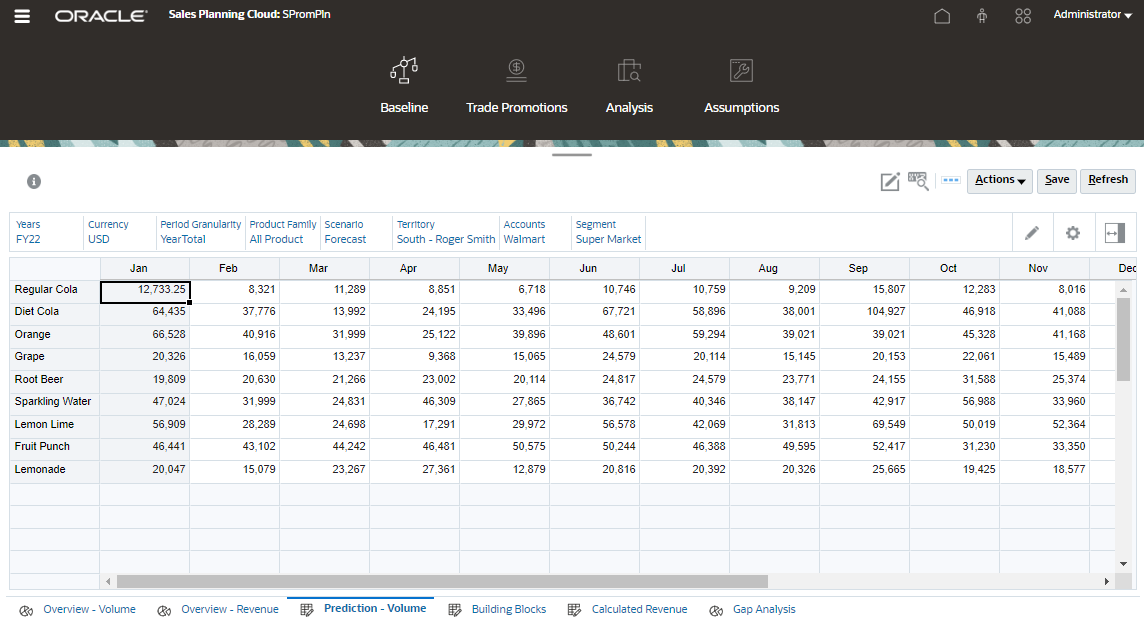
From the horizontal tabs, click Predict - Volume.
You enter data manually or derive future volume and revenue using Predictive Planning as a way to update your base forecast.
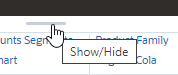
Click Show/Hide to expand the content area.
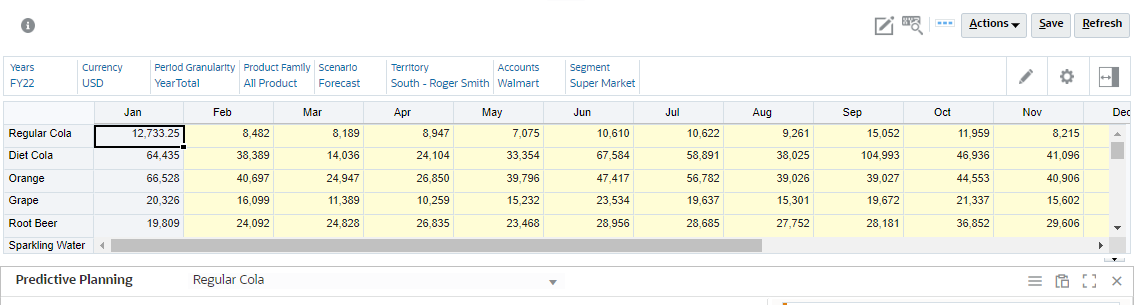
Verify the POV selections.
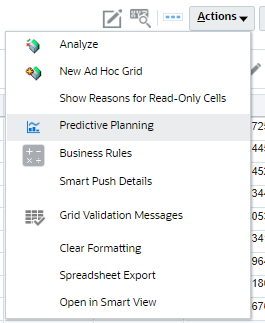
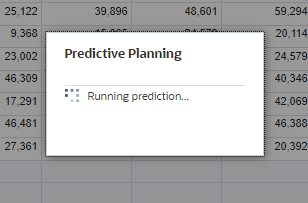
Click Actions, then select Predictive Planning.
Predictive Planning takes a moment to complete.
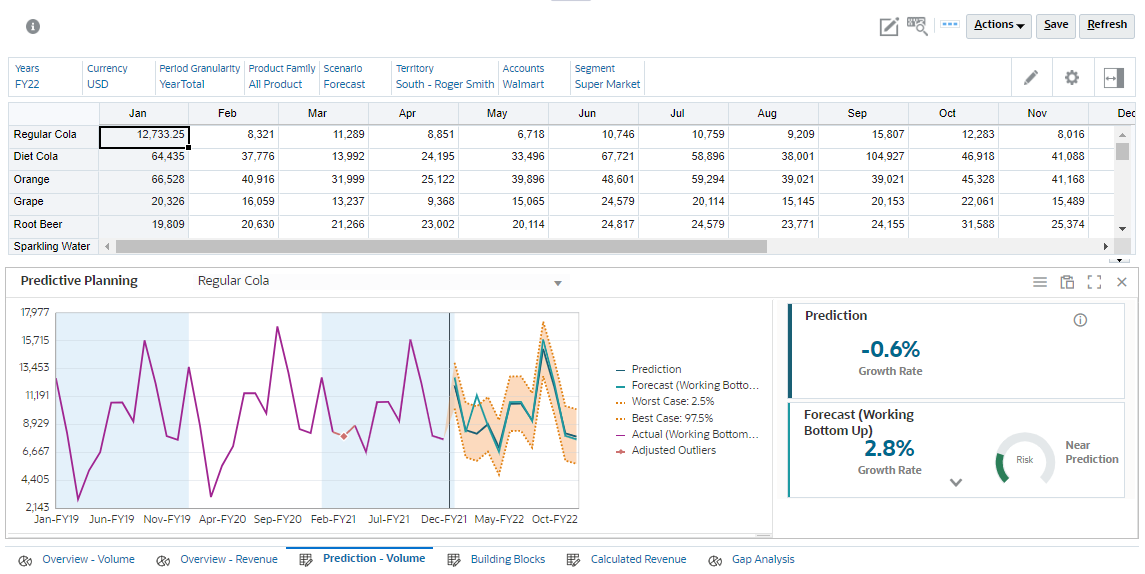
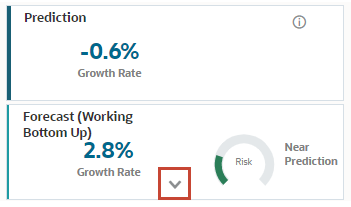
The data displayed is updated with predicted results at the bottom section.
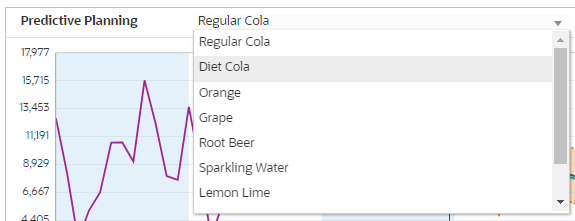
Switch between products to review results.
When finished, select Regular Cola.
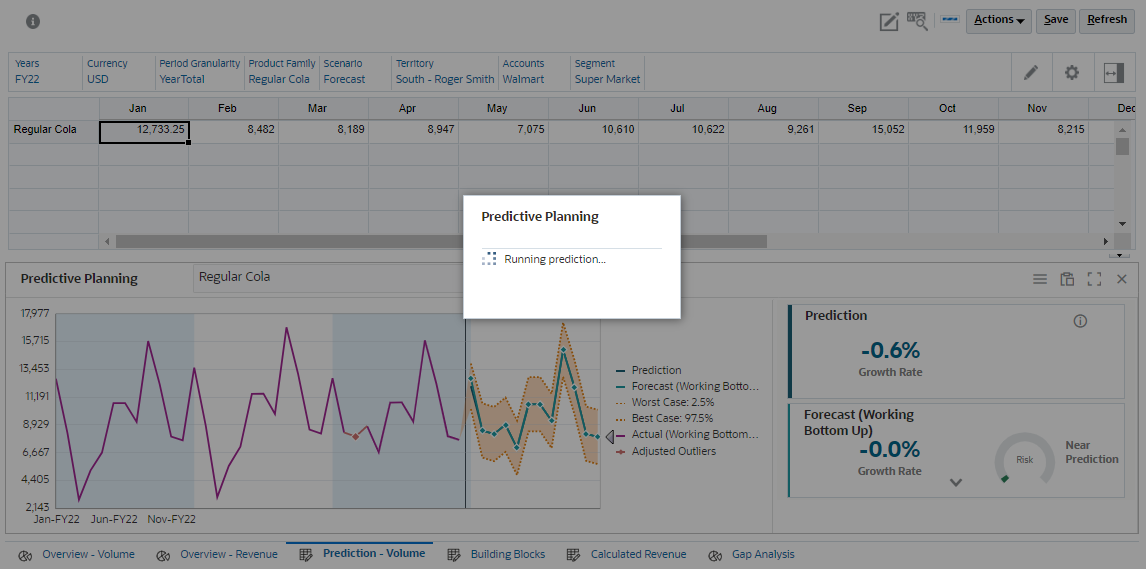
In the section displaying scenarios, click Next.
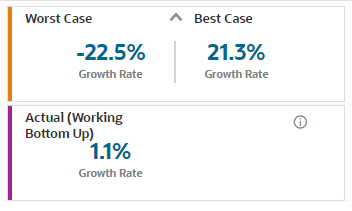
Review the details of the prediction, as well as the best case, worst case, and other scenarios.
In the Predictive Planning section, on the top-right, click (Paste).
In Paste Prediction, select or verify the following:
Copy the entire range of the prediction to the Forecast scenario for all members on the form.
Click Paste.
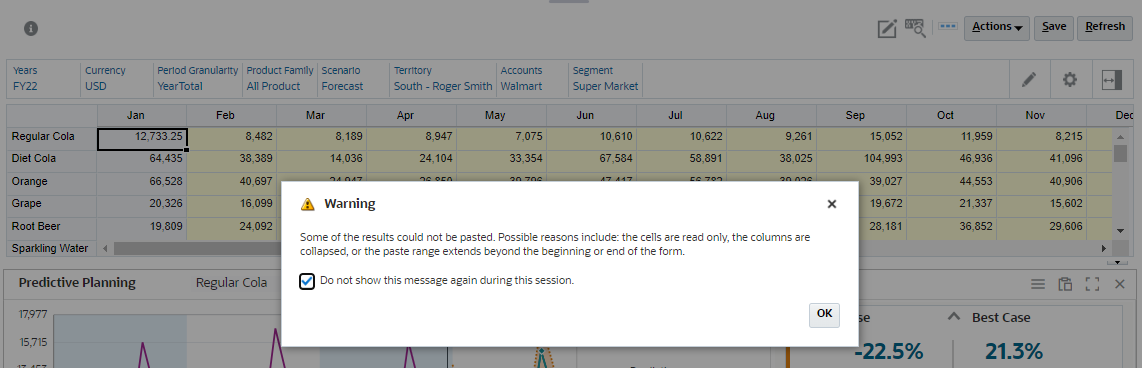
At the warning message, select Do not show this message again during this session and click OK.
The grid is updated with the pasted prediction results.
Click Save.
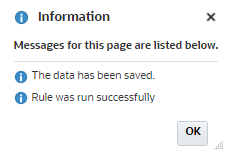
At the information message, click OK.
In the POV, set Product Family to Regular Cola.
After changing POV selections, the prediction runs to update forecasted values.
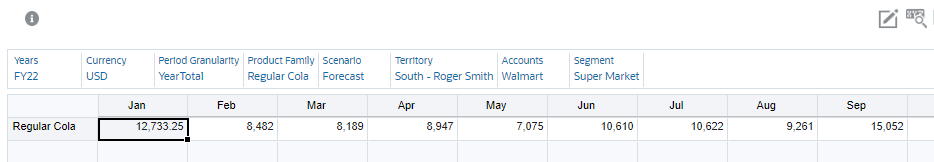
After selecting Regular Cola, the page is updated.
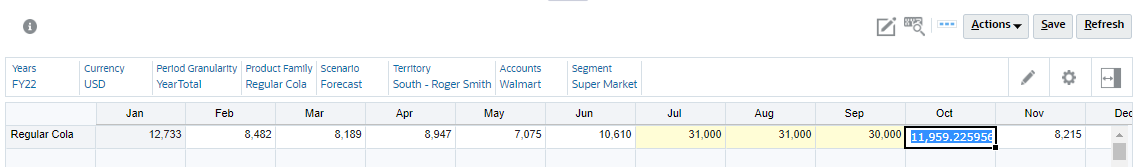
Adjust values for the months of July, August, and September:
Click Save.
At the information message, click OK.
From the horizontal tabs, click Calculated Revenue.
Review the calculated revenue based on the adjusted values.
Performing Gap Analysis
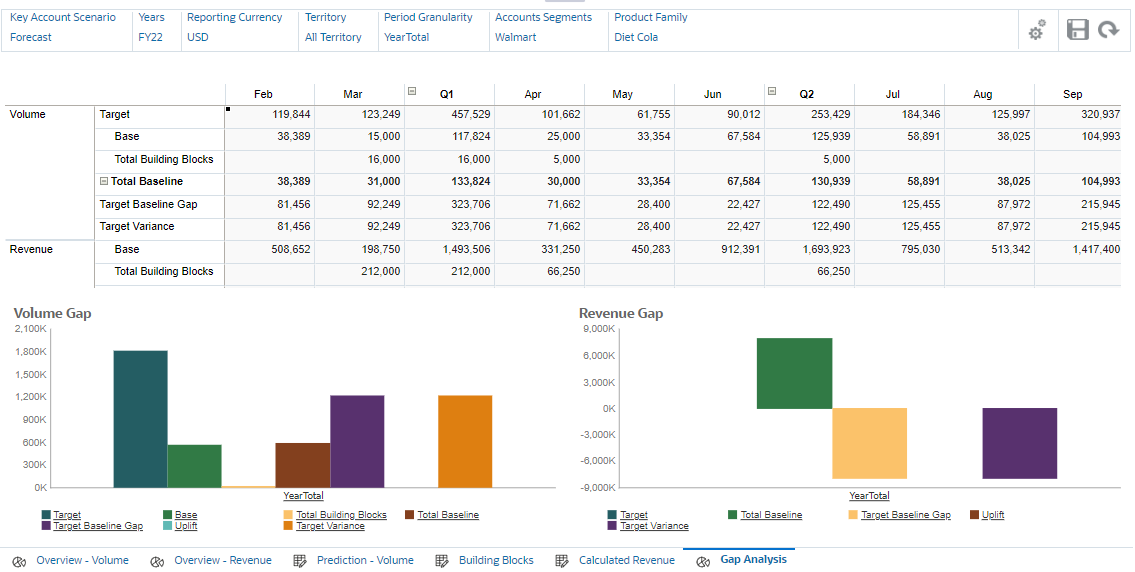
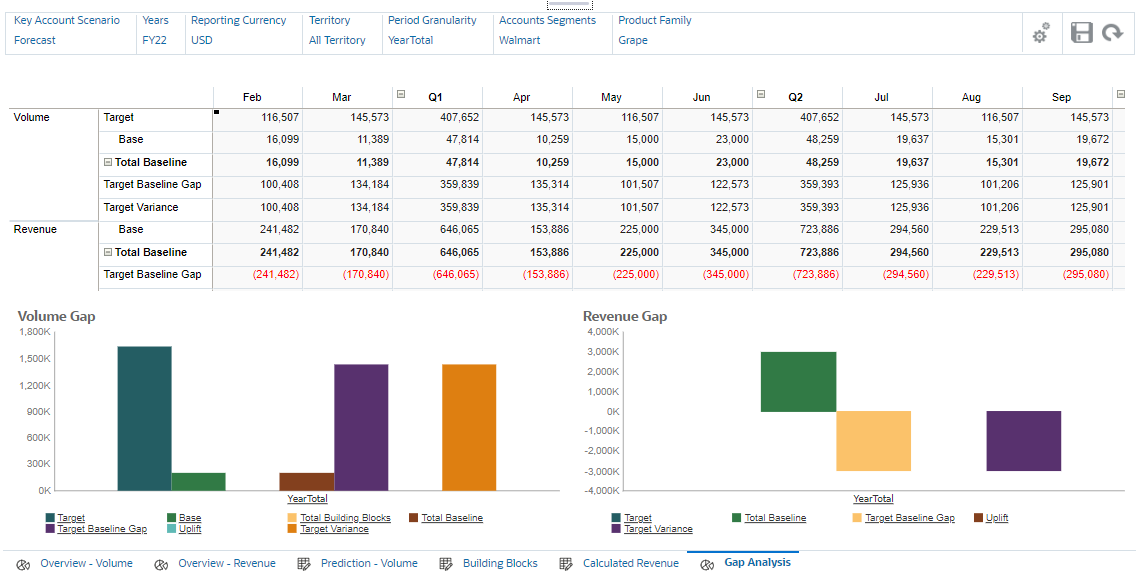
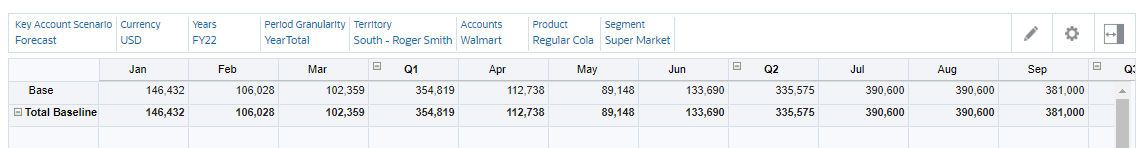
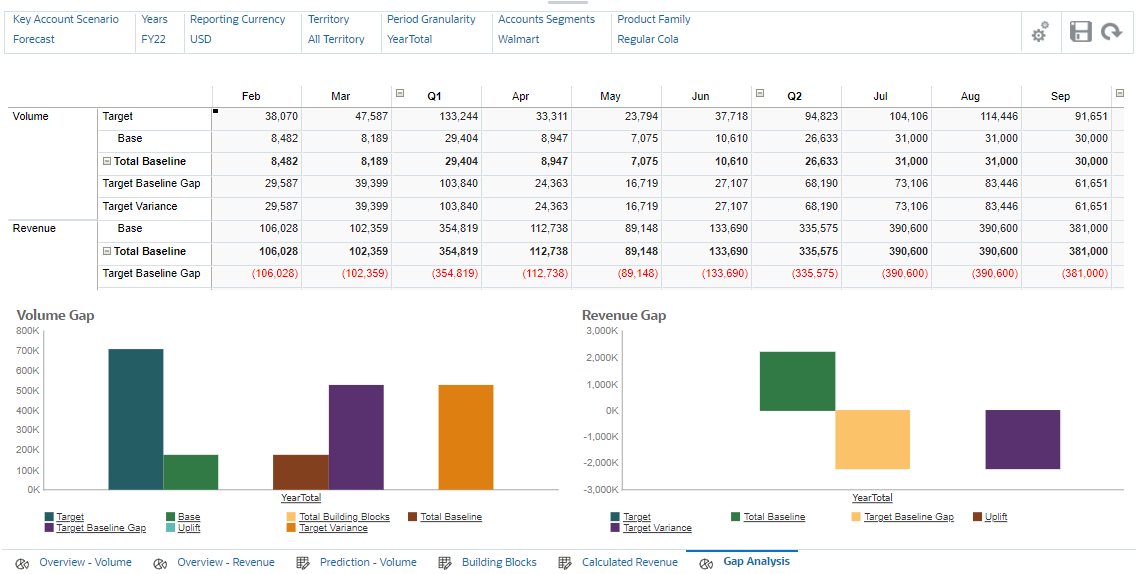
From the horizontal tabs, click Gap Analysis.
Review the gap between the target and baseline.
The gap is derived from the difference between the target and the baseline.
Target Baseline Gap = Target – Baseline
In the POV, for Account Segments, select Walmart and review the gap for that account.
Gap analysis gives Key Account Managers a view of where they are in the planning process and plan for trade promotions.
Click Show/Hide to collapse the content area.
Planning for Trade Promotions
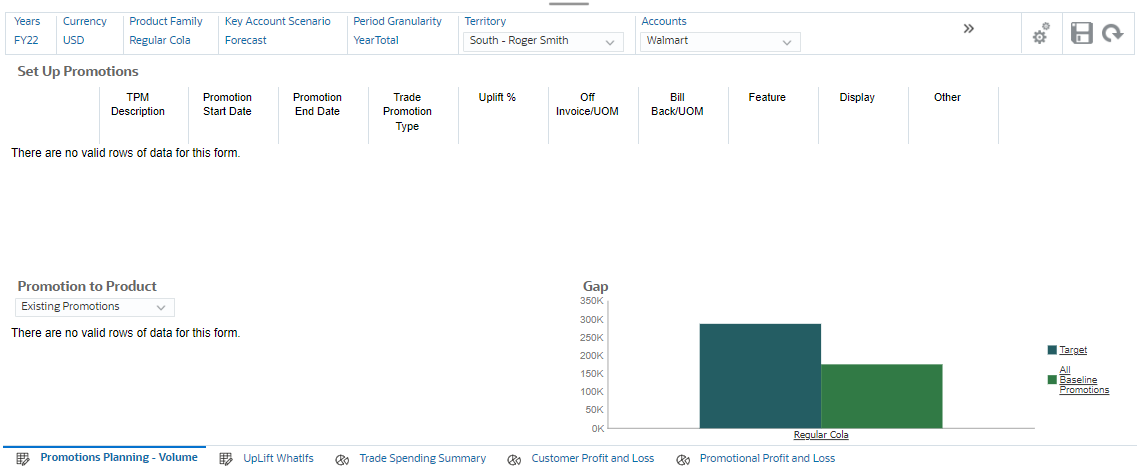
From the cards on top, click Trade Promotions.
Since the application was configured with Volume and Revenue for Baseline Planning, you will notice that only the Promotions Planning – Volume tab is displayed. In this case, the Promotions Planning - Revenue tab is not shown and revenue is derived from the volume.
Click Show/Hide to expand the content area.
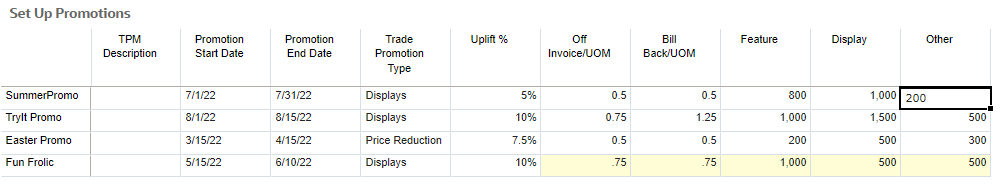
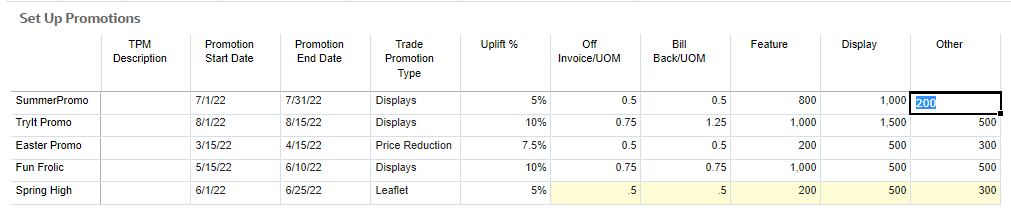
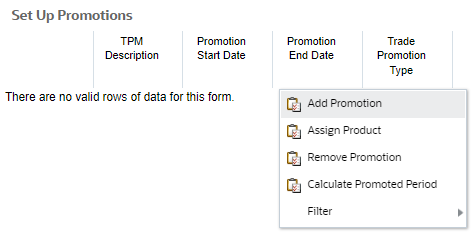
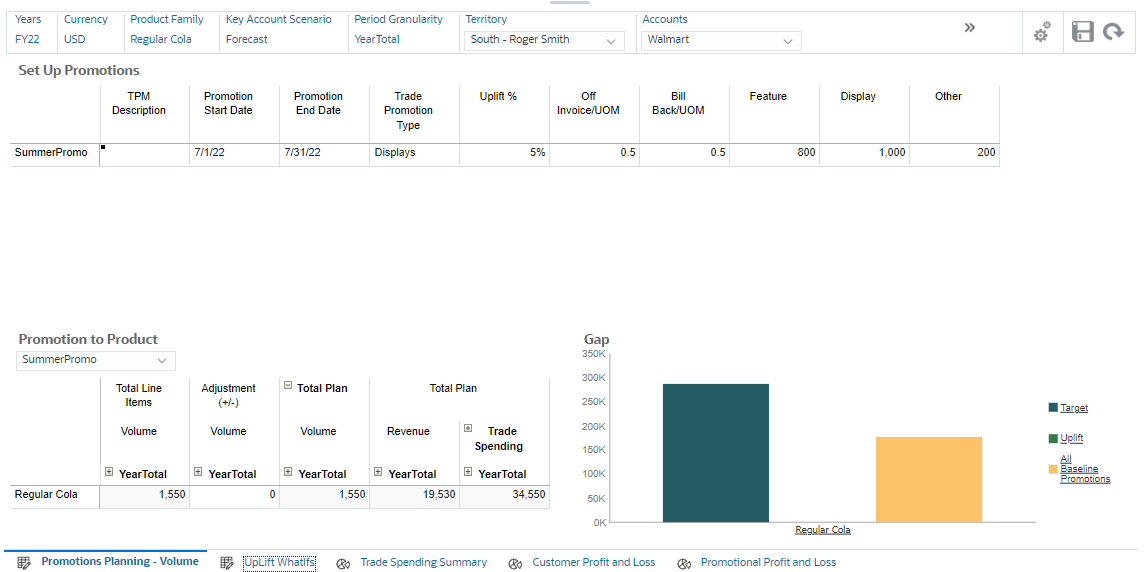
In the whitespace under Set Up Promotions, right-click and select Add Promotion.
Add, analyze, and adjust trade promotional activities to strategically close the gap between the target and the plan.
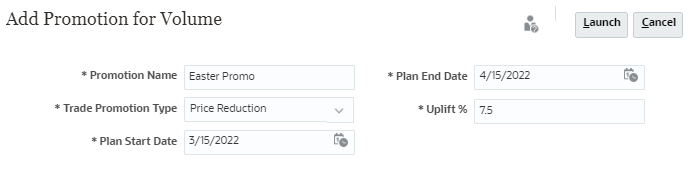
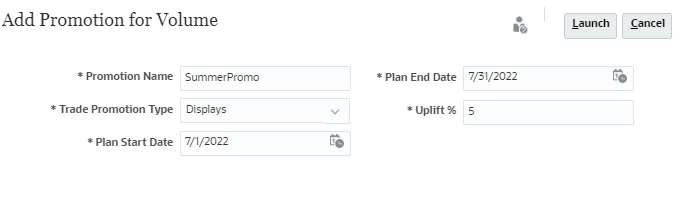
In Add Promotion for Volume, enter or select the following:
In this example, you add a promotion for the full month of July.
The uplift is the incremental sales volume you expect to get by running the promotion. It is calculated as a percentage of the baseline volume for each product.
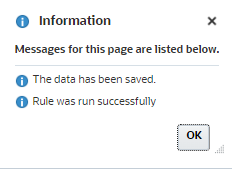
Click Launch.
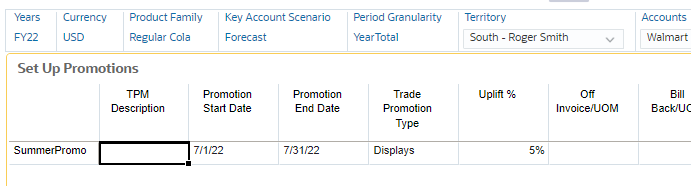
At the information message, click OK.
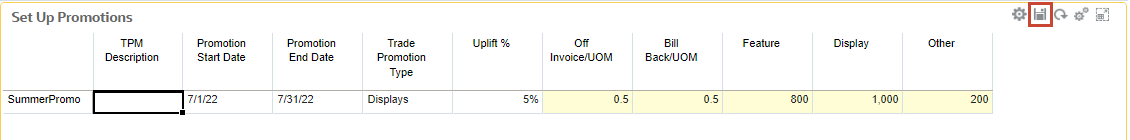
The SummerPromo trade promotion is listed in the grid.
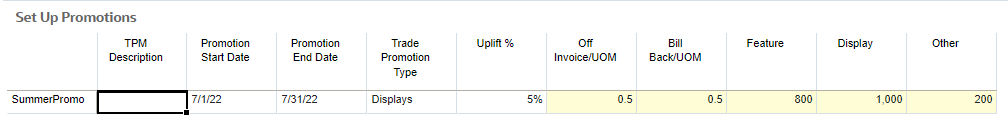
In the grid, for SummerPromo, enter the following variable and fixed spends:
Hover towards the upper-right area of the top form to display icons. Click (Save).
If prompted with an information message, click OK.
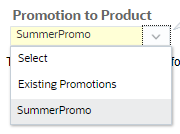
In the bottom-left form, Promotion to Product, select SummerPromo.
Click (Go).
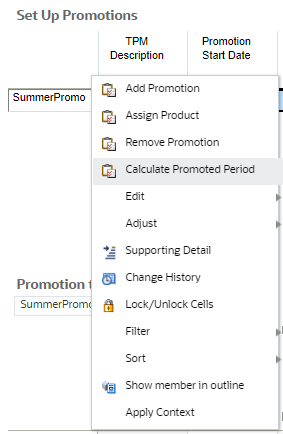
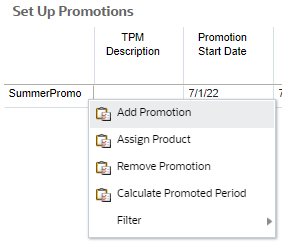
In Setting Up Promotions, right-click SummerPromo and select Assign Product.
In Promotion to Product, enter or select the following:
You can assign promotions to a single product or multiple products. In this example, you assign SummerPromo to a single product (Prod1: Regular Cola).
Click Launch.
At the information message, click OK.
The forms at the bottom of the page are updated.
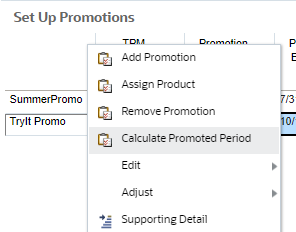
In Setting Up Promotions, right-click SummerPromo and select Calculate Promoted Period.
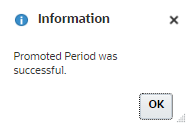
In Promoted Period, enter Prod1 and click Launch.
You run the rule to calculate the promoted period after planning for promotions. This calculates the overall KPI for promoted period volume across multiple promotions for the product and account.
You can run this rule any time after planning for promotions.
At the information message, click OK.
Performing What-If Analysis
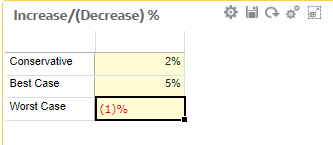
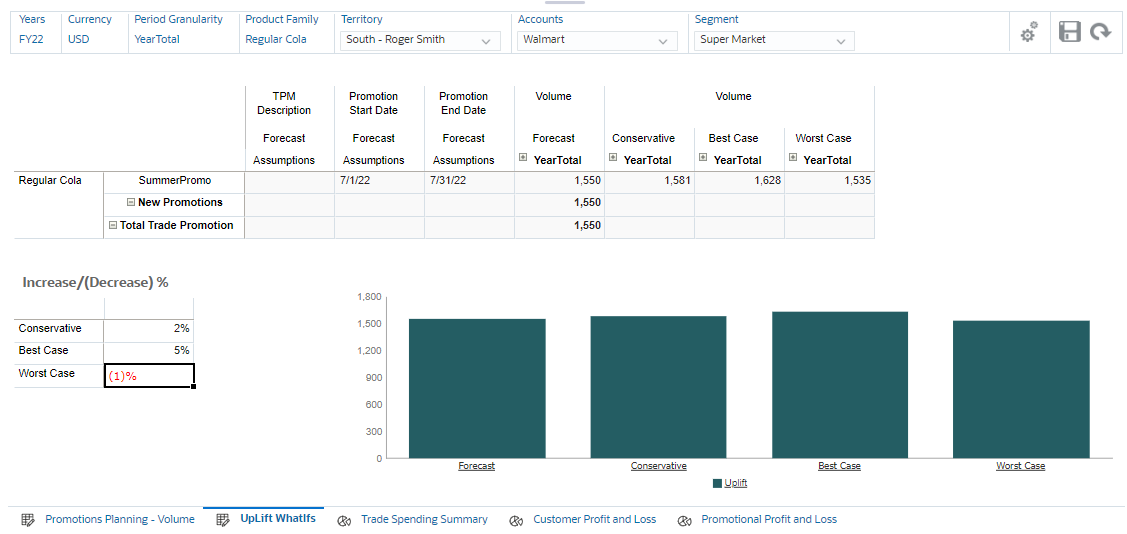
From the horizontal tabs, click UpLift WhatIfs.
Verify the POV selections.
In Increase/(Decrease)%, enter the following uplifts:
You can run simulations using a different uplift percentage and view the overall impacts based on that percentage.
Hover towards the upper-right area of the top form to display icons. Click (Save).
At the information message, click OK.
The volumes are calculated based on different What-If scenarios.
If you want to review how the calculations were made for this Use Case, download and open this spreadsheet in Excel. Review the contents of the Use Case 01 worksheet. After reviewing, return to Key Account Planning.
Analyzing Promotions
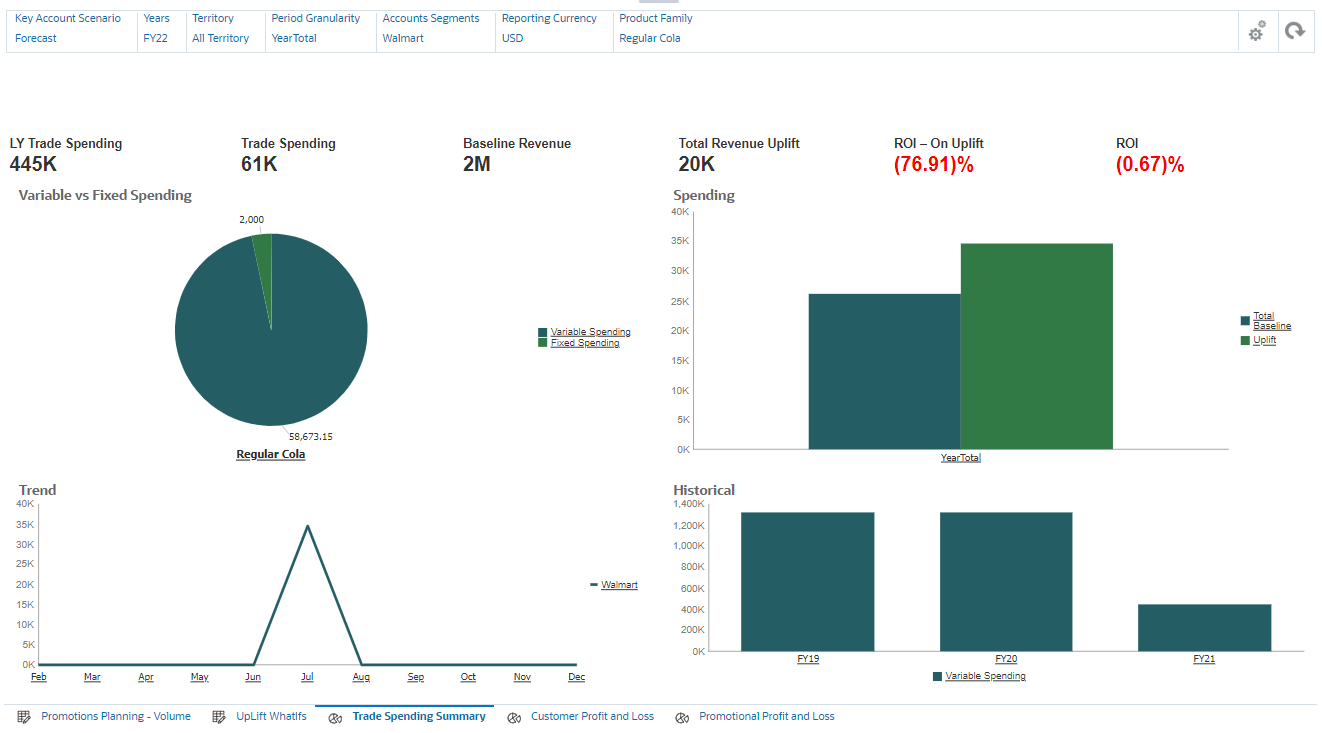
From the horizontal tabs, click Trade Spending Summary.
Review trade spend costs by key account or product segment, compare fixed versus variable spends and see the total revenue uplift, and identify the return on investment in terms of revenue for key accounts or segments.
In the POV, switch between products to display product-specific spending or to All Product to view the overall trade spends.
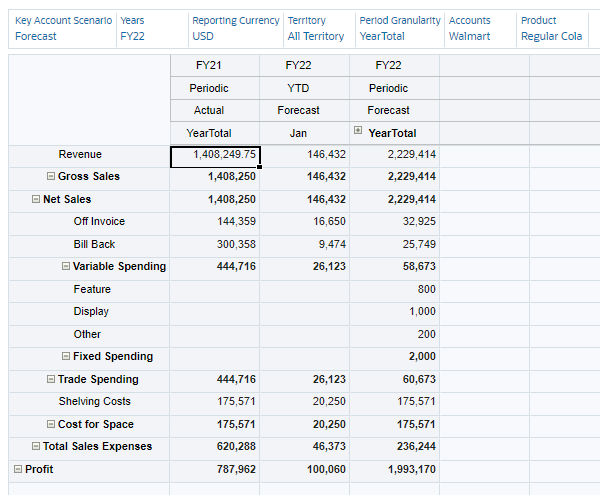
From the horizontal tabs, click Customer Profit and Loss.
In the POV, make sure to set the Product to Regular Cola.
Evaluate the profit and loss for critical accounts, product segments, and promotions, to help you understand exactly what you spend and are projected to gain through trade promotion activities.
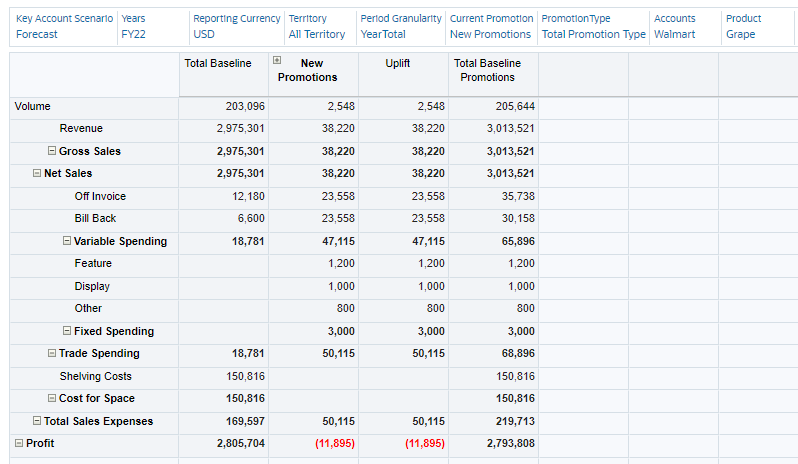
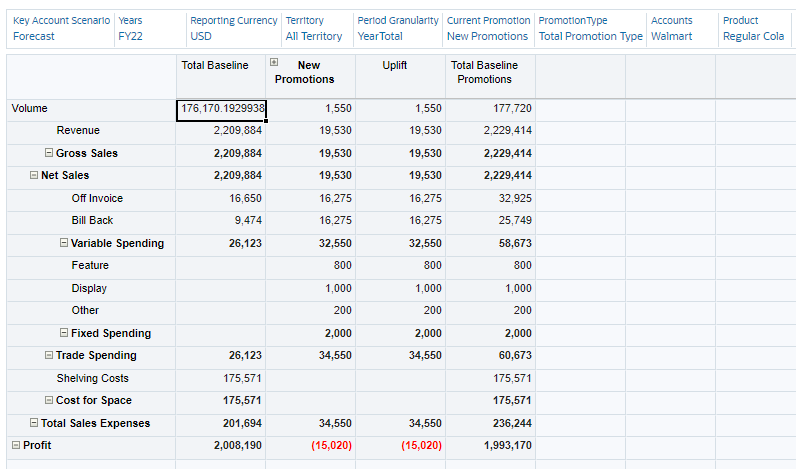
From the horizontal tabs, click Promotional Profit and Loss.
Review the baseline, promotional, and uplift data as noted in the previous step.
Click Show/Hide to collapse the content area.
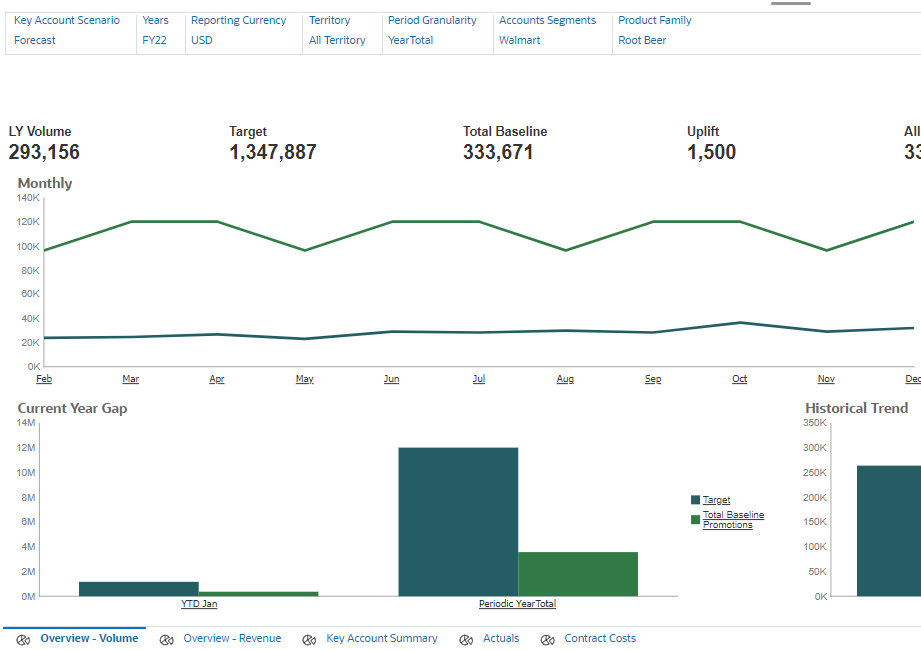
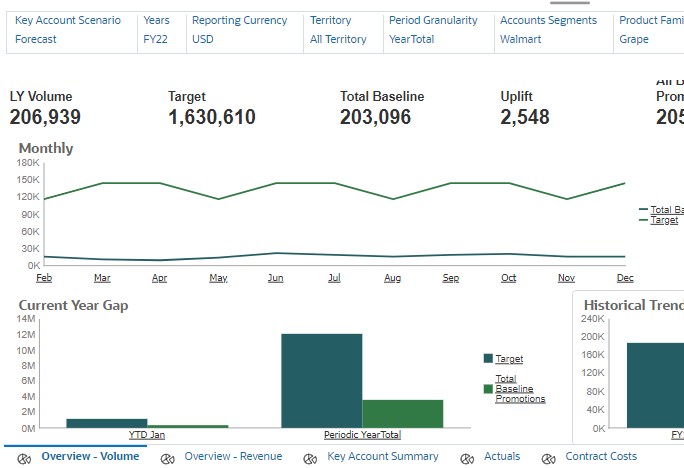
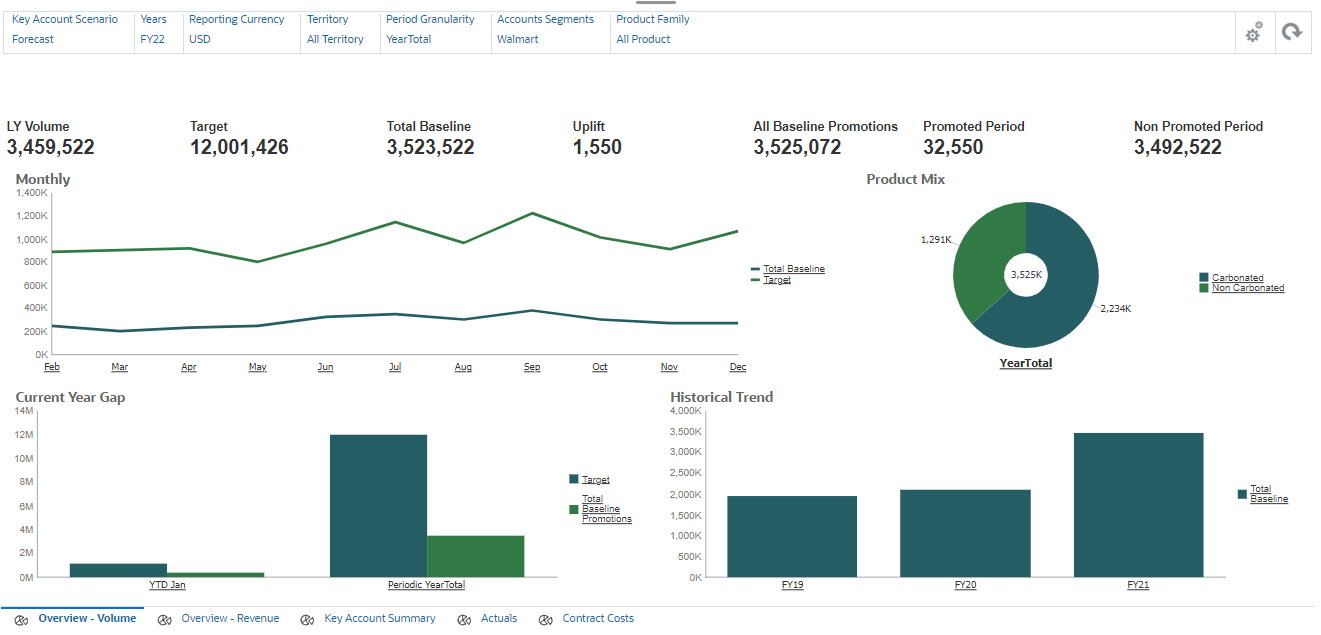
From the cards on top, click Analysis.
In the POV, set Product Family to All Product.
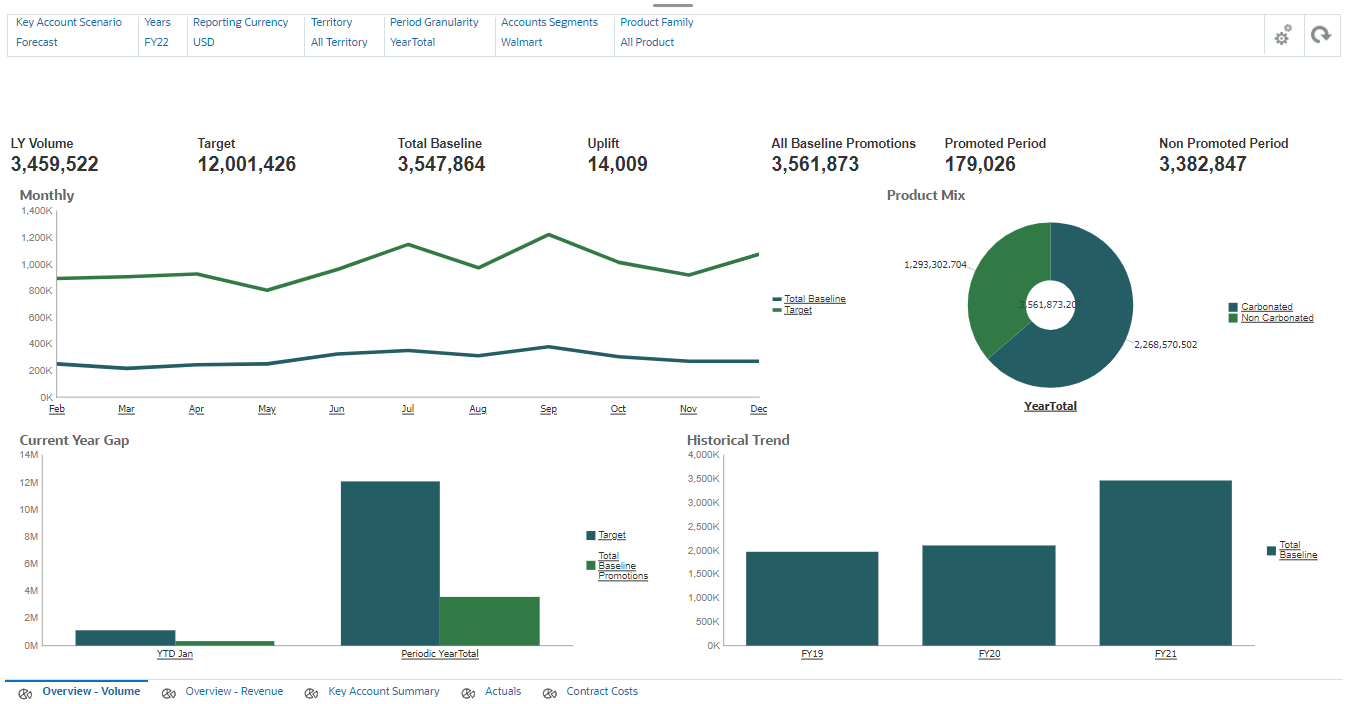
View the Analysis dashboards for a high-level visual summary of key data such as the overall plan by volume or revenue, promoted versus non promoted revenue and volume, key accounts, and profit and loss.
Return to the home page. On the upper right, click (Home).
Use Case 2: Planning for Partial Month Trade Promotions
Planning for Baseline Volume
On the home page, click Key Account Planning and then Baseline.
From the horizontal tabs, click Predict - Volume.
Click Show/Hide to expand the content area.
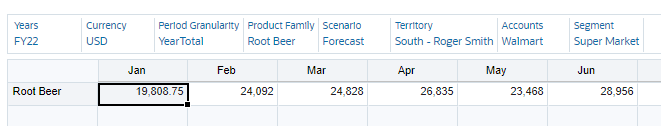
In the POV, set Product Family to Root Beer and review the baseline data on the form.
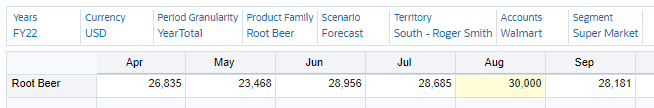
In the grid, for August, set the value to 30K and click Save.
At the information message, click OK.
Planning for Trade Promotions
From the cards on top, click Trade Promotions.
Click Show/Hide to expand the content area.
In the whitespace under Set Up Promotions, right-click and select Add Promotion.
In Add Promotion for Volume, enter or select the following:
In this example, you add a partial-month promotion in August.
By running this promotion, our company expects a sales increase of 10% of the base volume during the specified period.
Click Launch.
At the information message, click OK.
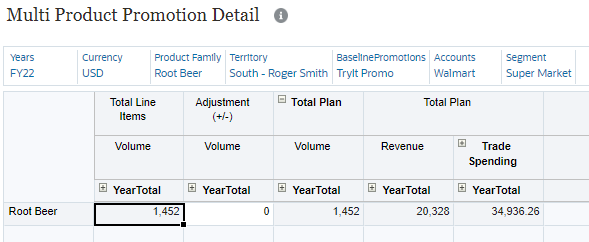
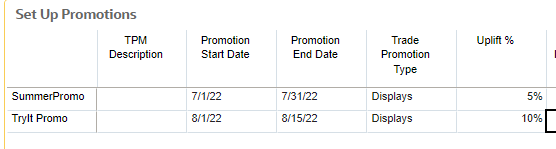
The TryIt Promo trade promotion is listed in the grid.
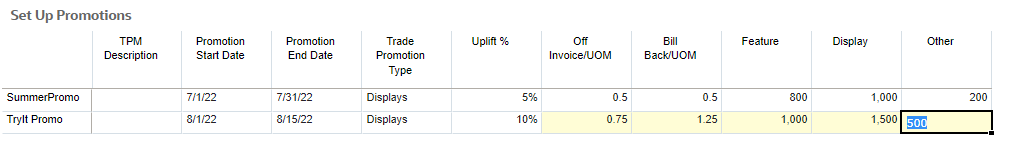
In the grid, for TryIt Promo, enter the following variable and fixed spends:
Hover towards the upper-right area of the top form to display icons. Click (Save).
At the information message, click OK.
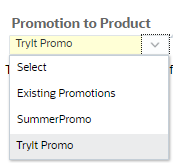
In the bottom-left form, Promotion to Product, select TryIt Promo.
Click (Go).
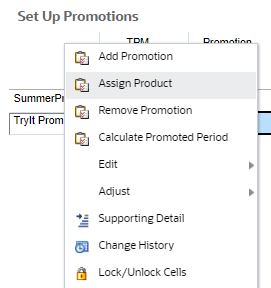
In Setting Up Promotions, right-click TryIt Promo and select Assign Product.
In Promotion to Product, enter or select the following:
In this example, you assign TryIt Promo to a single product (Prod5: Root Beer).
Click Launch.
At the information message, click OK.
The forms at the bottom of the page are updated.
In Setting Up Promotions, right-click TryIt Promo and select Calculate Promoted Period.
In Promoted Period, enter Prod5 and click Launch.
At the information message, click OK.
Hover towards the upper-right area of the top form to display icons. Click (Maximize).
The form is maximized in the content area.
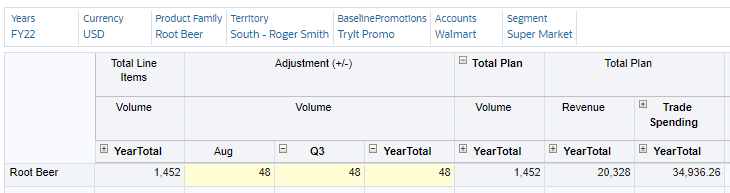
In the Adjustment column, expand Year Total, and then Q3.
For August, enter 48.
You further adjust and override uplifts based on calculated revenue. In this example, you adjust the total planned volume so that it totals 1500.
Click Save.
At the information message, click OK.
Click Restore to return to Promotions Planning - Volume.
At the information message, click OK.
In Setting Up Promotions, right-click TryIt Promo and select Calculate Promoted Period.
To ensure KPIs reflect correct data you run the rule to calculate the promoted period.
In Promoted Period, enter Prod5 and click Launch.
At the information message, click OK.
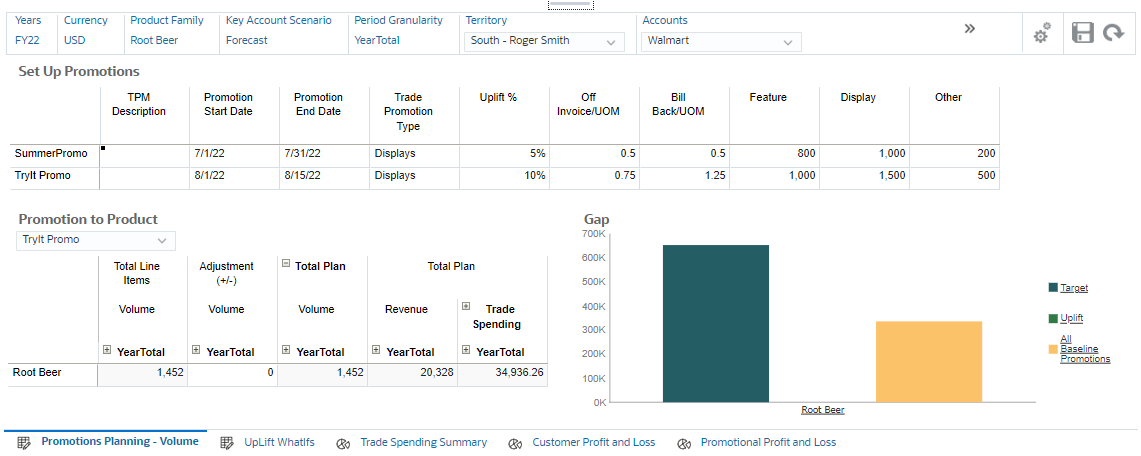
Review the updated volume and promotional data.
The following table includes some insight on how the calculations were done for this promotion:
Formula
Estimated Calculation
Uplift
Baseline volume * Total Promo days for Promo / Total Days in Period * Uplift %
30000 * 15 / 31 * 10%
= 1,452
Adjustment
Input
48
Uplift After Adj
Uplift + Adjustment
1452 + 48 = 1500
Promoted Volume
Baseline * Total Promo Days / Total Days in Period + Uplift After Adjustment
30000 * 15 /31 + 1500 = 16,016
Promoted Volume per Promoted day
Promoted Volume / Total Promo Days
16,016 / 15 = 1,068
Fixed Spend
Input
3000
Variable Spend
Promoted Volumes Per Promoted day * Variable Per Unit * Promo Days
1,068 * 2.0 * 15 = 32,031
Total Trade Spends
Fixed Spend + Variable Spend
3000 + 32031 = 35031
If you want to review how the calculations were made for this Use Case, download and open this spreadsheet in Excel. Review the contents of the Use Case 02 worksheet. After reviewing, return to Key Account Planning.
Click Show/Hide to collapse the content area.
Analyzing Promotions
From the cards on top, click Analysis.
Verify the POV selections.
Step-through the dashboards and review data summaries for the Root Beer product family.
Return to the home page. On the upper right, click (Home).
Use Case 3: Planning with Building Blocks and Promotions Across Periods
Planning for Baseline Volume
On the home page, click Key Account Planning and then Baseline.
From the horizontal tabs, click Predict - Volume.
Click Show/Hide to expand the content area.
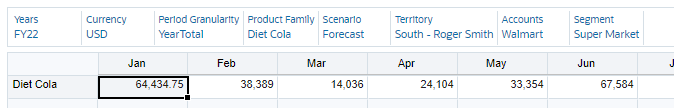
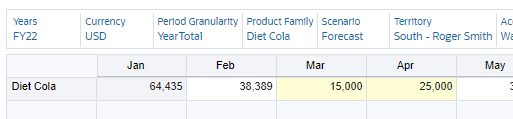
In the POV, set Product Family to Diet Cola.
The grid is updated with baseline volume data for Diet Cola.
Modify the predicted volume for March and April:
Click Save.
At the information message, click OK.
Applying Building Blocks
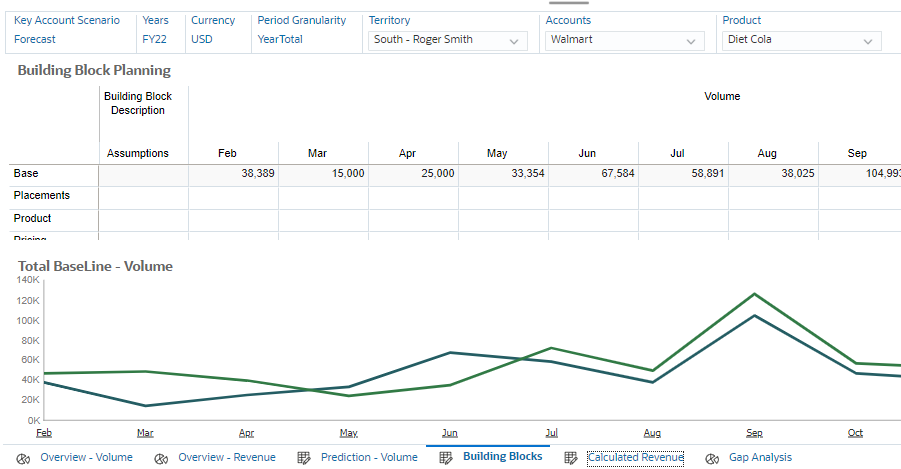
From the horizontal tabs, click Building Blocks then verify the POV selections.
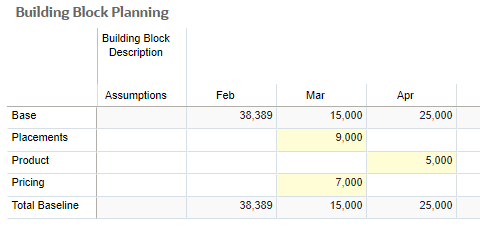
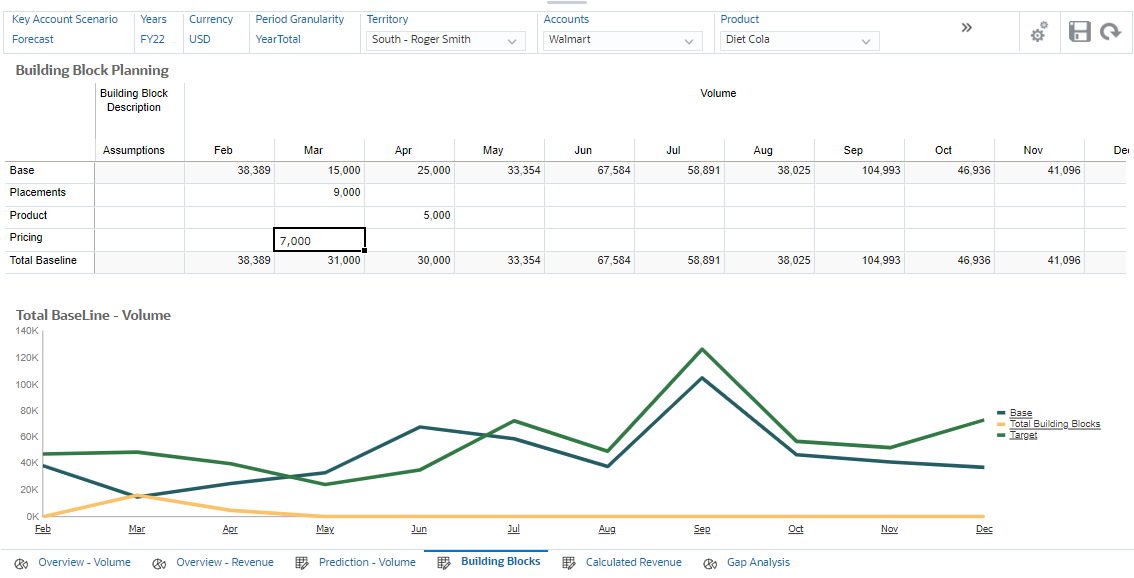
For March and April, enter the following Placements, Product, and Pricing values:
Hover towards the upper-right area of the top form to display icons. Click (Save).
At the information message, click OK.
Review the updated chart in Total Baseline - Volume.
Performing Gap Analysis
From the horizontal tabs, click Gap Analysis.
Review the gap between the target and baseline.
The gap is derived from the difference between the target and the baseline.
Target Baseline Gap = Target – Baseline
Click Show/Hide to collapse the content area.
Planning for Trade Promotions
From the cards on top, click Trade Promotions.
Click Show/Hide to expand the content area.
Verify the POV selections.
In the whitespace under Set Up Promotions, right-click and select Add Promotion.
In Add Promotion for Volume, enter or select the following:
In this example, you add a promotion that runs across periods.
Click Launch.
At the information message, click OK.
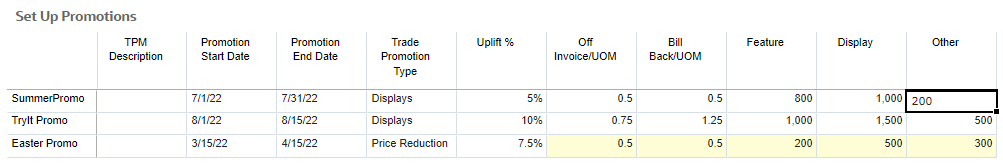
In the grid, for Easter Promo, enter the following variable and fixed spends:
Hover towards the upper-right area of the top form to display icons. Click (Save).
At the information message, click OK.
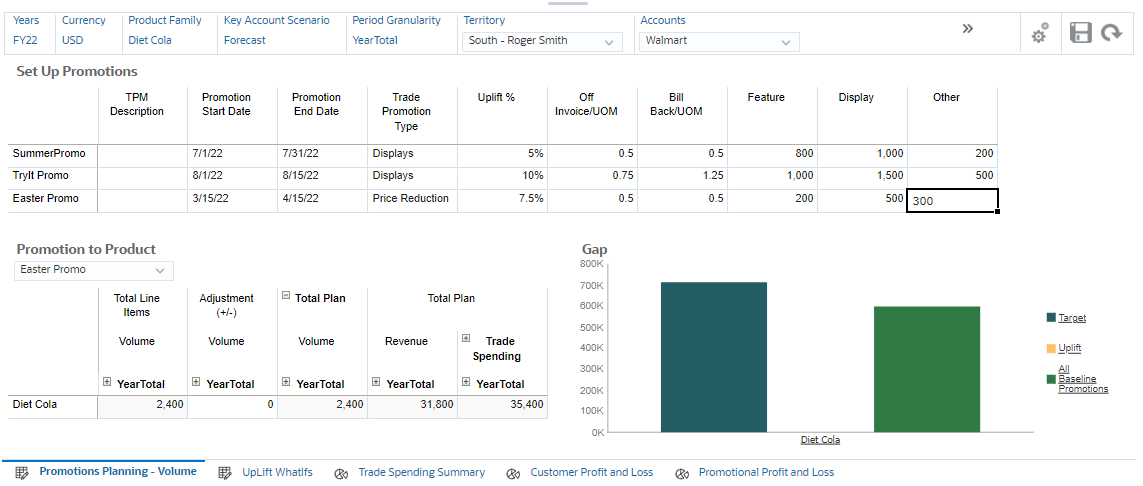
In the bottom-left form, Promotion to Product, select Easter Promo.
Click (Go).
In Setting Up Promotions, right-click Easter Promo and select Assign Product.
In Promotion to Product, enter or select the following:
In this example, you assign Easter Promo to a single product (Prod2: Diet Cola).
Click Launch.
At the information message, click OK.
In Setting Up Promotions, right-click Easter Promo Promo and select Calculate Promoted Period.
In Promoted Period, enter Prod2 and click Launch.
At the information message, click OK.
Review the updated volume, uplifts, and promotional data.
If you want to review how the calculations were made for this Use Case, download and open this spreadsheet in Excel. Review the contents of the Use Case 03 worksheet. After reviewing, return to Key Account Planning.
Click Show/Hide to collapse the content area.
Analyzing Promotions
From the cards on top, click Analysis.
Verify the POV selections.
Step-through the dashboards and review data summaries for the Diet Cola product family.
Return to the home page. On the upper right, click (Home).
Use Case 4: Overlapping Promotions
Planning for Baseline Volume
On the home page, click Key Account Planning and then Baseline.
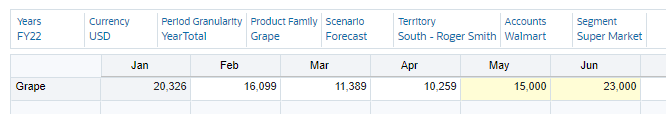
From the horizontal tabs, click Predict - Volume.
Click Show/Hide to expand the content area.
In the POV, set Product Family to Grape.
Adjust values for the months of May and June.
Click Save.
At the information message, click OK.
Performing Gap Analysis
From the horizontal tabs, click Gap Analysis.
Review the gap between the target and baseline.
Click Show/Hide to collapse the content area.
Planning for Trade Promotions
From the cards on top, click Trade Promotions.
Click Show/Hide to expand the content area.
Verify the POV selections.
In the whitespace under Set Up Promotions, right-click and select Add Promotion.
In Add Promotion for Volume, enter or select the following:
Click Launch.
At the information message, click OK.
In the grid, for Fun Frolic, enter the following variable and fixed spends:
Hover towards the upper-right area of the top form to display icons. Click (Save).
At the information message, click OK.
In the whitespace under Set Up Promotions, right-click and select Add Promotion.
You'll be adding another promotion that overlaps with the previous one.
In Add Promotion for Volume, enter or select the following:
Click Launch.
At the information message, click OK.
In the grid, for Spring High, enter the following variable and fixed spends:
Hover towards the upper-right area of the top form to display icons. Click (Save).
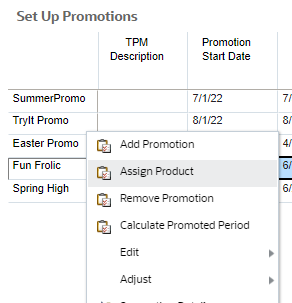
In Setting Up Promotions, right-click Fun Frolic and select Assign Product.
In Promotion to Product, enter or select the following:
In this example, you assign Fun Frolic to a single product (Prod4: Grape).
Click Launch.
At the information message, click OK.
In Setting Up Promotions, right-click Spring High and select Assign Product.
In Promotion to Product, enter or select the following:
In this example, you assign Spring High to a single product (Prod4: Grape). This overlaps two promos assigned to the same product.
Click Launch.
At the information message, click OK.
In Setting Up Promotions, right-click Fun Frolic and select Calculate Promoted Period.
In Promoted Period, enter Prod4 and click Launch.
The Calculate Promoted Period rule calculates all promotions for Prod4: Grape.
At the information message, click OK.
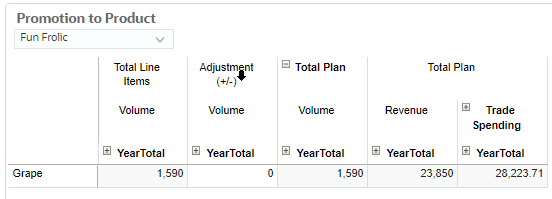
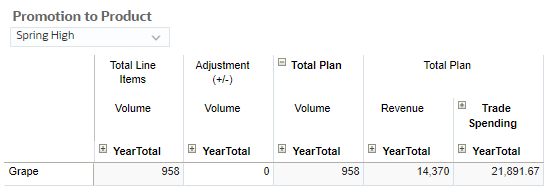
Review the updated volume, uplifts, and promotional data. In Promotion to Product, switch between promotion names to view specific data.
If you want to review how the calculations were made for this Use Case, download and open this spreadsheet in Excel. Review the contents of the Use Case 04 worksheet. After reviewing, return to Key Account Planning.
Click Show/Hide to collapse the content area.
Analyzing Promotions
From the horizontal tabs, click Promotional Profit and Loss.
Review the promotional profit and loss calculations for multiple, overlapping promotions for the Grape product.
Click Show/Hide to collapse the content area.
From the cards on top, click Analysis.
Step-through the dashboards and review data summaries for the Grape product family.
Return to the home page. On the upper right, click (Home).
Use Case 5: Promoting Multiple Products
In this Use Case, you add a promotion for multiple products.
Planning for Baseline Volume
On the home page, click Key Account Planning and then Baseline.
From the horizontal tabs, click Predict - Volume.
Click Show/Hide to expand the content area.
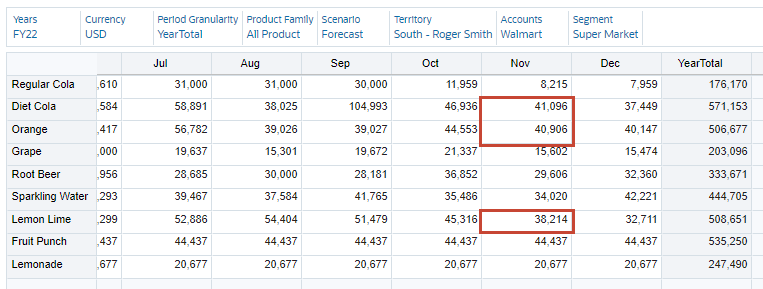
In the POV, set Product Family to All Product.
Review and take note of the values for Diet Cola, Orange, Lemon Lime for the month of November.
Click Show/Hide to collapse the content area.
Planning for Trade Promotions
From the cards on top, click Trade Promotions.
Click Show/Hide to expand the content area.
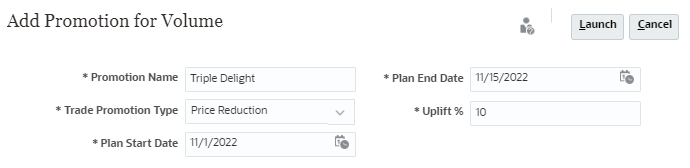
In the whitespace under Set Up Promotions, right-click and select Add Promotion.
In Add Promotion for Volume, enter or select the following:
Click Launch.
At the information message, click OK.
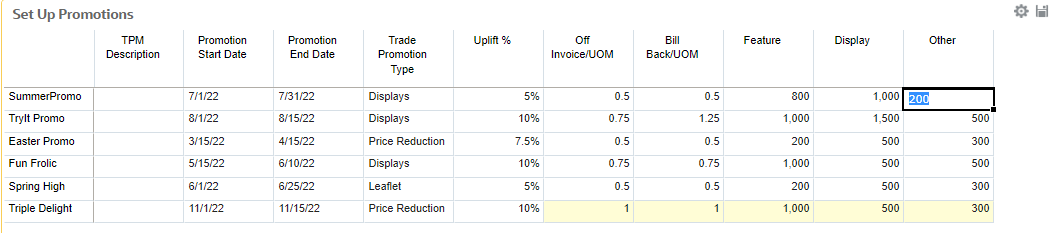
In the grid, for Triple Delight, enter the following variable and fixed spends:
Hover towards the upper-right area of the top form to display icons. Click (Save).
If prompted with an information message, click OK.
In Setting Up Promotions, right-click Triple Delight and select Assign Product.
In Promotion to Product, enter or select the following:
In this Use Case, you assign Triple Delight to multiple products: Diet Cola (Prod2), Orange (Prod3), Lemon Lime (Prod7).
Click Launch.
At the information message, click OK.
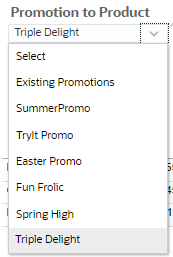
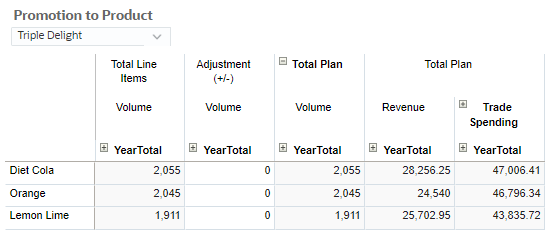
In the bottom-left form, Promotion to Product, select Triple Delight.
Click (Go).
Review the associated volume, revenue, and trade spending for each product associated with the promotion.
In Setting Up Promotions, right-click Triple Delight and select Calculate Promoted Period.
In Promoted Period, enter Prod2,Prod3,Prod7 and click Launch.
At the information message, click OK.
If you want to review how the calculations were made for this Use Case, download and open this spreadsheet in Excel. Review the contents of the Use Case 05 worksheet. After reviewing, return to Key Account Planning.
Click Show/Hide to collapse the content area.
Analyzing Promotions
From the cards on top, click Analysis.
Review the promoted period for all products.
Step-through the dashboards and review data summaries for the all products. To view the promoted period data for each product, set Product Family in the POV to that specific product.
Managing Assumptions and Reviewing Customer Profit & Loss
You can add assumptions that drive revenue calculations for promotions and key account planning. Enter key factors in your application for volume and revenue based applications. For example, the sales price per unit drives revenue calculations.
You can enter assumptions for:
Sales Price Per Unit
Cost of Sales
Contract Rates
You can manually enter assumptions, or import them from a pricing master, or another ERP system.
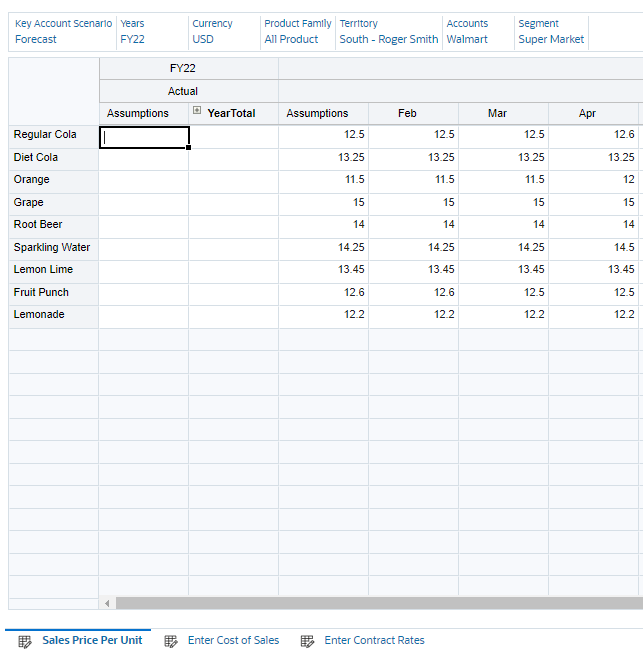
Sales Per Unit
You can enter sales price at the beginning balance or at a monthly level if the price is variable across
different periods. If there is no monthly value, the beginning balance value is
used in calculations.
From the cards on top, click Assumptions.
Verify that you are on Sales Price Per Unit and the following members are selected in the POV:
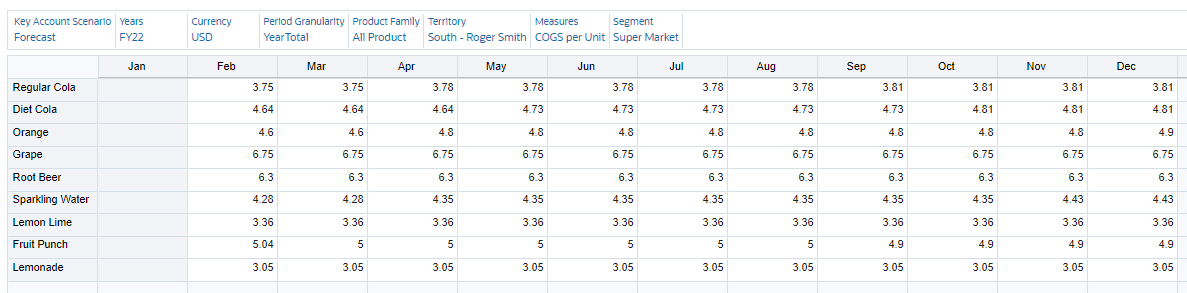
Cost of Sales
Enter the cost per unit, defined for each product across any
customer. This value drives the cost of goods sold (COGs) for the Customer Profit and Loss.
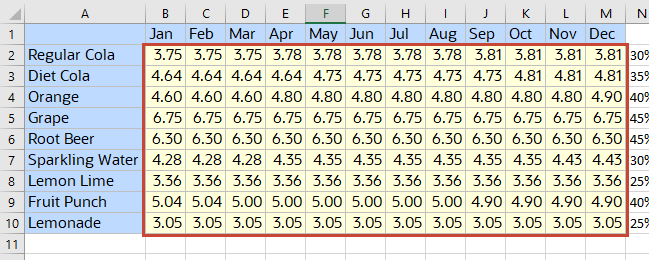
See the What Do You Need? section of this tutorial for files included in this tutorial.
Review the contents of the spreadsheet. You will be copying and pasting data from the spreadsheet into the Enter Cost of Sales form in Key Account Planning.
Return to Key Account Planning in your browser.
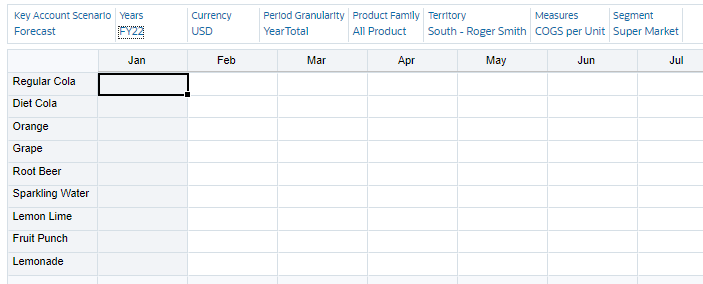
From the horizontal tabs, click Enter Cost of Sales.
Verify the POV selections. The grid should not have any data displayed.
Note which data cells allow for data entry. In this example. January is read-only. Data can be entered only into the data cells starting in February.
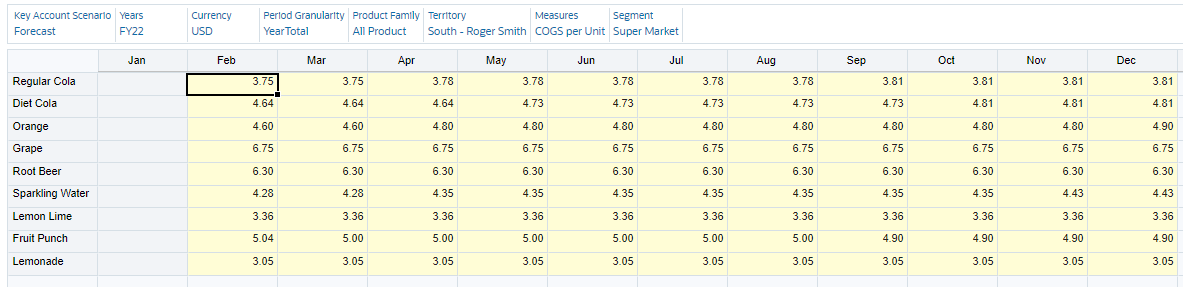
From the SPromPlan_CoS.xlsx spreadsheet, select and copy data, then paste it into the Enter Cost of Sales form.
Click Save.
When saved, the background of the data cells change to white.
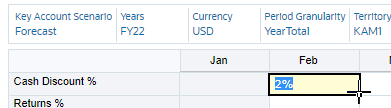
Contract Rates
Enter rates as a percentage, or as a flat rate for
Listing Fees and COGS per Unit.
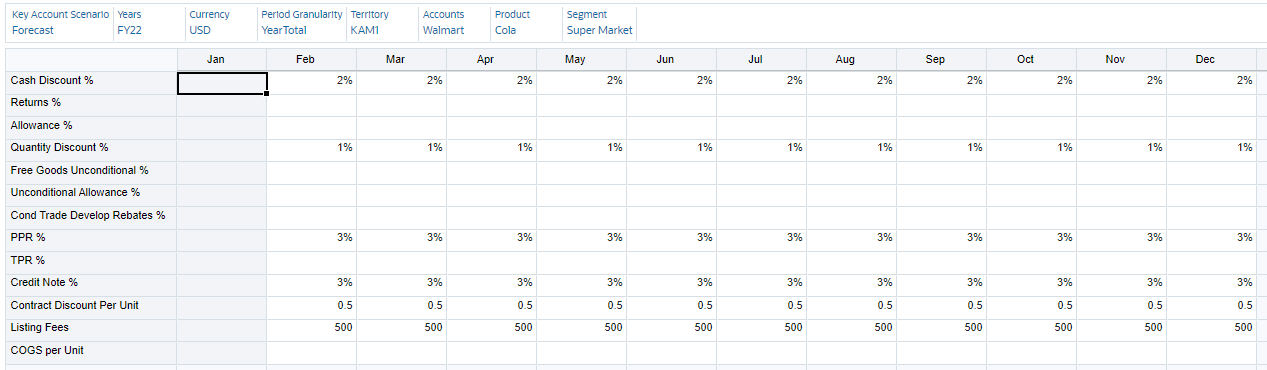
From the horizontal tabs, click Enter Contract Rates.
In the POV, select the following members:
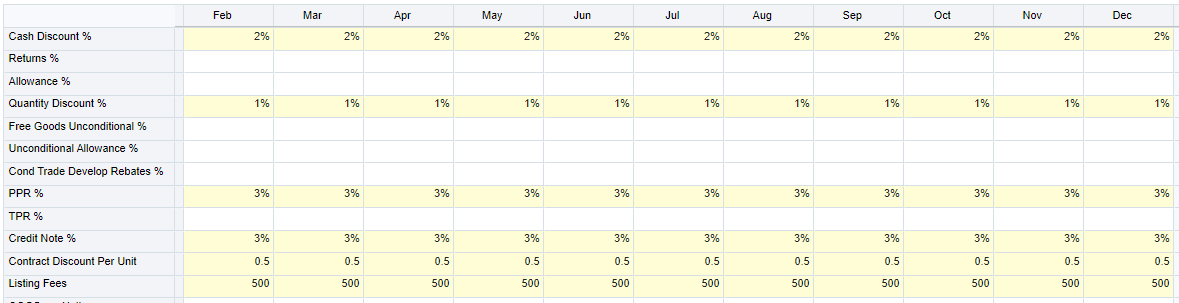
In the grid, for Cash Discount % and Feb, enter 2%. Then, position your cursor in the lower-right corner of the cell (called a "fill handle") so that it turns into a plus sign. Drag the fill handle across the monthly periods, until Dec.
The data you entered in the first cell is copied across periods.
Perform step 3 for the following assumptions:
Quantity Discount %: 1%
PPR %: 3%
Credit Note %: 3%
Contract Discount Per Unit: 0.5
Listing Fees: 500
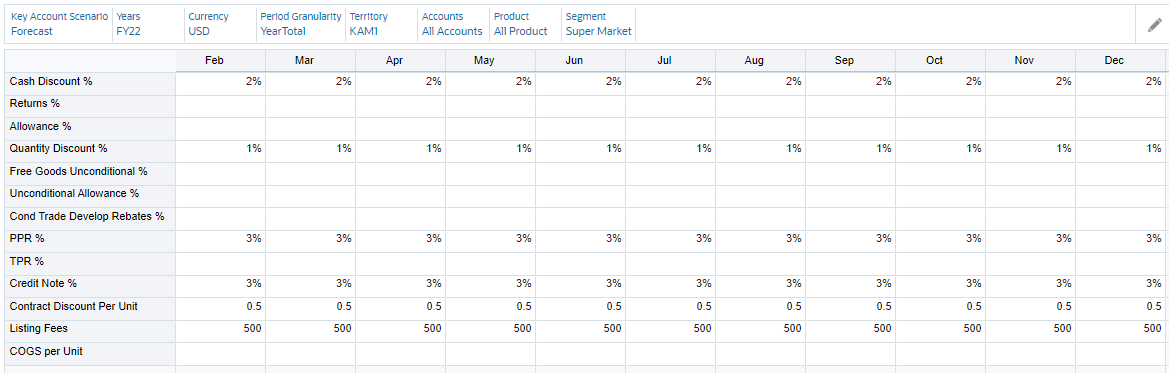
Click Save.
At the information message, click OK.
For contract rates, when you save your changes, the assumptions that you
entered populate all the way down through the hierarchy. You can adjust these
values as needed for members at lower levels in the hierarchy. When you
save the adjustments, they populate down to any members lower in the
hierarchy. Any further changes you make at higher levels in the hierarchy
continue to percolate down to any members lower in the hierarchy.
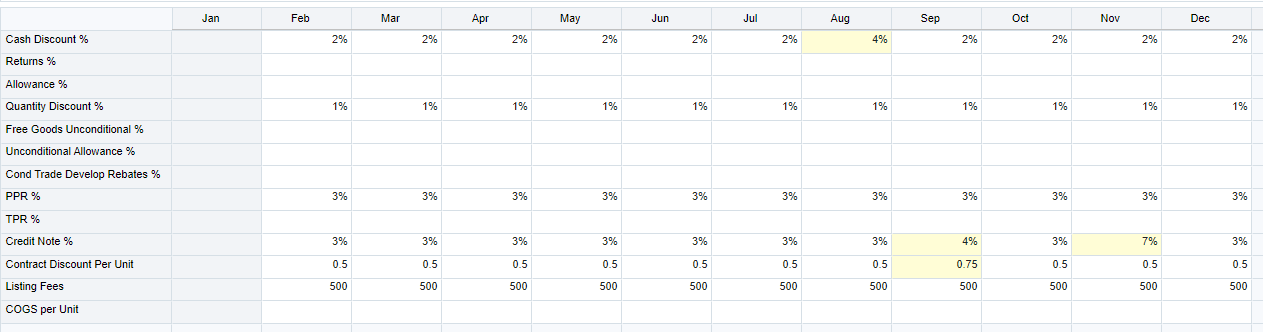
In the POV, set Accounts to Walmart and Product to Cola.
Notice that the assumptions entered at a higher level were copied to members at a lower level. You can adjust assumptions at any level in the hierarchy you have access to.
Modify assumptions for the following:
Cash Discount % | Aug: 4%
Credit Note % | Sep: 4%
Credit Note % | Nov: 7%
Contract Discount Per Unit | Sep: 0.75
Click Save.
At the information message, click OK.
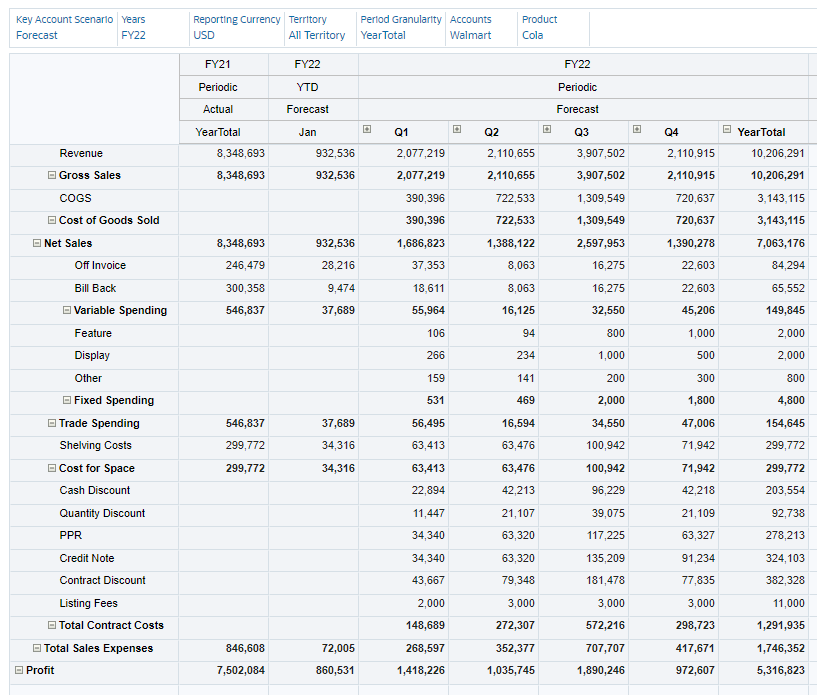
Reviewing Customer Profit and Loss
From the cards on top, click Trade Promotions.
From the horizontal tabs, click Customer Profit and Loss.
Under FY22, Periodic, Forecast, expand YearTotal.
Review and verify that the updated assumptions are reflected in Customer Profit and Loss calculations.
This tutorial shows you how to plan for baseline volume, add building blocks, perform gap analysis, plan trade promotions, perform what-if analysis, and analyze promotions in Key Account Planning using Use Cases.
This software and related documentation are provided under a license agreement containing restrictions on use and disclosure and are protected by intellectual property laws. Except as expressly permitted in your license agreement or allowed by law, you may not use, copy, reproduce, translate, broadcast, modify, license, transmit, distribute, exhibit, perform, publish, or display any part, in any form, or by any means. Reverse engineering, disassembly, or decompilation of this software, unless required by law for interoperability, is prohibited.
If this is software or related documentation that is delivered to the U.S. Government or anyone licensing it on behalf of the U.S. Government, then the following notice is applicable:
U.S. GOVERNMENT END USERS: Oracle programs (including any operating system, integrated software, any programs embedded, installed or activated on delivered hardware, and modifications of such programs) and Oracle computer documentation or other Oracle data delivered to or accessed by U.S. Government end users are "commercial computer software" or "commercial computer software documentation" pursuant to the applicable Federal Acquisition Regulation and agency-specific supplemental regulations. As such, the use, reproduction, duplication, release, display, disclosure, modification, preparation of derivative works, and/or adaptation of i) Oracle programs (including any operating system, integrated software, any programs embedded, installed or activated on delivered hardware, and modifications of such programs), ii) Oracle computer documentation and/or iii) other Oracle data, is subject to the rights and limitations specified in the license contained in the applicable contract. The terms governing the U.S. Government's use of Oracle cloud services are defined by the applicable contract for such services. No other rights are granted to the U.S. Government.
This software or hardware is developed for general use in a variety of information management applications. It is not developed or intended for use in any inherently dangerous applications, including applications that may create a risk of personal injury. If you use this software or hardware in dangerous applications, then you shall be responsible to take all appropriate fail-safe, backup, redundancy, and other measures to ensure its safe use. Oracle Corporation and its affiliates disclaim any liability for any damages caused by use of this software or hardware in dangerous applications.
Oracle and Java are registered trademarks of Oracle and/or its affiliates. Other names may be trademarks of their respective owners.
Intel and Intel Inside are trademarks or registered trademarks of Intel Corporation. All SPARC trademarks are used under license and are trademarks or registered trademarks of SPARC International, Inc. AMD, Epyc, and the AMD logo are trademarks or registered trademarks of Advanced Micro Devices. UNIX is a registered trademark of The Open Group.
This software or hardware and documentation may provide access to or information about content, products, and services from third parties. Oracle Corporation and its affiliates are not responsible for and expressly disclaim all warranties of any kind with respect to third-party content, products, and services unless otherwise set forth in an applicable agreement between you and Oracle. Oracle Corporation and its affiliates will not be responsible for any loss, costs, or damages incurred due to your access to or use of third-party content, products, or services, except as set forth in an applicable agreement between you and Oracle.
 (Home).


 (Paste).
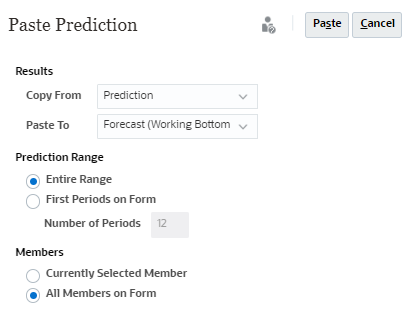

 (Save).
 (Go).
(Go).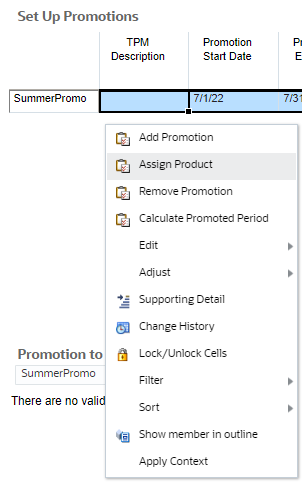


 (Maximize).