Analyze Calculation Workflow
A look at calculation workflow can help you set up reports. All input arrives in the NoRule member of the Rule dimension. From there, rules assign funds to sources and destinations depending on rule definitions. As rules run, adjustments and allocations in and out take place. Each pair of adjustments and allocations results in a zero sum to balance the transaction. The difference between Allocation In and Allocation Out appears in the Remainder member of the Balance dimension. The Remainder member provides the input for each subsequent rule that runs.
These changes can be tracked by queries, reports, analysis views, and in the Rule Balancing screen.
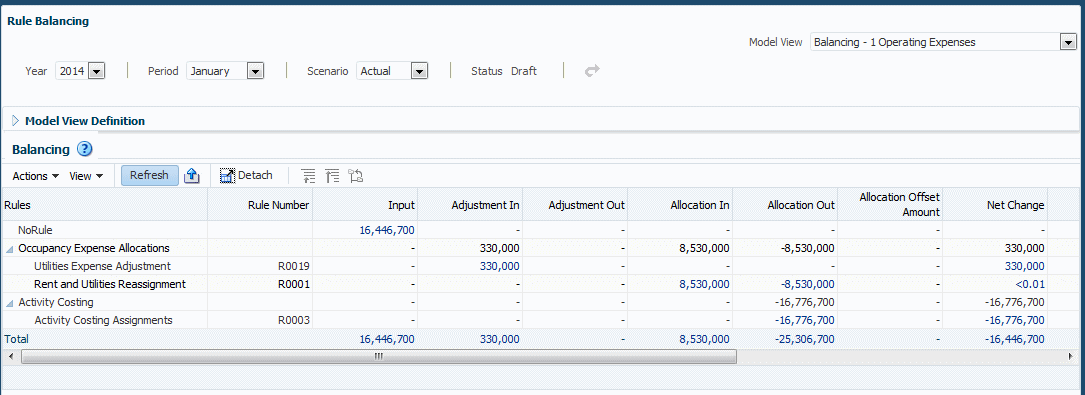
Figure 11-1 Rule Balancing Screen with Data

In the Rule Balancing screen, Rule dimension members are on the rows and Balance members are on the columns. As you read across a row, you can see fund distributions taken for that rule as it ran. The Profitability and Cost Management calculation process captures where money came from and where it went, rule by rule. The Rule Balancing screen shows summary amounts. With Oracle Smart View for Office installed, you can click on a link in the Rule Balancing screen to drill down . Then, ad hoc analysis in Smart View can help you show the flow of funds within each rule.
Data is captured in a multidimensional way that enables you to reveal detail in reports as well as in Smart View. For more information about the Rule Balancing screen, see Rule Balancing for Application Validation. To learn about Smart View and Financial Reporting, visit the Library (Using Profitability and Cost Management Library), then Books, and then see the User section.