Running Queries from the Intelligence Panel
Service Administrators and others with sufficient security provisioning can define queries to gather data for management reporting, segmented profitability analysis, rule analysis, input data verification, and more.
You can use queries to generate financial reports (Working With Profitability and Cost Management Financial Reports). You can also run queries from within the Intelligence panel to display retrieved data in the form of tables. You can then export the tables for printing or further analysis.
Note:
You can use Oracle Smart View for Office as a convenient way to view data from a query. Once the data is in Smart View, you can use it as the starting point for further ad hoc analysis.
To run a query, install Oracle Smart View for Office as described in Getting Started Guide for Administrators, and then follow these steps:
-
On the Profitability and Cost Management Home page, click Intelligence,
 , and then
  .
.
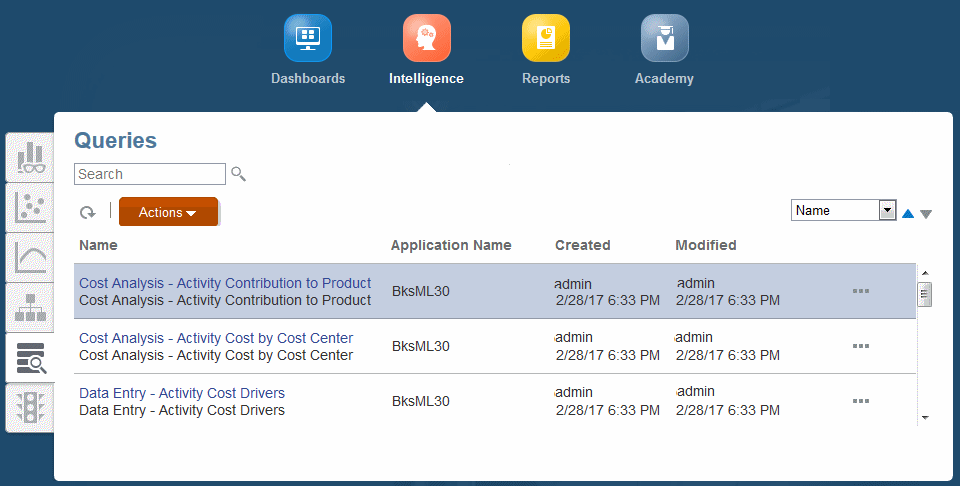
Figure 13-4 Queries Screen, Intelligence Panel

-
Select a query.
You can use the drop-down menu with column headings to sort the selected column in ascending or descending order.
Click Refresh,
 , and then click the query name to run the query. Connect to Smart View.
Query results display in Smart View for printing and further analysis.
Results have special formatting that makes them easier to interpret and present. For more information, see Formatting Query Results in Smart View.
-
Optional: Click Actions, and then Export Query Results to export the query in .csv format, to import into spreadsheets and other compatible applications.
Note:
Export Query Results works for queries that return less than 5 million cells.
You can enter a name for the file, indicate whether to export only Level 0 data (the lowest level data, such as Month for Period data), and specify a Rounding Precision level (default is equal to two places). When you click OK, the file is sent to the File Explorer Outbox.
-
Optional: Click Actions, and then Diagnose to view the following information that can help you fine-tune the query for optimal performance:
-
The actual MDX query produced by the selected query definition
-
The query run time in seconds
-
The number of cells returned by the query
In the Diagnose Query screen, you can click Refresh to view the latest information for the selected query. Click Save to File to save the information to result.txt in the File Explorer Outbox.
-
-
Optional: To save the selected query to Favorites on your home page, click Settings,
 and then click Add as Favorite. The query displays on the Home page. You can run it directly from there.