Working with Analysis Views
Similar to queries, analysis views provide a way to locate and save sets of data drawn from the database cube for the current application.
You can specify dimensions and members to view. Once created, analysis views are displayed in a selection list. You can use them as basic data reports, as the basis for dashboards, and to build profit curve charts. You can also export their data to Microsoft Excel for further processing.
You can run analysis views unless they contain restricted data. With appropriate security provisioning, you also can create and edit analysis views.
To run, create, or edit an analysis view, click Intelligence, ![]() , and then
, and then ![]() .
.
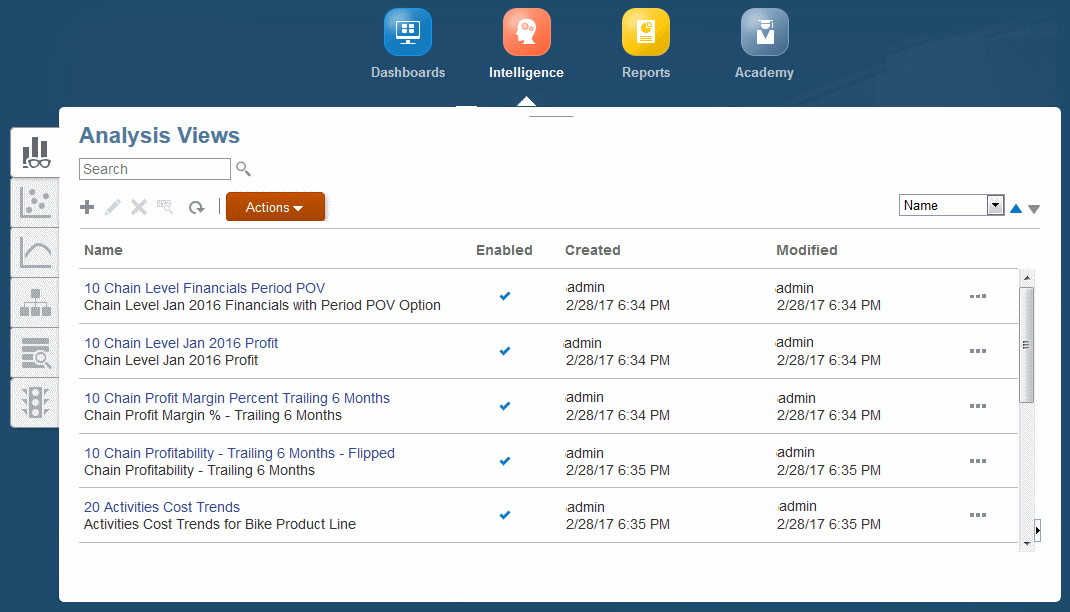
Figure 6-1 Analysis Views Screen

As shown in Analysis View Screen, the Analysis Views screen contains a list of analysis views and space for optional descriptions. A check in the Enabled column indicates that an analysis view is ready for use.
The Analysis Views screen contains the following controls: Create, Edit, Delete, Inspect, and Refresh. The name of each displays when you point to it. For icons and descriptions, see Common Feature Controls.
The Actions menu offers two options:
-
Copy -- Saves the selected view with a different name.
-
Diagnose -- Displays the underlying query and performance information for you to view and save as a file.
Note:
The control functionality and Actions menu options are also available through the Actions button, ![]() . You can also choose to add the selected analysis view to the Favorites list on the Home page.
. You can also choose to add the selected analysis view to the Favorites list on the Home page.