Examples of Sprint Burndown
Analyze the sprint burndown to improve the planning of future sprints in Agile product development. The sprint burndown graph captures planned hours from the project plan and actual hours from the progress reported by team members.
The following information must be available before you can analyze sprint burndown for your Agile scrum team:
-
Project plan with tasks created from backlog items.
-
Sprint when the backlog items will be worked on.
-
Planned hours for project tasks.
-
Actual hours reported by team members on tasks.
-
Updated sprint burndown graph with latest data.
The following example scenarios are based on the story points assigned to backlog items at the start of the sprint.
Actual Hours are Greater Than Ideal Hours
The team consumes more hours on tasks in the sprint than originally planned.
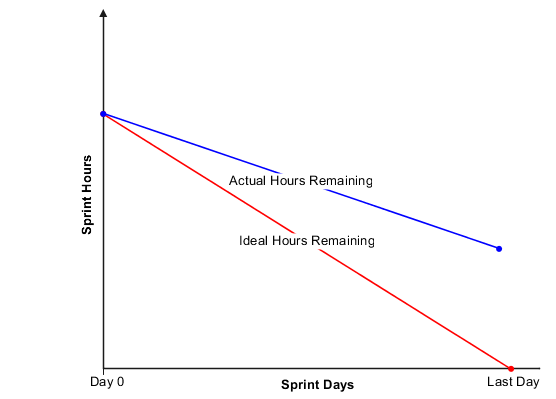
Some possible reasons why the hours consumed is greater than the ideal hours:
-
Over estimation of planned backlog items for the sprint based on complexity.
-
Unknown issues that took time to resolve.
-
Dependencies on deliverables of other teams.
Actual Hours are Ideal
The team consumes the expected number of hours on tasks in the sprint.
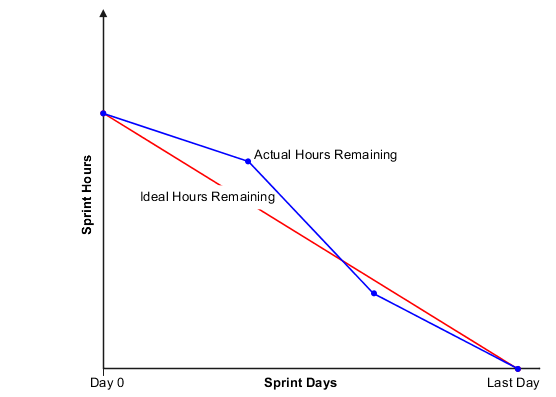
Less variation between and ideal and actual remaining hours indicates that the scrum team can accurately assess backlog item complexity and arrive at the number of hours required to complete work in a sprint.
Actual Hours are Less Than Ideal Hours
The team consumes less hours on tasks in the sprint than originally planned.
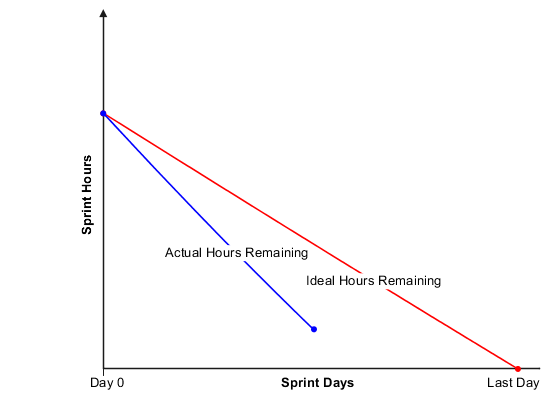
A possible reason why hours consumed are less than ideal is that you under estimated backlog item complexity and planned more time than required to complete work in the sprint.